

【Since there was no movement in the trade forecast, skip ▶ Results of the trade forecast for December 24, 2025】【Trade forecasts with a hit rate of 91.1% that can be understood in just 3 minutes!】
Hello! This is Wave Master FX!
In this article, we will perform a market environment analysis for today and publish the latest trade predictions in real time.
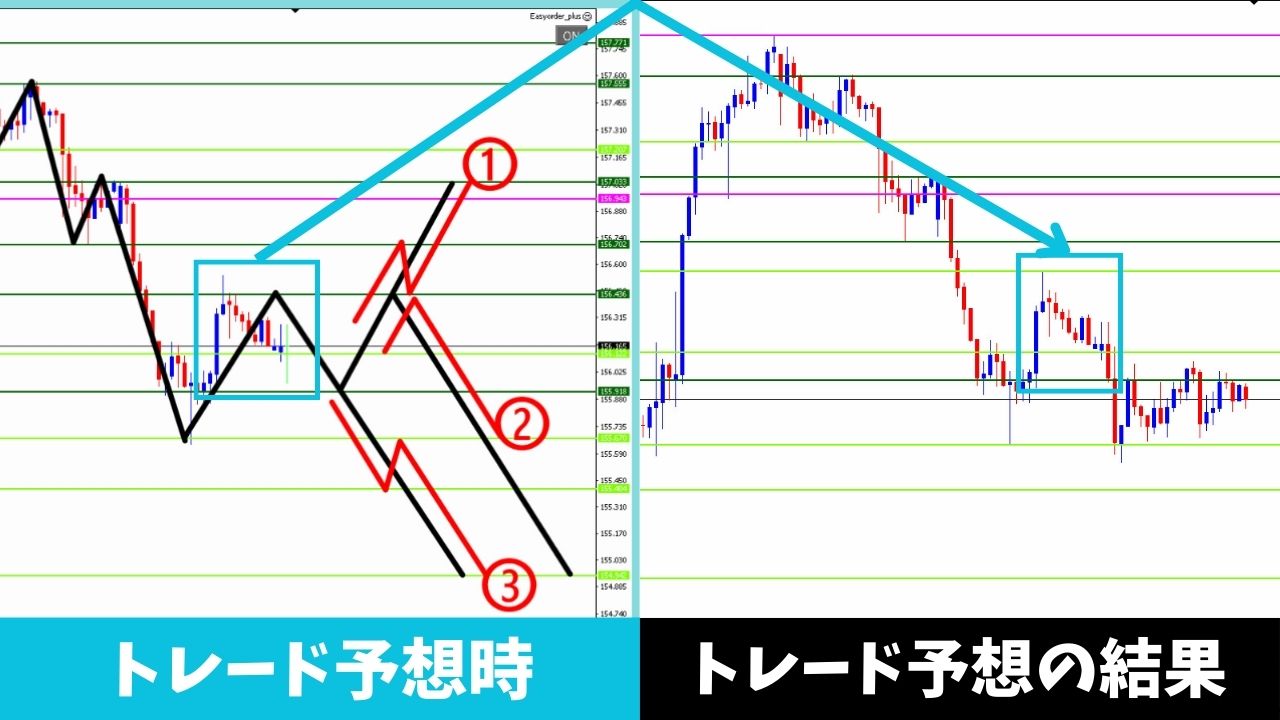
The result of the previous trade prediction (Thursday, December 24, 2025) is shown below.
※To receive the latest trade predictions in real time,participate in the community for “Trade Predictions” that anyone can joinorthe “Purchaser-Only” communityplease join.
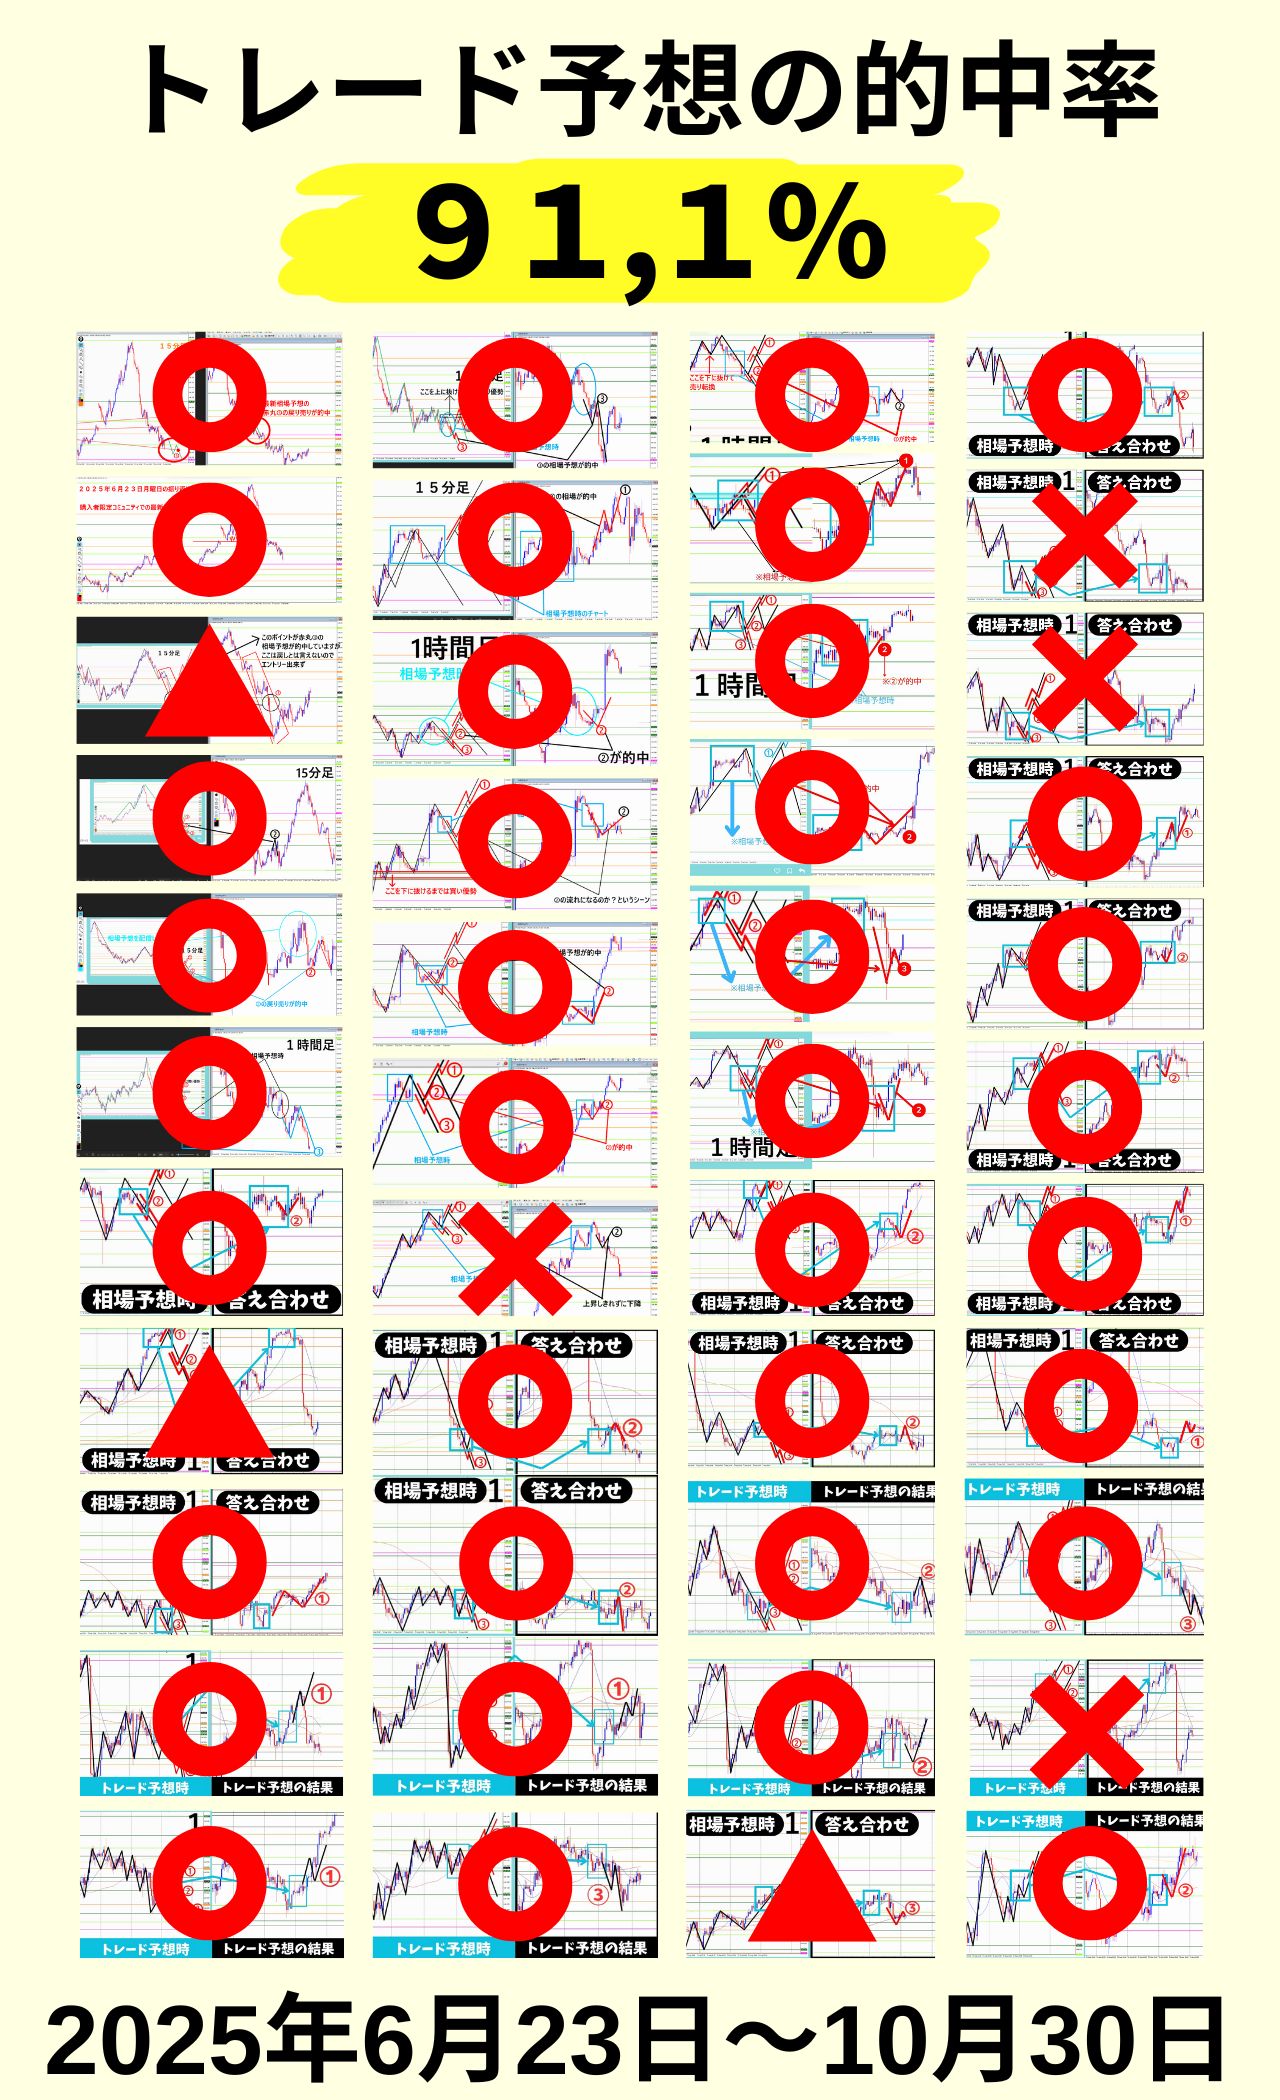
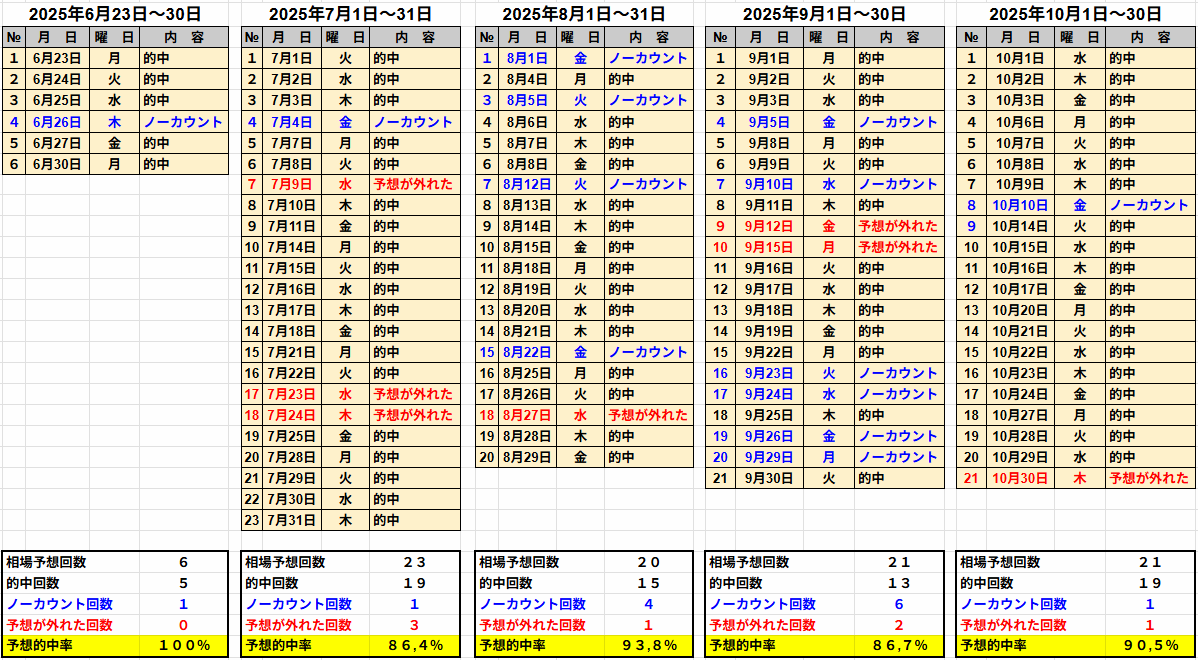
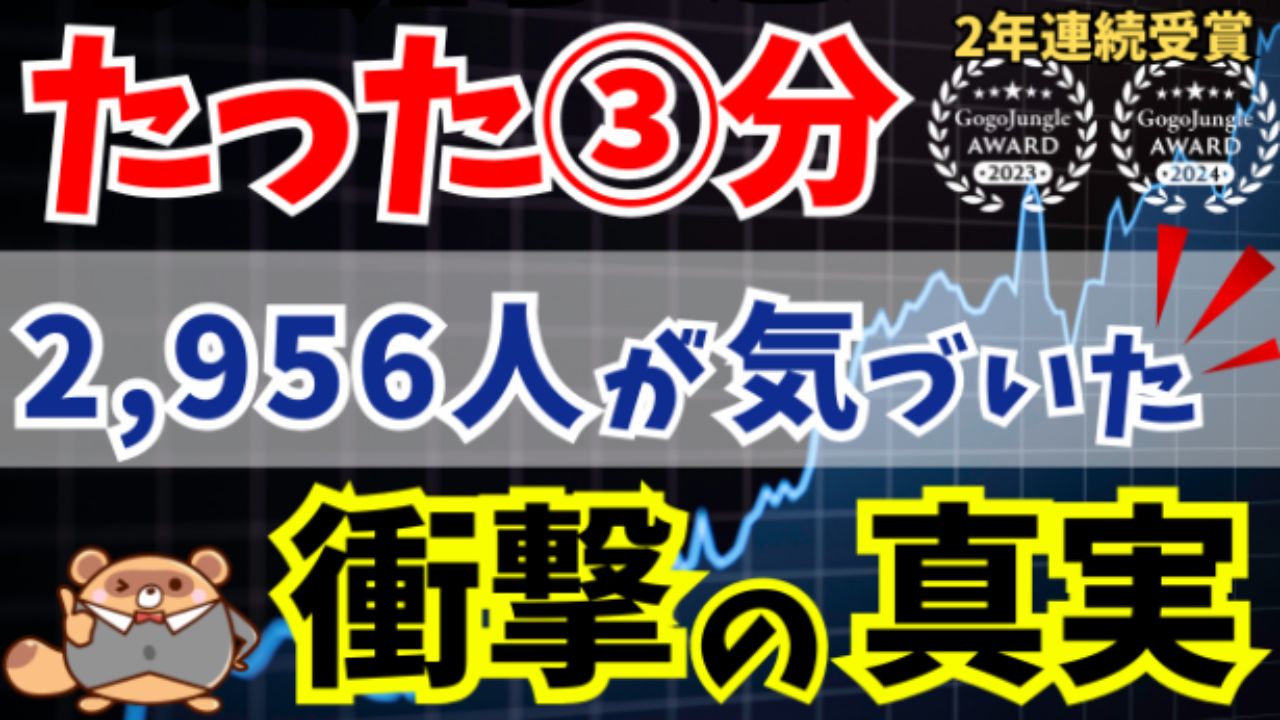
Market Prediction accuracy is remarkably 91.1% (as of October 30, 2025)
▼ ▼ ▼ ▼ ▼
Wave Master FX’s“Incredibly Simple Method” within the e-book,with an 80% win rateis revealed to be in methods also公開, purchasers of the material can profit simply by copying, the same market predictions can be formed.
Now, let’s dive in and perform the environment recognition while explaining today’s latest trade predictions (narrowed to three entry points).
▼ ▼ ▼ ▼ ▼
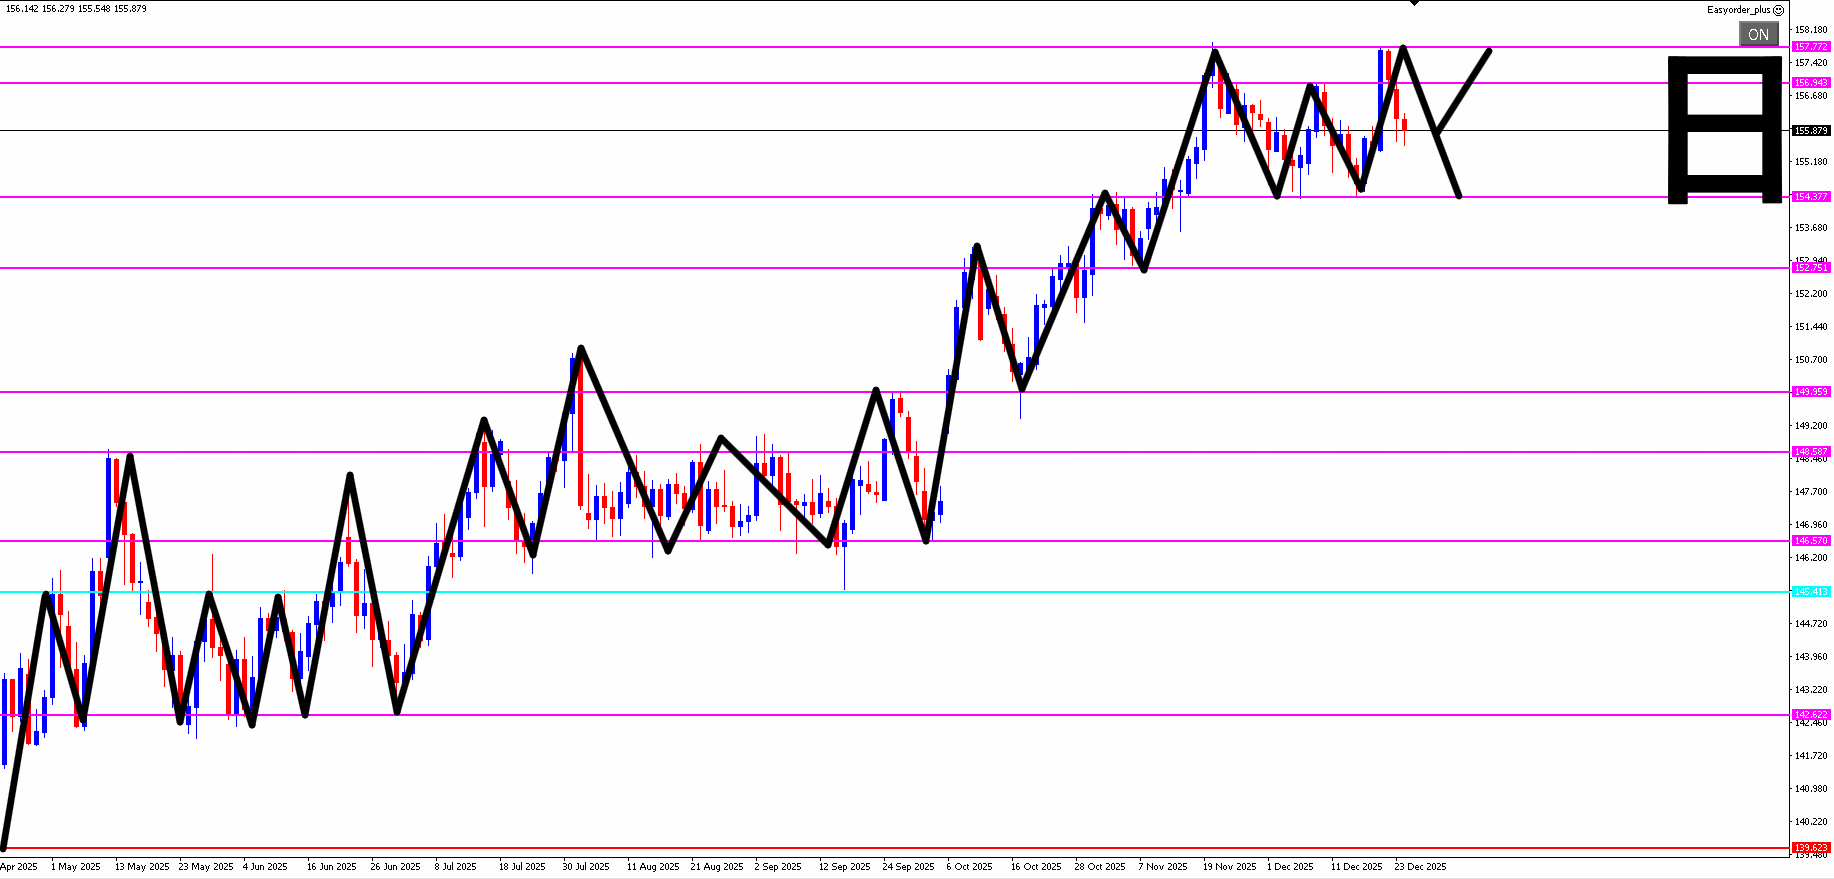
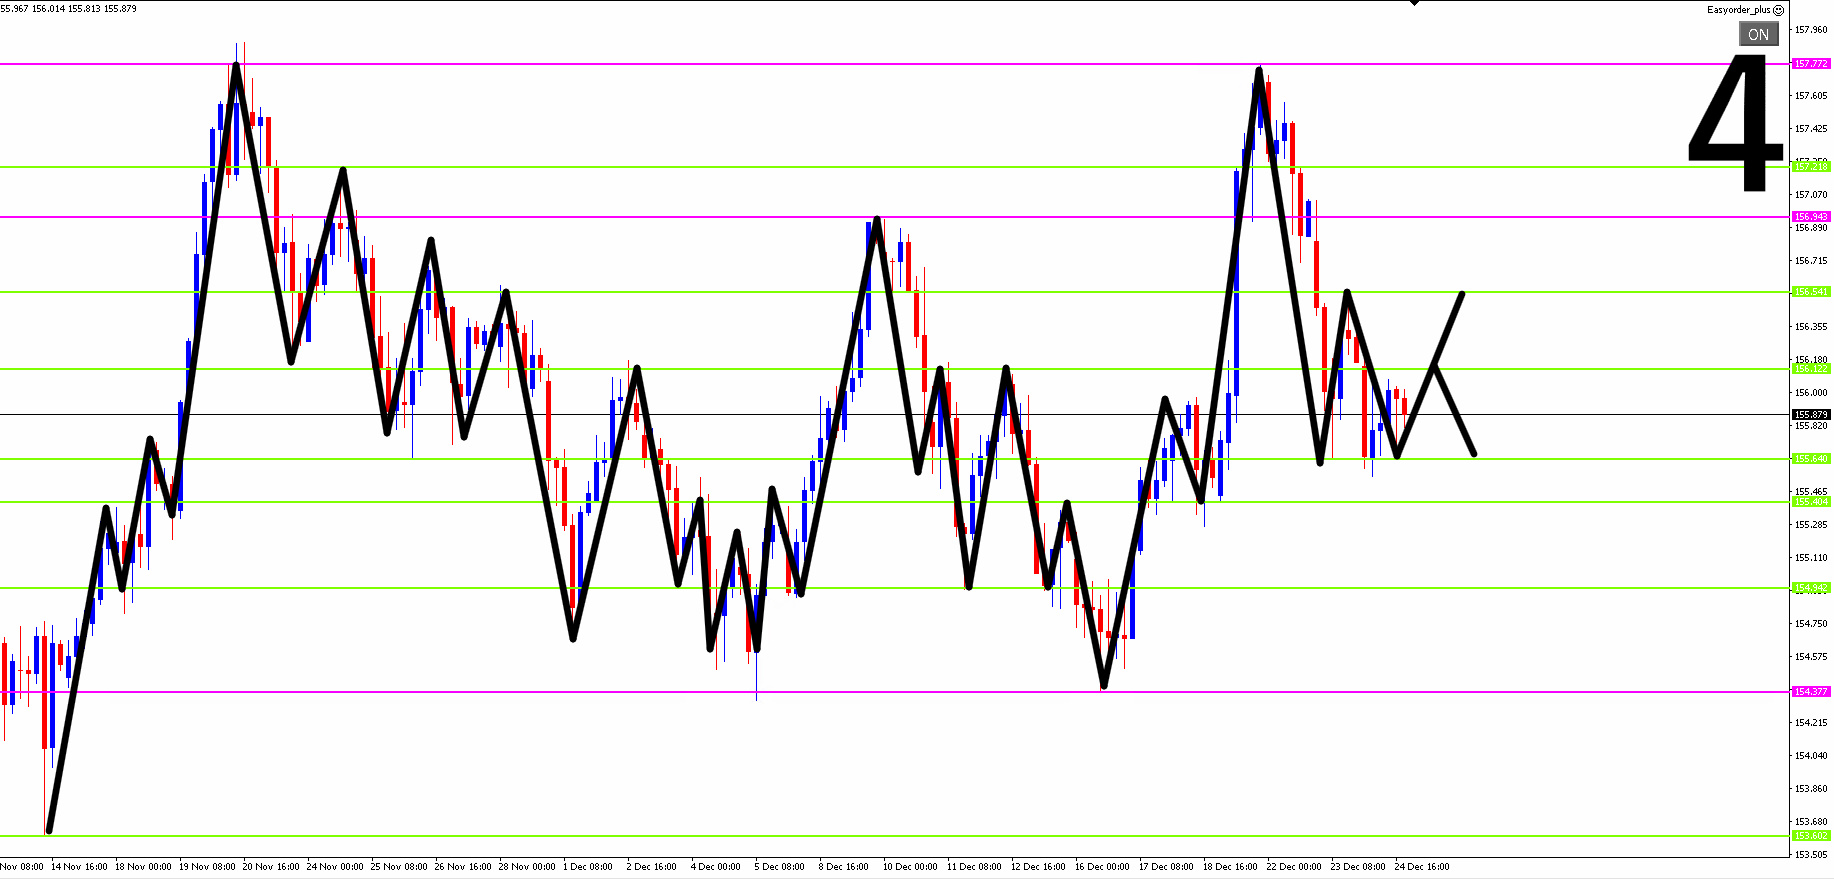
● Daily chart: bullish dominance — will it rise toward a new high, or fall toward the recent low? This is the current market condition.
【1 hour chart environment】
● 1-hour chart: bearish dominance — will it fall from the upper end of the range, or break below the lower end and fall? This is the current market condition.
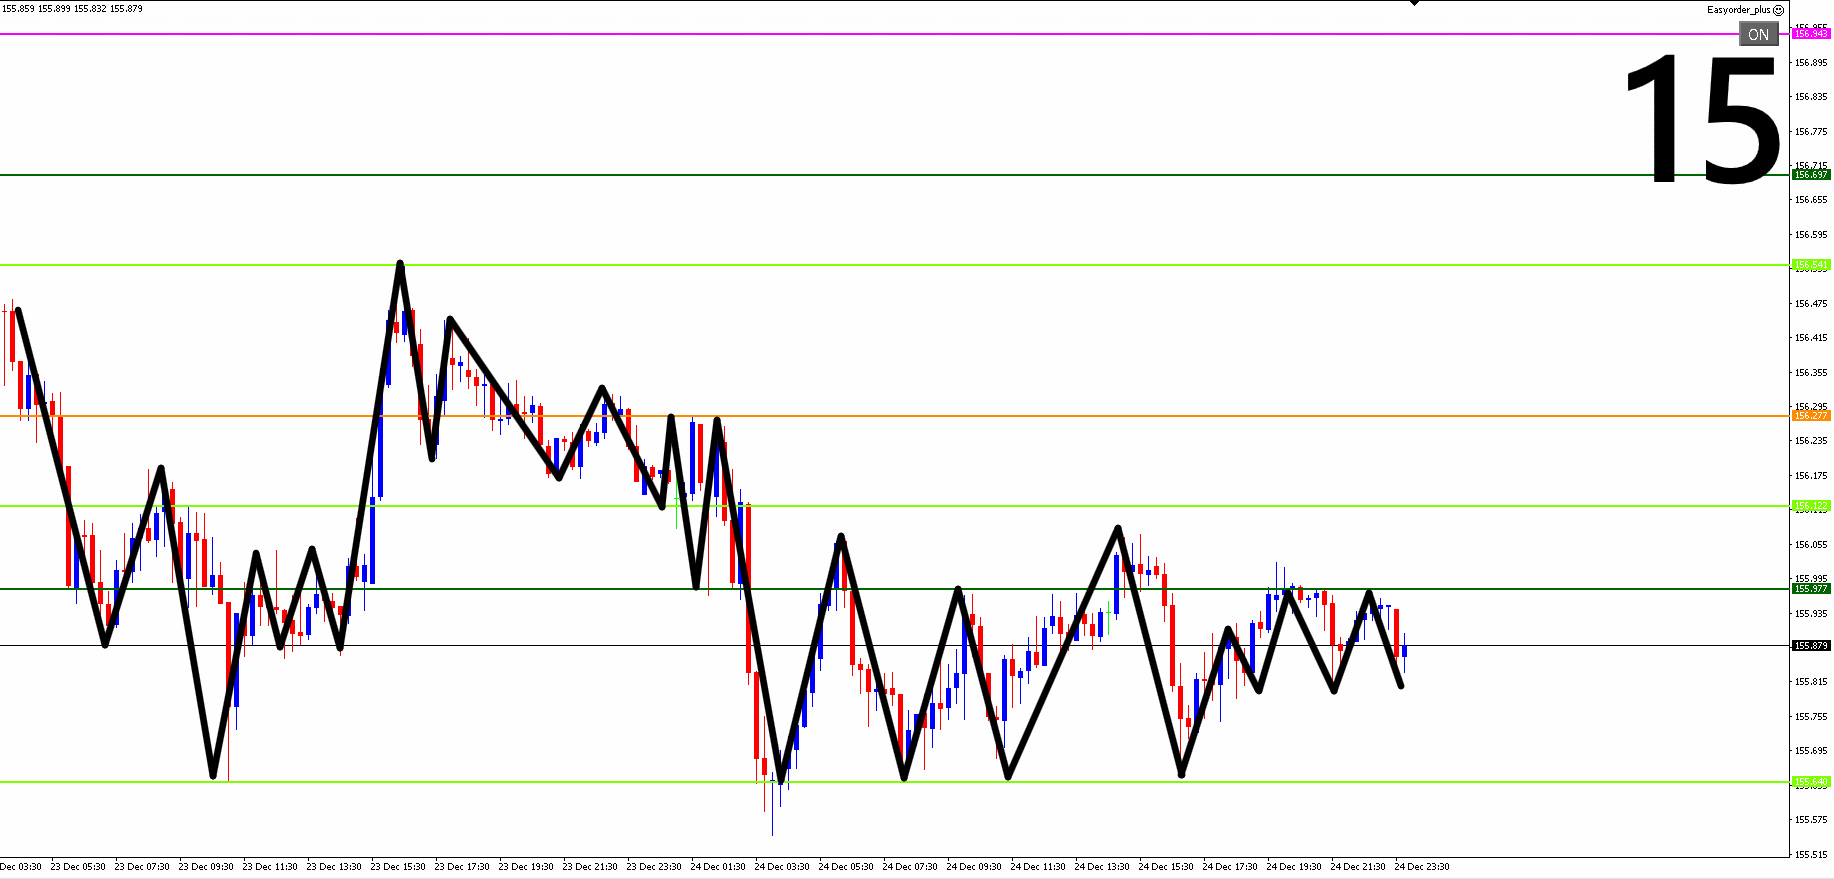
● 15-minute chart: bullish dominance
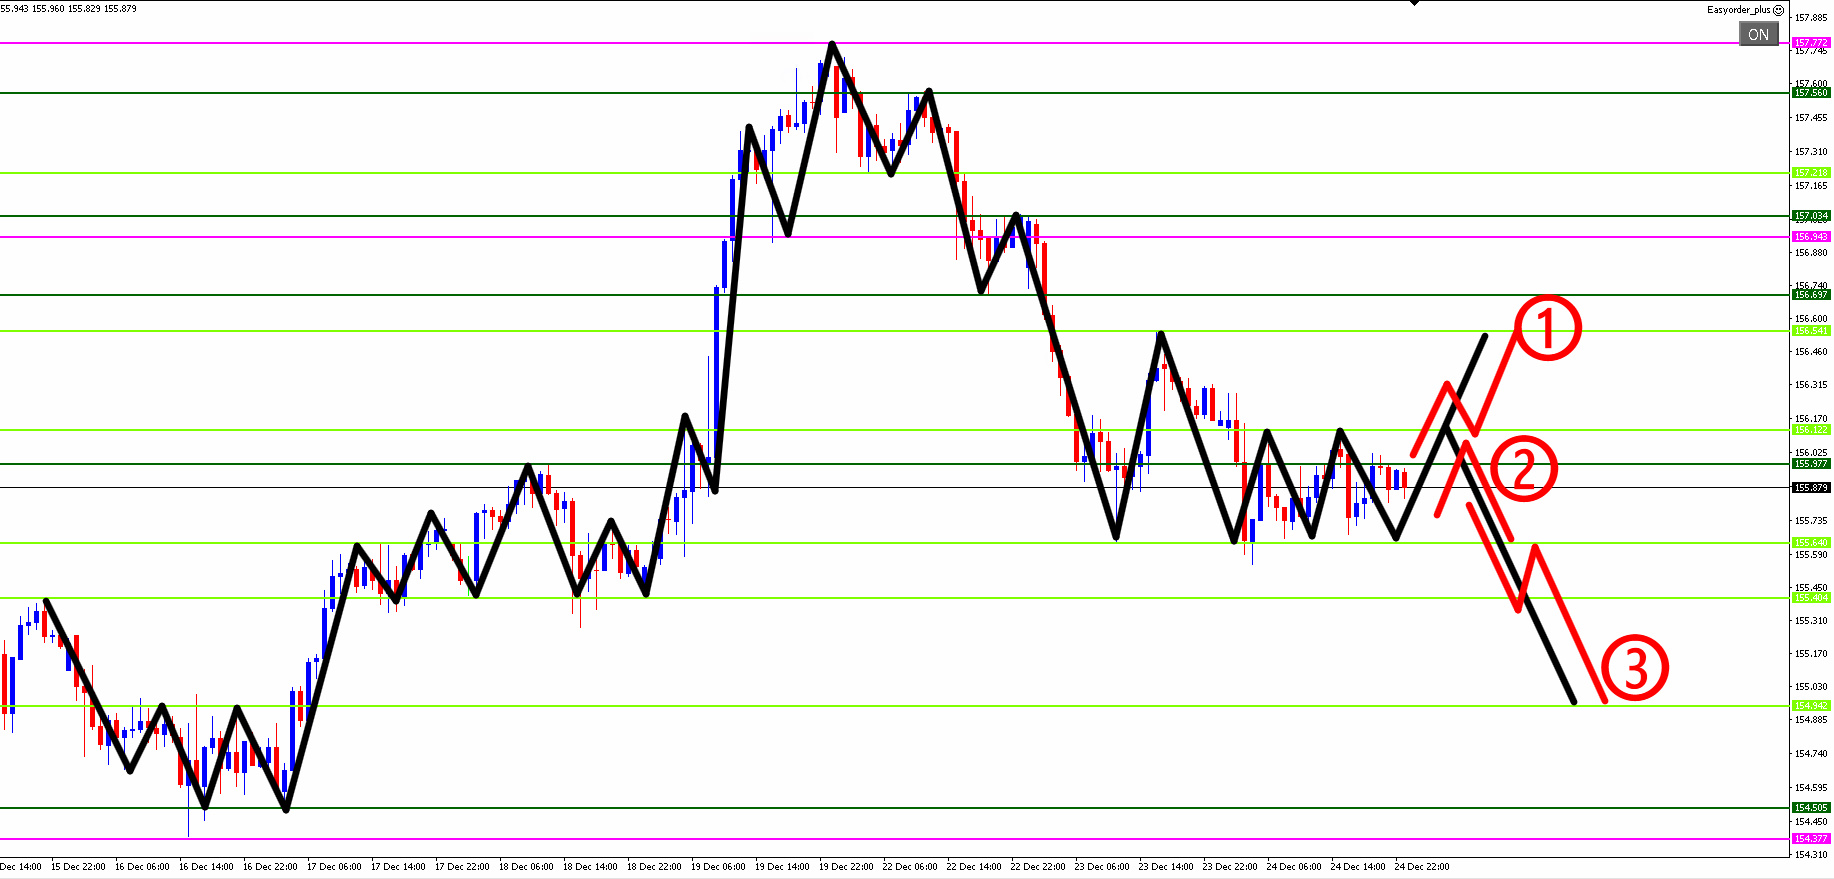
● With no clear directional agreement and trading within a range, this market condition is not suitable for easy buys or sells. On the daily chart, will it rise toward the recent high or fall toward the recent low? On the 4-hour chart, will it rise toward the recent high or fall toward the recent low? On the 1-hour chart, will it fall from the range top or break below the range bottom and fall? Keeping these in mind, in the current situation, aim for sell signals at the range top (red circle ②), pullbacks above the range top (red circle ①), and sell on pullbacks after breaking the range bottom (red circle ③).
《Entry Points are Red Circles ①–③》
【Red Circle ①】 Buy on the pullback after surpassing 156.067 yen.
【Red Circle ②】 Sell if around 156.067 yen holds.
【Red Circle ③】 Sell on a drop below around 155.640 yen and a subsequent rebound.
※ If you would like to know the exact figures for the above ● parts of the latest trade predictions,this can be learned in the community offered exclusively to purchasers of Wave Master FX’s e-book. Occasionally it is made public.
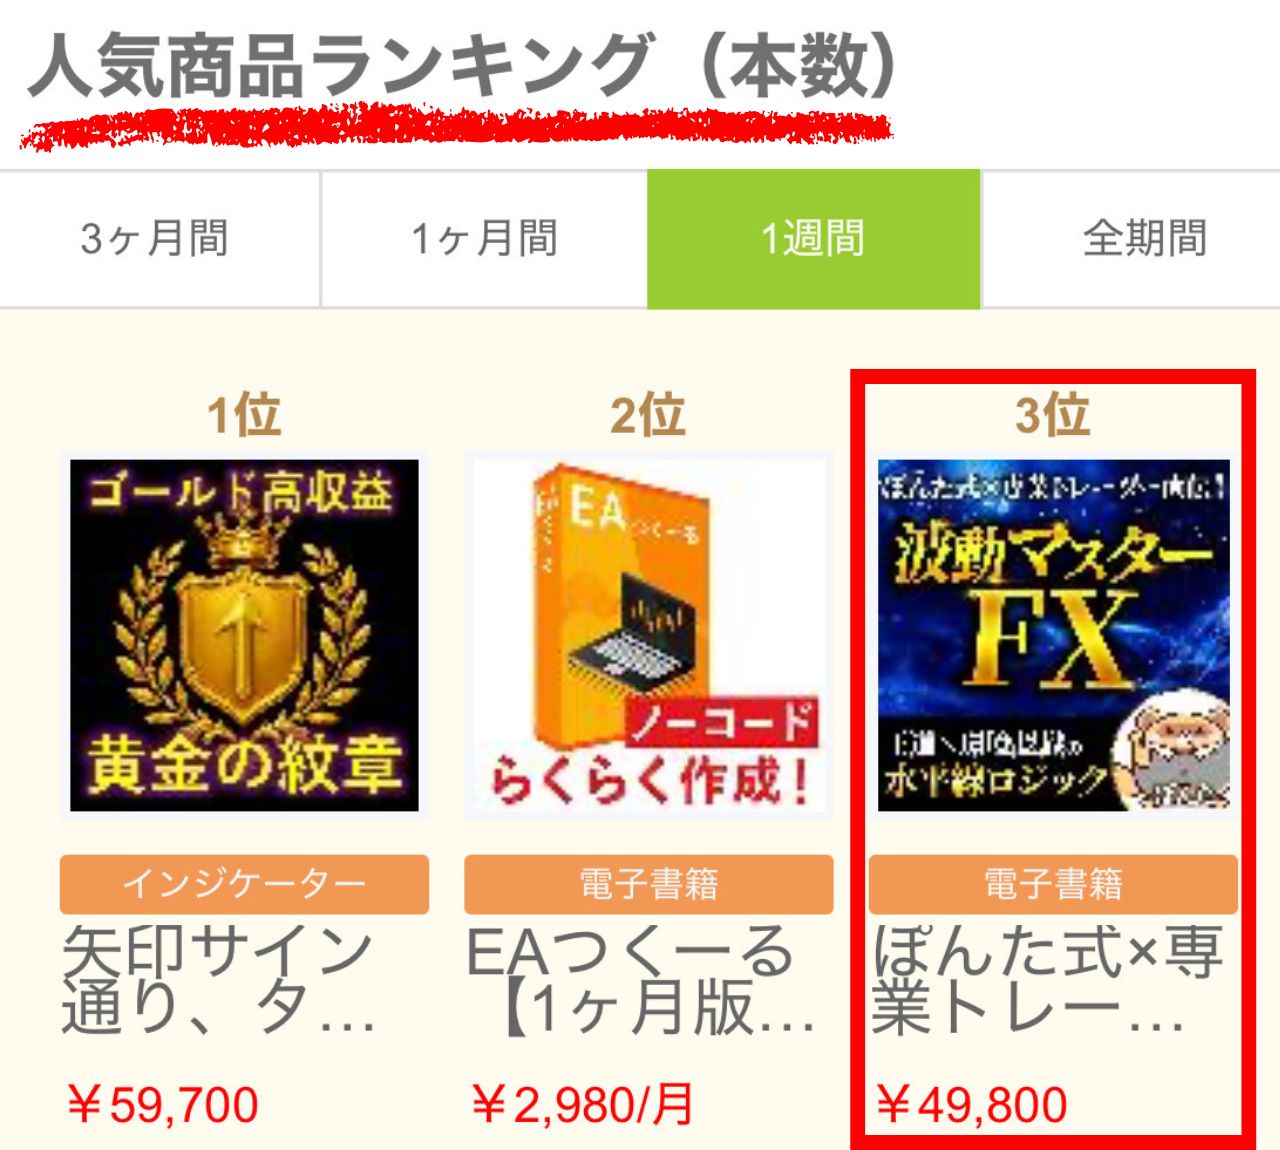
➡https://www.gogojungle.co.jp/tools/ebooks/62200
《About the Latest Trade Predictions》

《About Wave Master》


To prevent everyone from wasting time and money like I did,and to make it accessible to all,‘Incredibly Simple Method’the text【 Wave Master FX 】has been created.


I would be very happy if as many people as possible could win using the e-book I created.
※For details of the material, please check the links at the bottom.
● After 10 years and spending 7 million yen (the amount spent on various products, tools, automated trading systems, etc.), I finally started winning thanks to the “horizontal lines, waves (Dow Theory), and environment recognition” that form the basis ofthe“strongest incredibly simple method that anyone can do and make money from.” .
※This material omits all complex tools, indicators, and systems and leads to the ultimate incredibly simple method.
● Trading style is ‘Day trading’ and ‘Day trading leaning toward scalping’
※It is also usable for swing trading.
● Using horizontal lines and waves (Dow Theory), we perform environment recognition on daily, 4-hour, 1-hour, and 15-minute charts,focusing on high-win-rate entry points three
● Basically, the content is distributed around 10:00 AM each morning.
Currently【2,956 people】are using Wave Master FX’s‘Incredibly Simple Method’ in practice and results areshowing.
‘There’s no way such a good deal exists, is this true’, every FX trader laughedat this.
However,when a trader truly starts to earn...becomes real
▼ ▼ ▼ ▼ ▼ ▼
https://www.gogojungle.co.jp/tools/ebooks/62200