

Let's deepen our knowledge base of the "grounded knowledge" of the indicators in the sky and on the earth! About the zero line and cross of Oscillator DX
Oscillator DX, which is emphasized in the indicators of heaven and earth.
I was not well aware of the 0 line, so I learned it directly from Abusan. (Thank you)
This time
- About the 0 line of Oscillator DX
- Correct understanding of crosses in Oscillator DX
- Precautions at cross times of Oscillator DX
I'll explain in detail!
Oscillator DX 0 Line
The meaning of the oscillator's 0 line is simple, but
- Above the 0 line is overbought
- Below the 0 line is oversold
- If there are two lines above the 0 line, it is overbought
- If there are two lines below the 0 line, it is oversold
That is what it means.
Overbought or oversold are seen with the oscillator, so Oscillator DX is easy to forget, but that is the sense of it.
Correct understanding of crosses in Oscillator DX
The correct understanding of crosses in Oscillator DX is as follows.
It is easy to understand by looking at the image.

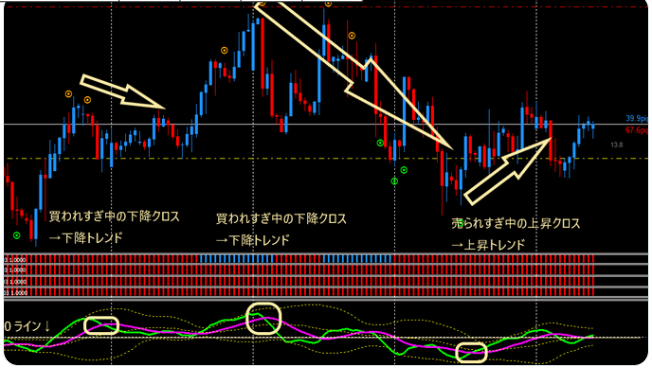
Image: left cross
- A downward cross above the 0 line (overbought) leads to a downward trend
Image: right cross
- An upward cross below the 0 line (oversold) leads to an upward trend
These two crosses arequite likely to cause a trend reversaland become entry triggers.

However, there are two cautions
Precautions at cross times of Oscillator DX
There are two cautions.
- Trend-following cross patterns
- Whether the cross is clean
About trend-following
Uncommon pattern, but
- Downward cross below the 0 line is trend-following
- Upward cross above the 0 line is trend-following
Therefore, you should continue aiming for the trend, but after a trend-following cross
the cross tends to flip back and forth, making reversals likely
so be careful.
Example: EURCHF 4-hour chart
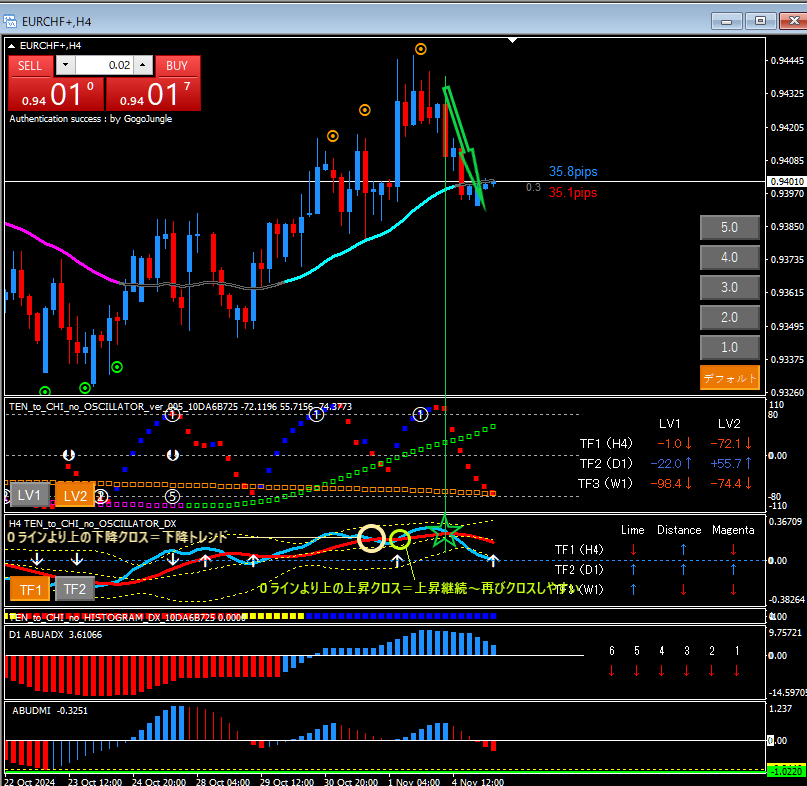
- Cross leads to a downward trend〇
- Cross follows the trend〇
- Cross again to downward trend (large price movement)☆
Whether the cross is clean
Regarding the shape of the cross,
A clean cross
increases the advantage significantly,greatly boosting the edge.
Let's look at actual charts.
Example: USD/JPY 1-hour chart
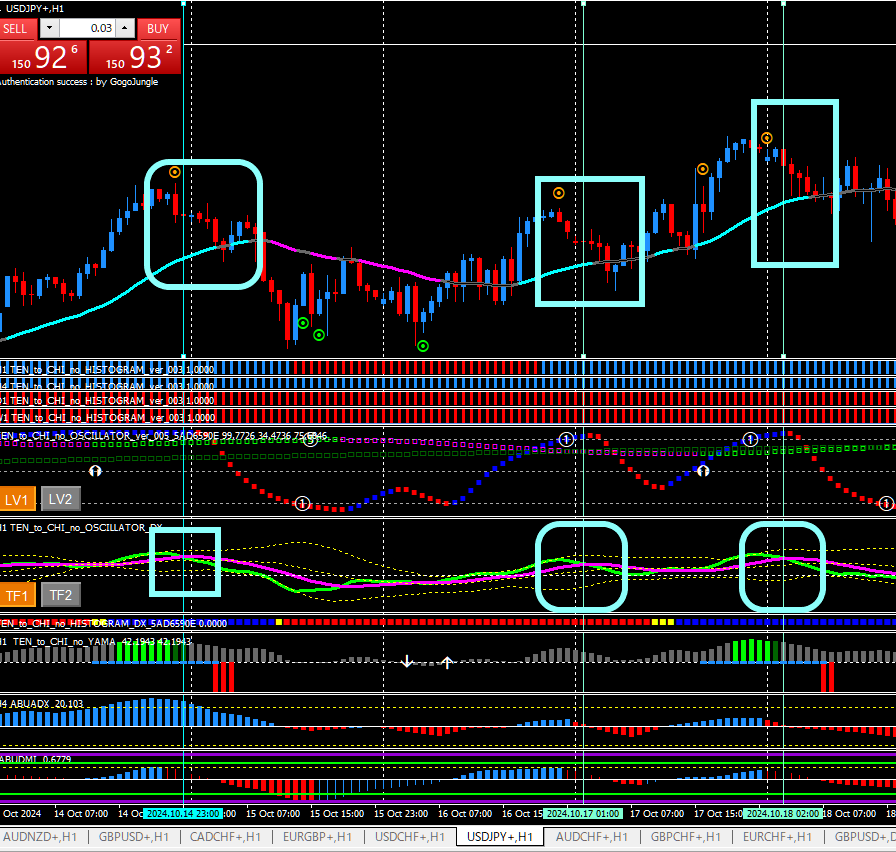
As in the image
Where the cross is clean, the edge is high
Indeed!
If the two lines remain thin or if it is difficult to judge whether the cross is clean, it is also important to skip it.
That concludes the explanation of the 0 line and the cross shapes of Oscillator DX!