

Which indicator between heaven and earth has the strongest sign? Personal ranking 4th place
Hello! I’m Shirou.
The Heaven-and-Earth Indicator is an indicator meant to discern Heaven and Earth.
- Oscillator
- Histogram
and when combined with various other indicators to enter and aim for price movement.

Among the Heaven-and-Earth Indicators, which one is the strongest basis…?
Isn’t that on your mind?
In this article, after finishing the verification, I’ll present a personal ranking of which Heaven-and-Earth Indicator has the strongest basis.
I will present it in a ranking format.
This is my personal view, please understand.
【Personal View】Ranking of Heaven-and-Earth Indicators with the Strongest Basis

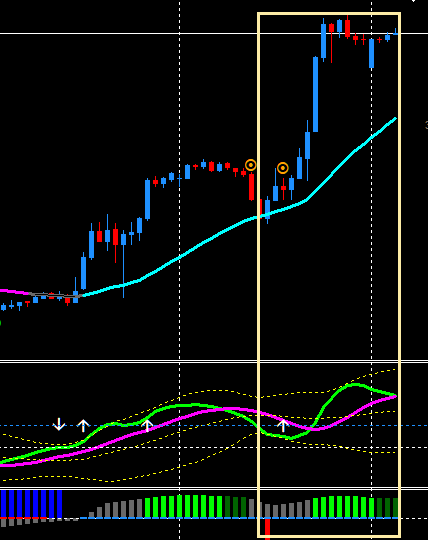
1st place: Oscillator DX
First, the first place is Oscillator DX.

I think Heaven-and-Earth Indicator users will be convinced as well.
When Oscillator DX makes a clean cross,
it becomes a strong entry trigger
.
AUDCAD 1-hour chart
- Crossing up below the 0 line (image on the right)
- Crossing down above the 0 line (image on the left)
and it’s advantageous because you can target a trend reversal and it can be used on any timeframe.
Furthermore,
FUTURE GCDC SIGN of DX
was implemented, increasing the reliability of Oscillator DX even more than before.
2nd place: Oscillator
The personal ranking for second place is Oscillator.
(As Abe says) the strongest indicator in terms of environment recognition
- TF1 trend-following in TF2
- All-direction signals
are visually clear and very handy.
USDJPY 4-hour chart
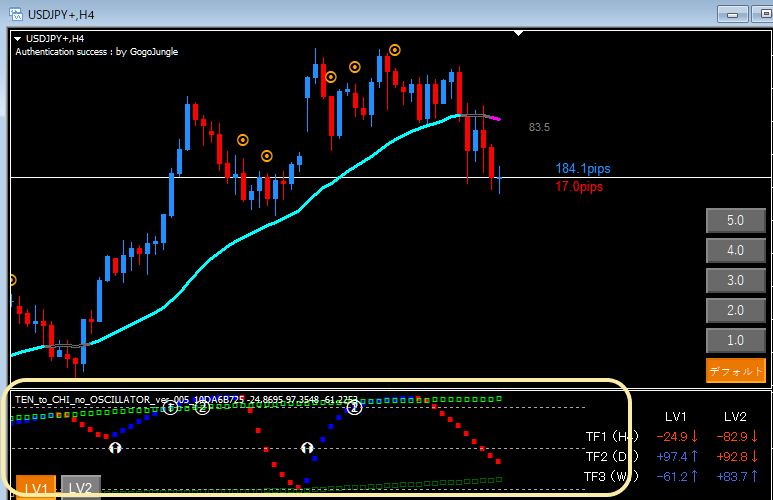
Additionally,
the signals ⑤① and ⑥① on the 15-minute and 1-hour charts are strong
.
It’s a very good indicator, but in reality I’m not fully used to it yet.
Due to lack of power,
I haven’t fully input the method to deal with Oscillator top/bottom sticking together, and it takes time to grasp the chart.
If I can overcome the sticking, it will be even easier to use.
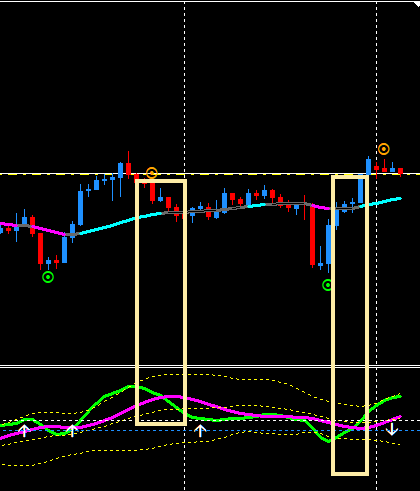
3rd place: Line
Three is the Heaven-and-Earth Line.
The Heaven-and-Earth Line is mainly used for
- whether you can enter
- reversals
.
Regarding whether you can enter,
I proactively avoid entering in the direction of the trend from far away from the line as much as possible.
If you enter in the direction of the trend far from the line, the price range you can capture is limited.
② Reversing is, as described in the manual,
the reverse from line entry to targeted profit-taking
is easy to aim for, which I like.
EURCHF 1-hour chart
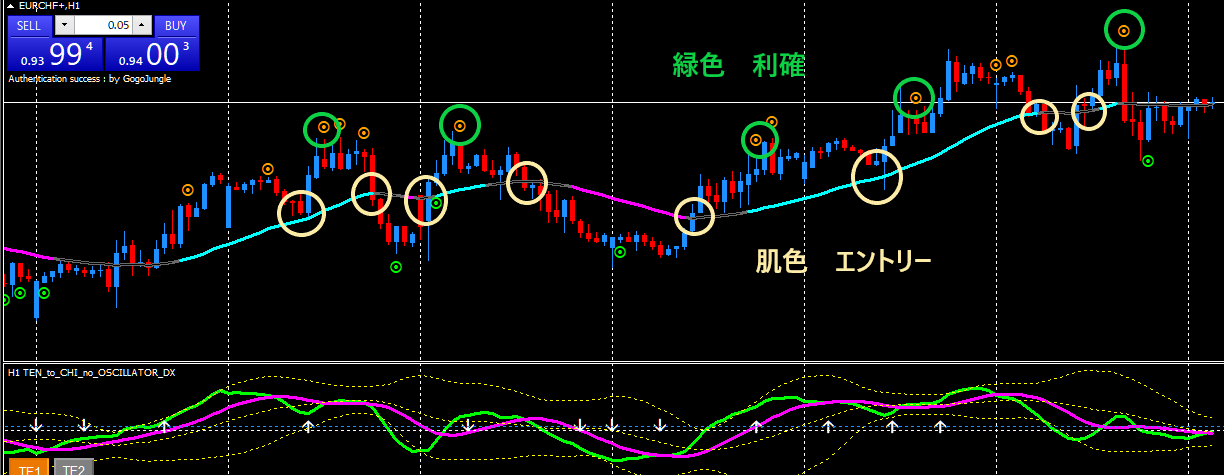
For reverses,
the win rate is good and visually easy to understand
so I use it often.
Furthermore,
Heaven-and-Earth Mountain Trend Detectorallows you to target reverses during the uptrend
which is another advantage.
EURGBP 1-hour chart
In the trend detector, it captures the trend of the higher time frame.
In other words,you can catch an even stronger trend within the trendso
even people who are weak in environment recognition
can press forward.
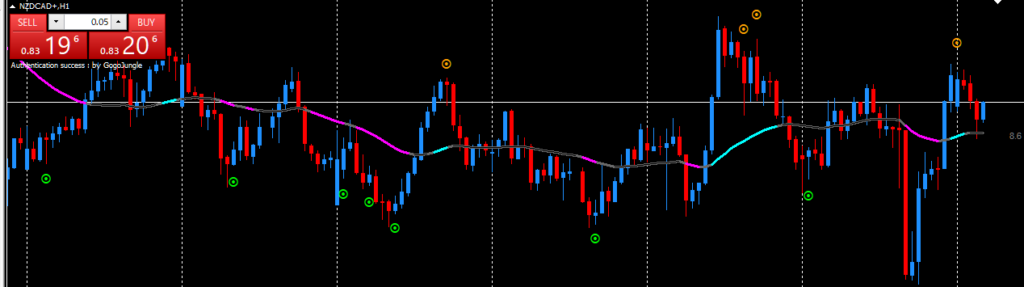
4th place: Dot Signals
I’m surprised myself that dot signals rank fourth.
Dot signals are an indicator that captures tops and bottoms and helps with take-profit and stop-loss benchmarks.
They are usable on all timeframes.
NZDCAD 1-hour chart
Default is LV2, but setting from 1 to 5 is a good point, too.
So far
- 1-minute LV1 averaging
- 15-minute LV4 trades
- 1-hour LV4 averaging
and so on I’ve tried,but there are false signals too.
That’s why
the Oscillator and Histogram are set up
since dot signals trades take time to get used to for me personally.
Of course I use them as a basis for entry as well, but more often I use them for take-profit or stop-loss benchmarks.
Summary

To summarize this article as follows.
The strongest basis is
- Oscillator DX cross
- Oscillator DX FUTURE GCDC SIGN of DX signals
Indeed.
These two are especiallyexcellent as entry triggersI feel.
The benchmarks for take-profit and stop-loss are of course lines and dots.
That’s all for the personal ranking of Heaven-and-Earth Indicator bases and advantages!
If you have something you think has a higher advantage, please feel free to comment.