

Are celestial and earthly indicators really just left to the indicator? Introducing the six basic FX options I use
Hello! I'm Shirō (Shirou).
The Heaven and Earth indicators are
known as a tool so powerful that you can rely on indicators
to the extent that you can use them for trading.
It's also true that many people are earning pips from posts on Xas well.

If the basis from the indicator is correct, is that enough to actually enter?

I’d like to know what you pay attention to when using indicators!
And for those wondering, I, a Heaven and Earth Indicator user, will
- introduce the basics of FX when using Heaven and Earth indicators
- things to be careful about when trading with Heaven and Earth indicators
!
In short,
as long as the basis of Heaven and Earth indicators matches the instruction manual, entering is OK
.
The basics of FX are
- before entry
- adjusting TP/SL after entry
are frequently used.
Six FX basics when using Heaven and Earth indicators
The six basics for FX using Heaven and Earth indicators are as follows.
- Resistance and support lines
- Chart patterns
- Round numbers
- Price action
- Dow Theory
- Economic indicators
Before entry, look at economic indicators; after entry, check 1–5.
The pattern is often to
delve into each one step by step.
① Resistance and support lines
That is, resistance lines (resistance) and support lines (support).
After looking at Heaven and Earth indicators, I glance at support/resistance lines, and for example
if there is a strong support line just below, I briefly hold off on shorting
as a precaution.
EUR/AUD 1-hour chart
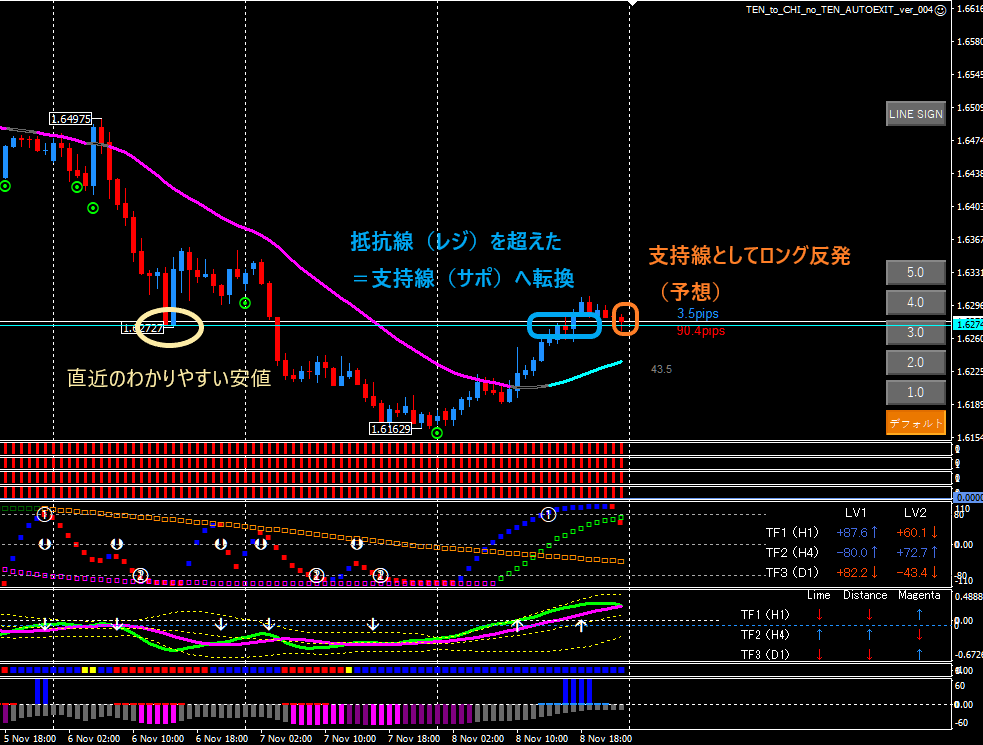
In this chart, the candlesticks point to a long (buy) bias.
- Draw lines at obvious recentlows and highs.
- Since the price has broken above resistance, I think a support linewill become a support
- I expect a long when it becomes support.
However, with Heaven and Earth indicators,
the oscillator DX shows a clean downward cross,
which means we’re aiming for a short position.If the candlesticks are long but the Heaven and Earth indicators indicate a short setup
Candlesticks indicate long,butthe Heaven and Earth indicators indicate short; in that case, I’ll refrain temporarily
as a precaution.Alternatively, I’ll
- short if the oscillator DX crosses
- short if the candlesticks close below the support line
for example.
② Chart patterns
Knowing basic chart patterns helps with Heaven and Earth indicator entries (in my experience).
- Trend lines
- Double tops and double bottoms
- Head and shouldersalso known as the three famousalso known as the three famous
- Triangle patterns(symmetrical, ascending, descending)
- Flag
I’ll show actual chart examples of triangle patterns.
Friday, November 8, 2024, AUDCHF 1-hour
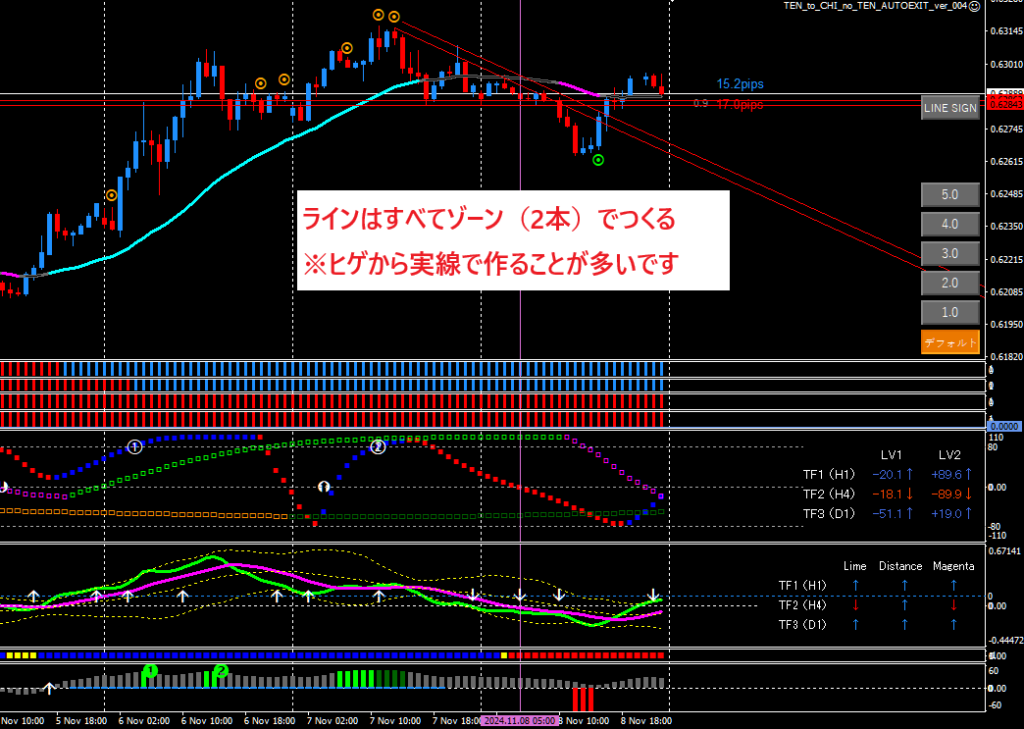
A triangle pattern formed by wicks and a solid line zone.
The purple vertical line uses a method based on FUTURE GCDC SIGN of DX, where FUTURE GCDC signal appeared.
- The end of the triangle (this pattern often goes down)
- Signal is aiming for a short (downward cross in the same direction)
I interpreted as short,but I always properly break through the zone before shorting just in case.
Confirmed with a solid close below the fifth purple vertical line, I shorted and then took profit at the next point.
One more to look at.
Flag pattern.
GBPCHF 1-hour
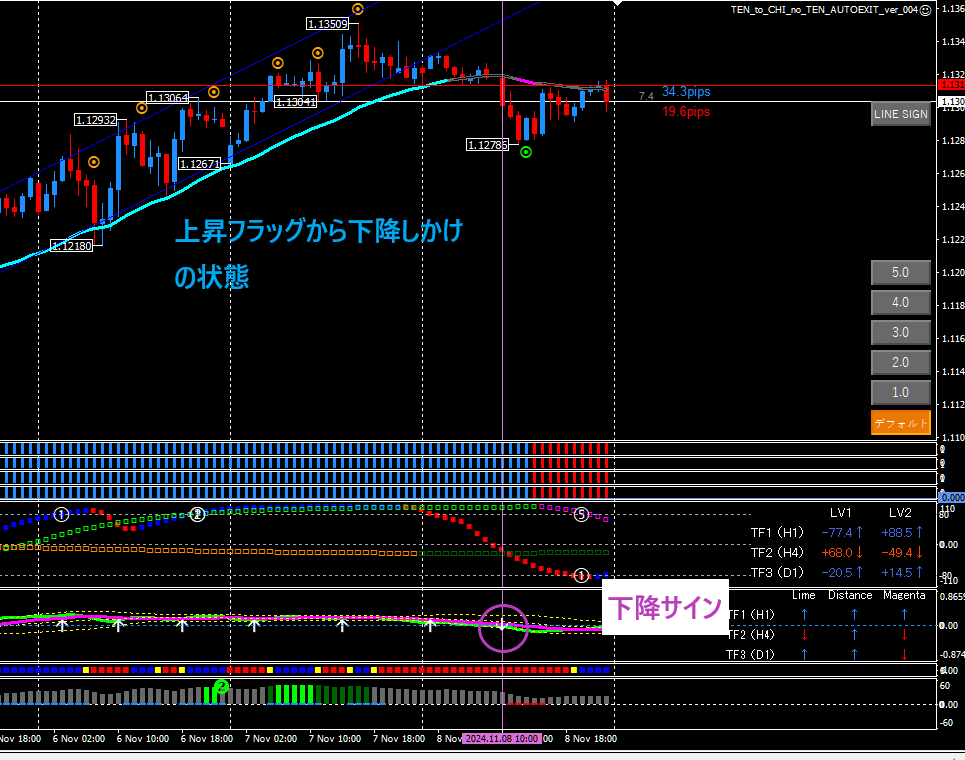
Purple vertical lineis the FUTURE GCDC signal of oscillator DX.
Looking at the chart,
it had broken out of an ascending flag and was about to head down
.
Some see the top as three peaks or a double top, or as the previous triangle pattern.
I saw it as three peaks and drew a line at the most recent neck line (red line).
I’ll review the chart to be sure.
Then,it was also near the red resistance line at the most recent high..

In other words,
- Break above the red resistance line at the most recent high, then break below with a solid line to head down
- Reject the flag and break below the neck line with a solid line
These two form the basis for a candlestick short.With Heaven and Earth indicators, considering FUTURE GCDC signals and other basis as well,
the setup favored a short, so I shorted.
③ Round numbers
Next, round numbers.
Unlike resistance/support lines or chart patterns, the concept is super simple.
For example,even with a strong short signal from Heaven and Earth indicators,,
should I short around 100.30?
100.00 is a highly watched round number, so a rebound is to be expected.
AUDJPY 1-hour
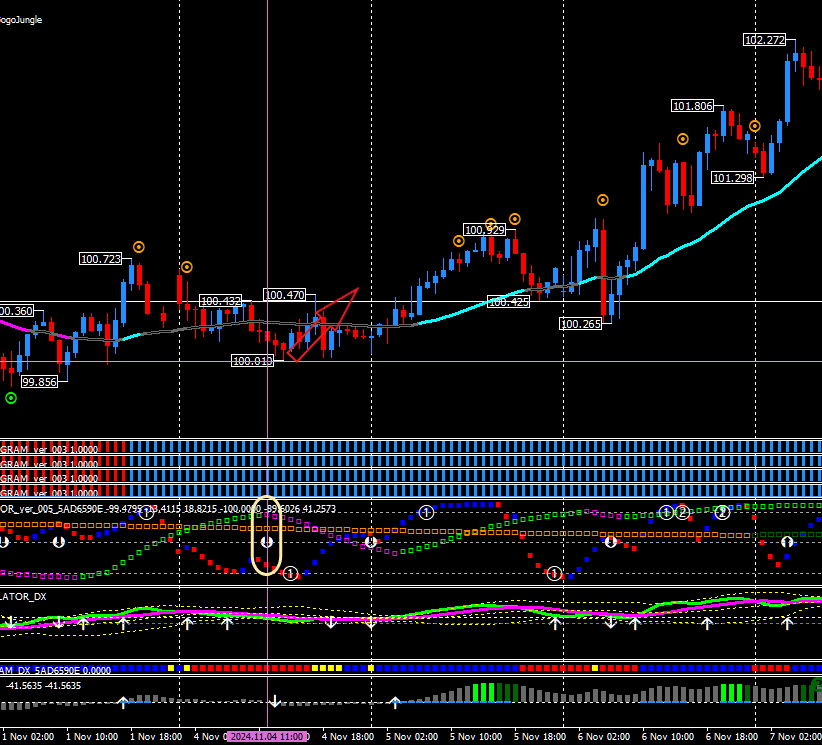
For example in AUDJPY 1H,there was downward directional signal from the oscillator around 100.30in all directions.

I made a mistake here
I aimed for a take-profit from the line to the dot, but…
However, it rebounded at 100.01 and rose. As expected, I stopped out.
If the basis from Heaven and Earth indicators is weak, you should especially be mindful of round numbers
Even if there are signs from Heaven and Earth indicators,
I would short only after clearly breaking below 99.99 with a solid line and confirming it has become a resistance
by decoding with care.
④ Price action
Price action
is a composite meaning of various methods
but hererefers to candlestick price movement.
Price action I watch (candlestick moves) includes
- When wicks are many, bear market; when wicks are few, bull market
- If wicks push below support/resistance and return, it could break again
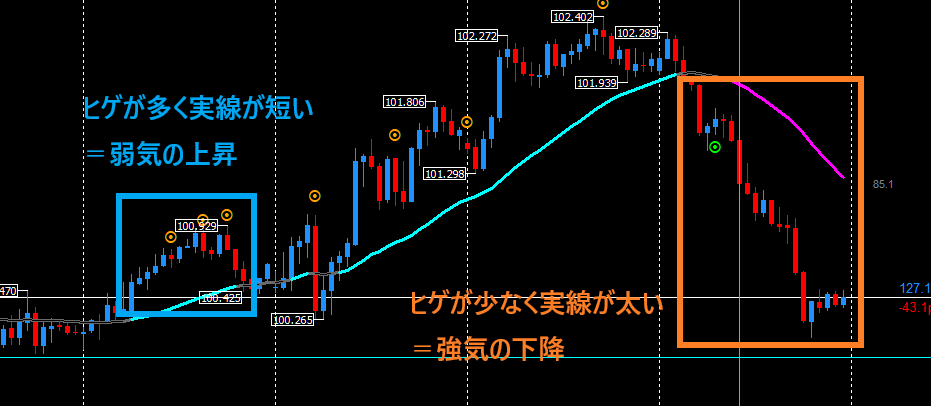
In bearish markets it tends to range, while in strong markets it trends, so I watch closely.
If bullish, I place a take-profit EA (points or lines); if bearish, I set profit at around 10–20 pips
⑤ Dow Theory
Next, Dow Theory.
It’s especially useful to remember
when Heaven and Earth indicators reverse a line
to enter with the trend after a line attack near the indicator.
With Heaven and Earth indicators, entering with the trend toward TF2 near a line is done after situational awareness.
If you go toward TF2 trend without situational awareness, see the article that tests two months with only TF2 trend following.
If Dow Theory is negated, I don’t enter
That’s it
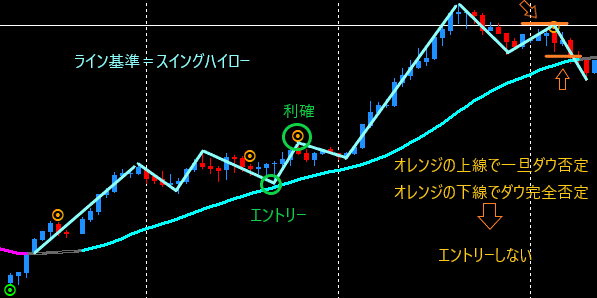
Decide the line using swing high-low (the highest and lowest within around six candles) and draw the line.
Prices updating highs/lows is Dow Theory
but the orange upper line did not update the highs.
So I stop considering a long here.
If you stay quiet and the orange lower line appears and you still hold a position,
- set a stop or close back to break-even
.
If price goes below the line, I briefly consider shorting again
.⑥ Economic indicators
Lastly, economic indicators.
What I often look at is whether it is already priced in
.
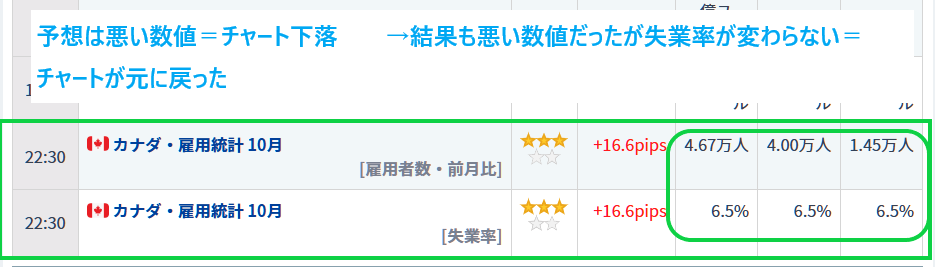
Economic indicator — Friday, November 8, 2024 — Canada’s employment data
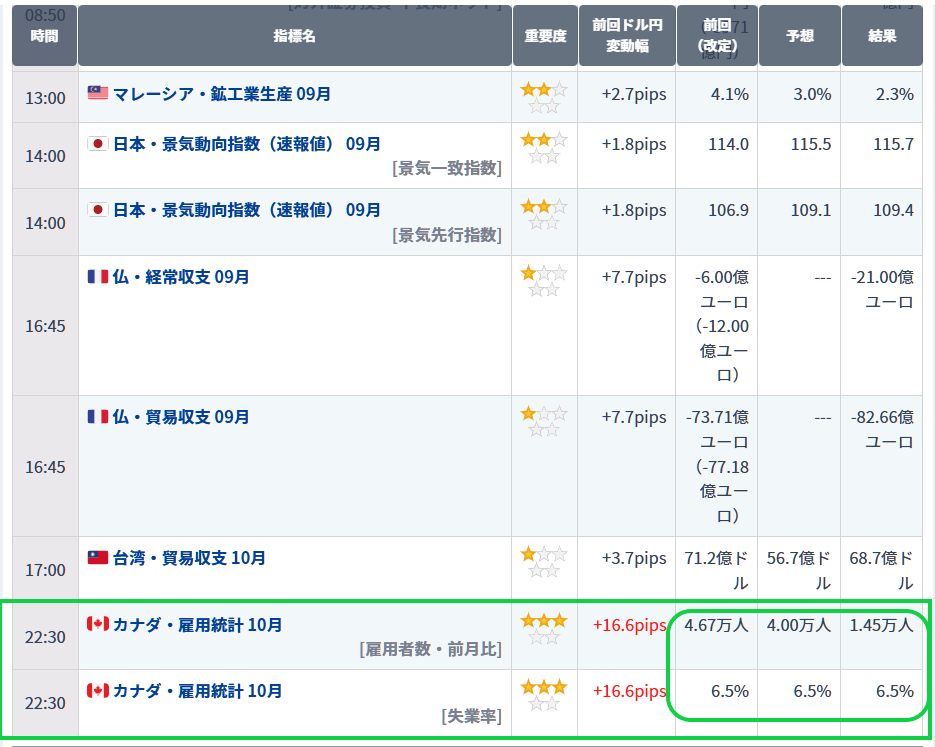
For CADCHF on 1-hour, I entered before the data release, around midday
With economic indicators, the CAD employment data being worse than expected had already been reflected in the chart (purple vertical line).
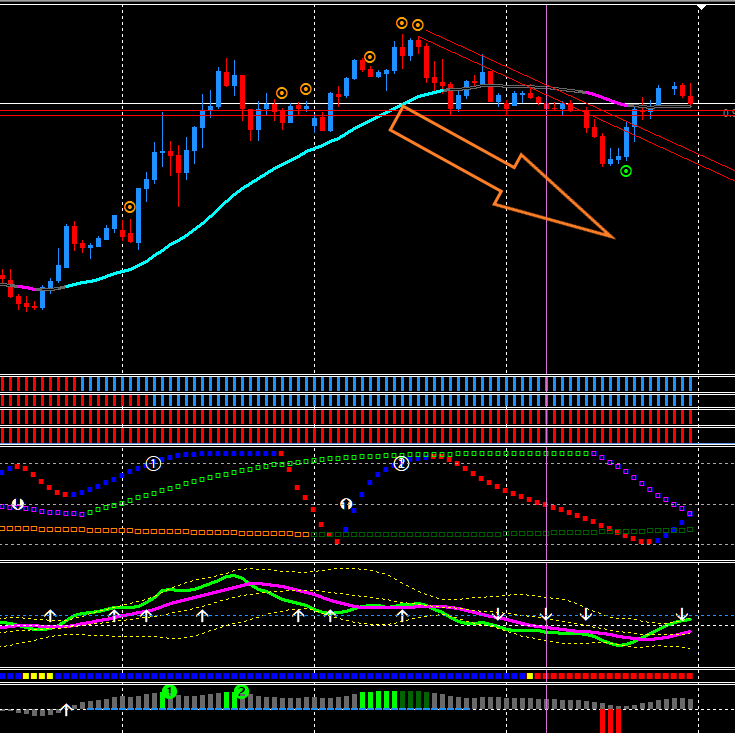
A worse-than-expected economic indicator pushes the chart down.
Possible reasons include:
- Triangle chart pattern (short)
- Heaven and Earth indicator FUTURE signal (short)
- Economic indicator expectations were bad (CAD selling off)
With these bases, I could short quite boldly.
That day after the data release, the chart rose back to original
since the unemployment rate didn’t change, it’s reasonable the chart returned to the previous level.
Summary

Above are the six FX basics I commonly use with Heaven and Earth indicators.
Among them,
- resistance and support lines
- chart patterns
- round numbers
- Dow Theory (only at reversals)
- economic indicators
are easy to check.
This is my method
Before entry I look at economic indicators, after entry I typically examine ①–④ to adjust targets and stops
When Heaven and Earth indicators' basis matches the instruction manual exactly,I enter without hesitation.Heaven and Earth indicators have higher win rates when the basis matches,
(with data to back it). So trading solely with Heaven and Earth indicators is completely viable.
This is my approach, and I hope it helps other users as a reference.
Please feel free to leave a comment as well!