

Do you look at economic indicators with the indicators of heaven and earth? Introduction to actual viewing and usage
Good morning! This is Shirou.
The Heaven and Earth indicators are
points where entries can be identified with various indicators and signs
however,

Do the Heaven and Earth indicators also look at economic indicators?

I want to know what fundamentals actual users of the Heaven and Earth indicators are using!
For those who are curious, in this articleI will share the
ways to view economic indicators
that I personally use with the Heaven and Earth indicators
Do the Heaven and Earth indicators view economic indicators?

As per the manual, the Heaven and Earth indicators do consider economic indicators!
According to the manual,
you should enter after avoiding the economic indicator times
to enter.
I
check whether the economic indicators are priced in
and whether the results are reflected
to monitor.
U.S. economic indicators tend to move the market, so the standard practice is to avoid the 1-hour before and after about ☆4 to ☆5, and I use the same method.
【Addendum】An example based on my rules
Addendum
Until recently I watched ☆3 or higher, but now I watch ☆4 or higher as my rule.
In the current 15-minute chart trading (all timeframes apply) I stop according to the following rules.
| Min-ru Indicator Rank | Trading Response | Stop Period |
|---|---|---|
| ★★★★★ | Fully stop 1 hour before and after releases | NFP, FOMC, BOJ rate decisions, etc. |
| ★★★★ | Stop 30 minutes before/after releases | CPI of each country, unemployment stats of each country, etc. |
| ★★★ or below | May not stop depending on the situation | Indicator impact deemed minor |
Also, if after 18:00 you cannot see the chart,
when indicators are ☆4–☆5 between 21:00 and 22:00, I skip the corresponding currency just in case
to avoid risk.
Which sites do you look at?
In my case, I view economic indicators on
site.

If you bookmark the links above, you can see that day's economic indicators.
I also look at key speeches (Minkabu) and forex news (Minkabu).
- Do you not look at other sites?
If Minkabu’s indicators, key news, and forex news do not clarify, I may check other sites as well. I might glance at ZAI or a sheep-herder (Yahiro) type sources, butit is generally better to choose one company’s site to rely onas a rule of thumb.
How Heaven and Earth Indicator users view economic indicators

So how I actually use them is very simple.
Primarily, of course,
secure profits or cut losses before the economic indicators are released
in other words,entering while avoiding the economic indicatorsis the approach.
Even if the forecast is out and priced in, once the release comes, momentum may halt and the market may move in the opposite direction—a common pattern
For me, when the economic indicator level is☆3 or lower,
I assess whether the forecast might go up or down
and decide whether to enter accordingly.
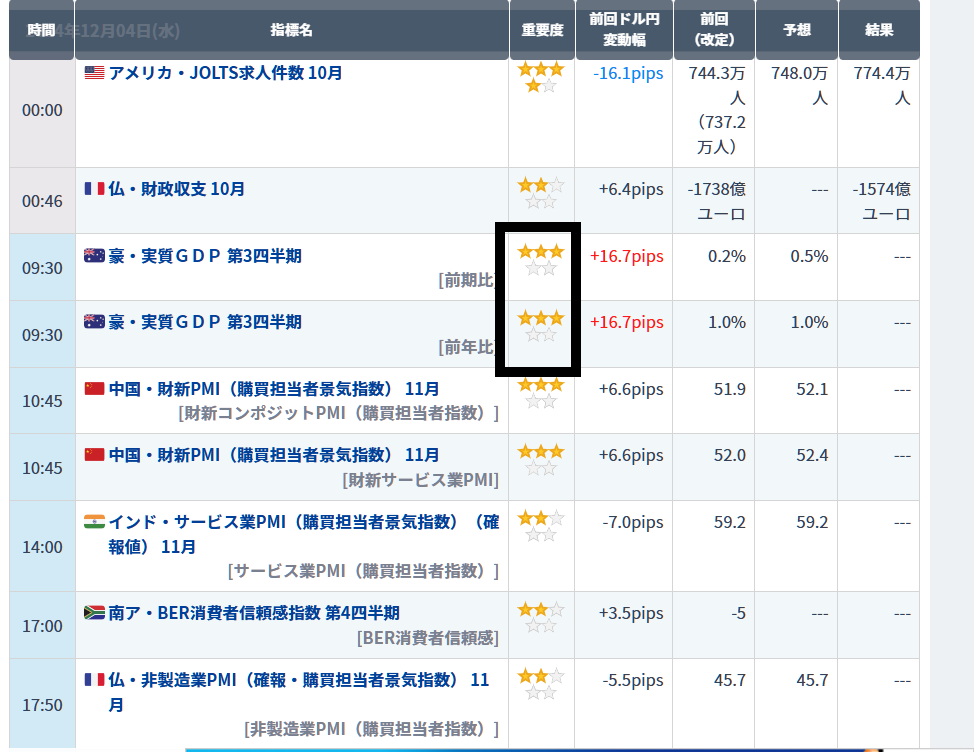
Looking at economic indicators, AUD (Australian dollar) seems tobe better than the forecastcompared to the previous value,so I judge that AUD will riseas a result.
| Forecast better than previous value | AUD is bought |
| Forecast worse than previous value | AUD is sold |
In other words, even if the market tends to short,
if I determine that AUD will rise because the forecast is better than the previous value, I do not take a short position
and proceed with the entry accordingly.
Ultimately, I aim to secure profits or cut losses before the release as much as possible, or enter after reviewing the results.
Economic indicators can be generated with ChatGPT files

Finally, I’m not sure how useful this is, but
I’ll show how to create economic indicator CSV files with the paid version of ChatGPT
for this purpose.
It’s a paid version, but
ChatGPT analyzes economic indicators andevaluates the directional forecasts from the results
to help you understand the trend.
If the results are not yet ready, it will infer the direction from the expectations
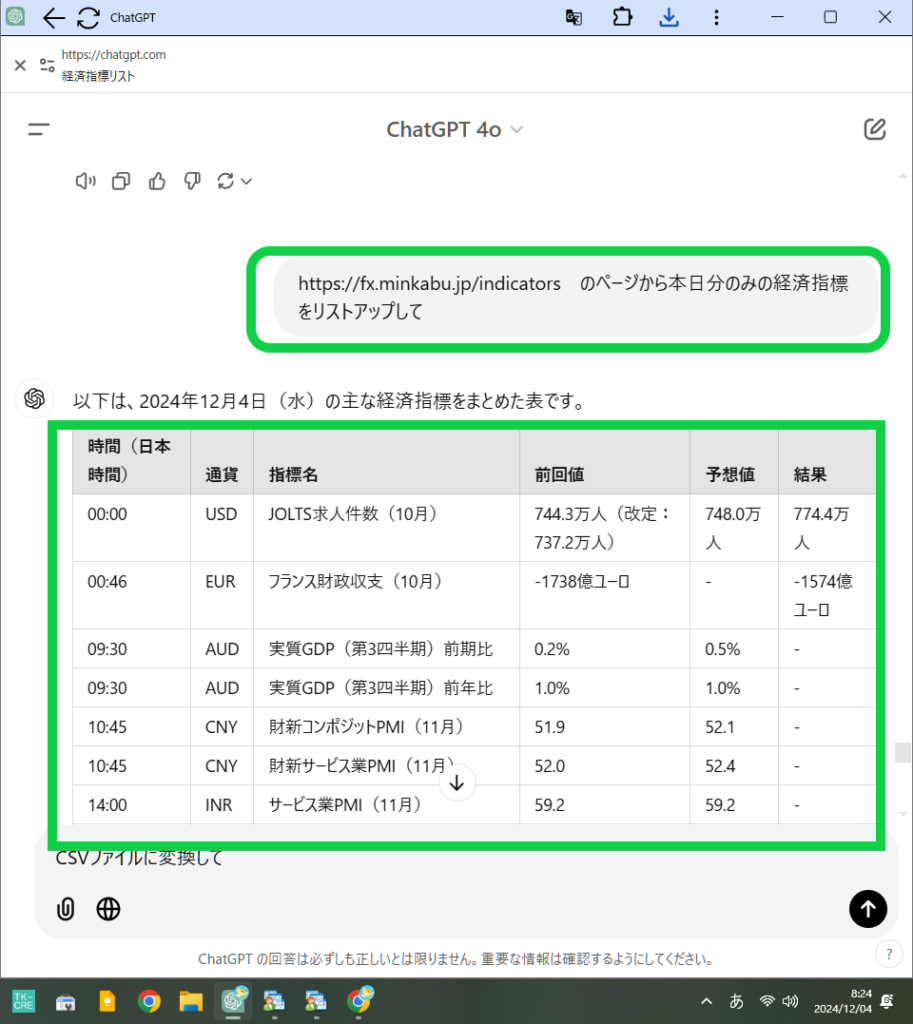
Tell ChatGPT to pull the economic indicators from the page link.
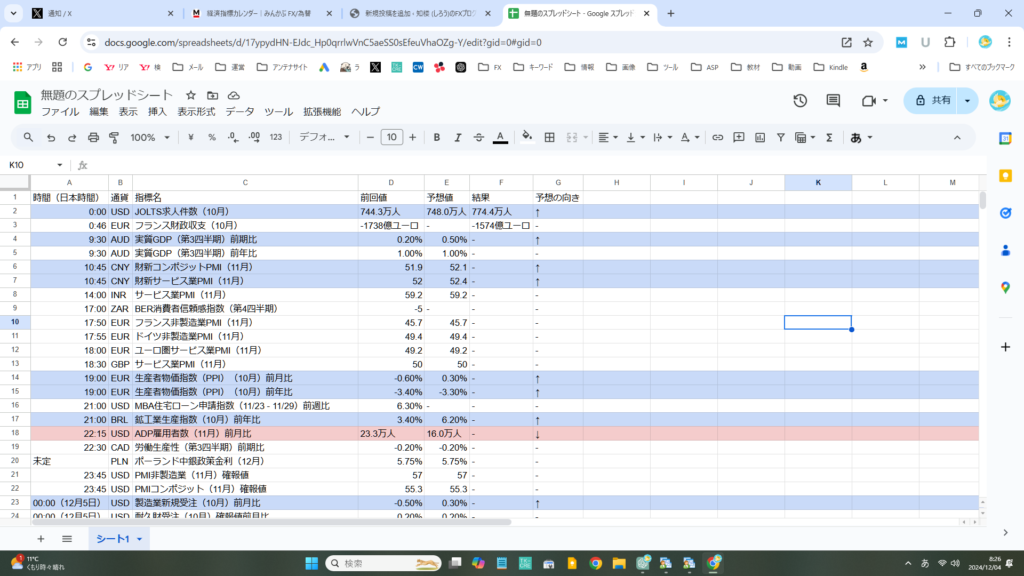
From the page https://fx.minkabu.jp/indicators, list today’s economic indicators only
Compare with the actual indicators from the image above (time, currency, values) and add instructions.
Having currencies makes it easier to view in Excel
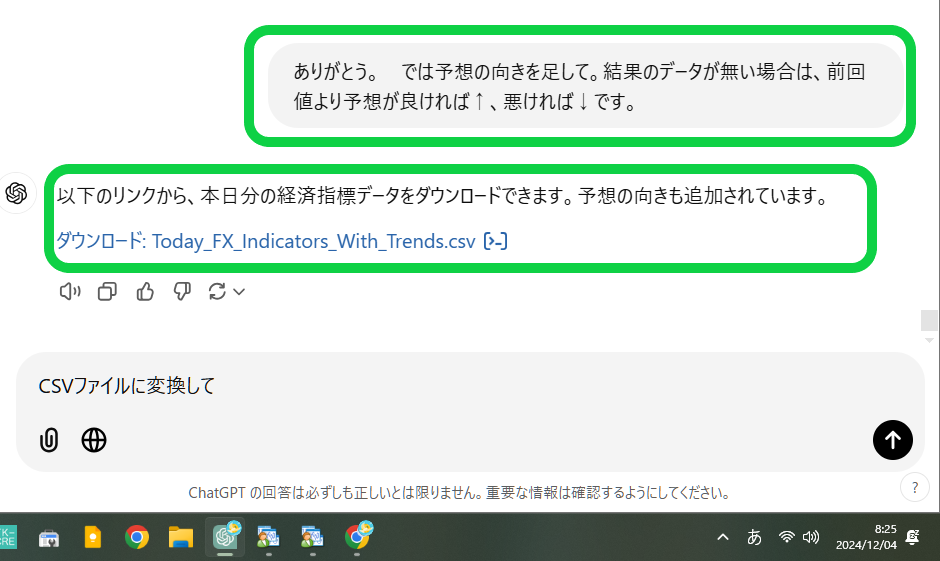
Add the direction of the forecast. If there is no data for the results, use previous value; if better than previous, up arrow; if worse, down arrow.
Import the CSV file into Google Sheets.
Choose File → Import
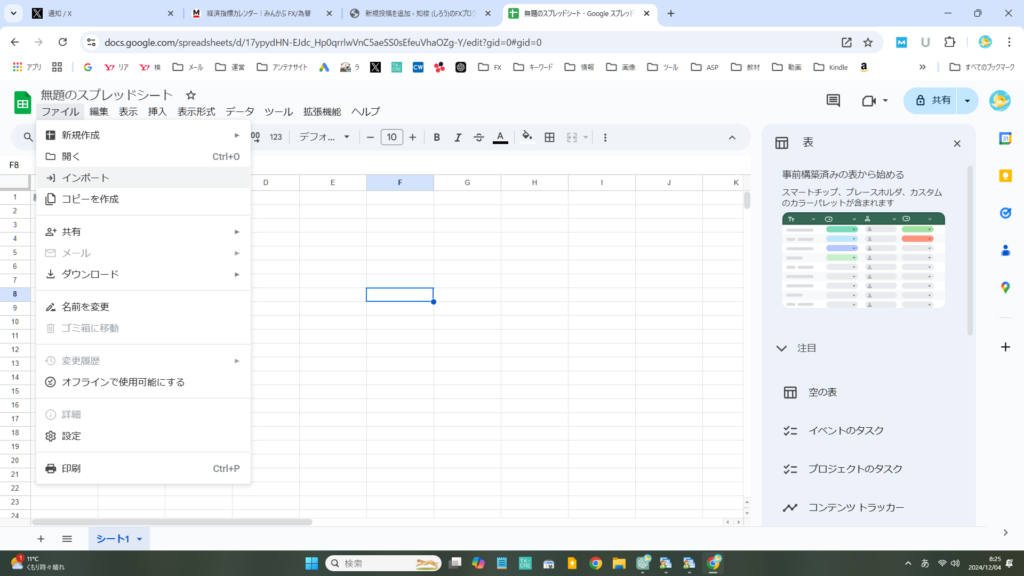
Drag the CSV file into the import area

Choose “Add to current sheet”
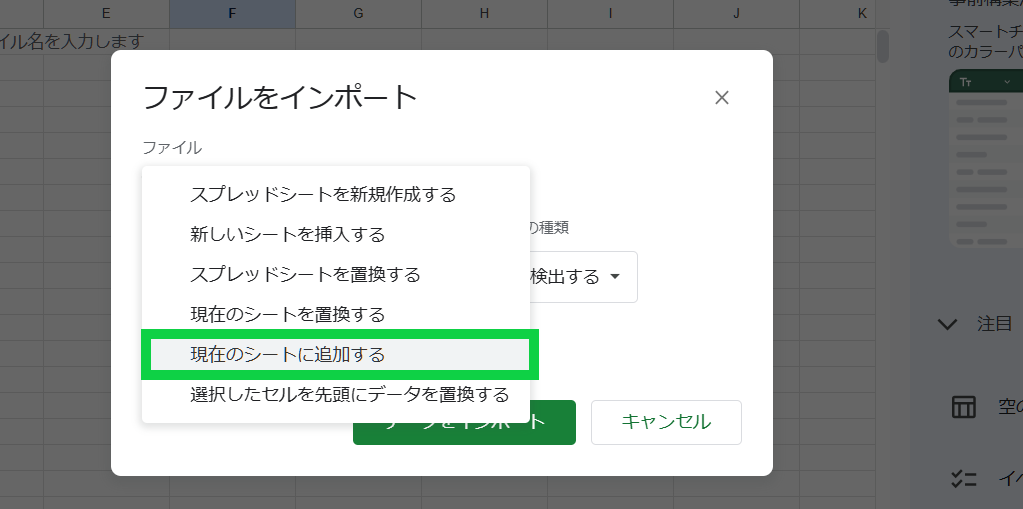
Done.
Visually, give a blue background to the up direction and a red background to the down direction for easy understanding.