

Explain the histogram of the天と地のインジケーターのヒストグラム(DX・DX2含む)について解説
Hello!
This is Shirakiyaku.
This time, one of the indicators included in the Heaven and Earth indicators
Heaven and Earth Histogram
I will introduce it because it’s not entirely clear even for me, though this is also for my own understanding!
Furthermore,Histogram DX and Histogram DX2will also be explained.
What is Heaven and Earth Histogram

First, form
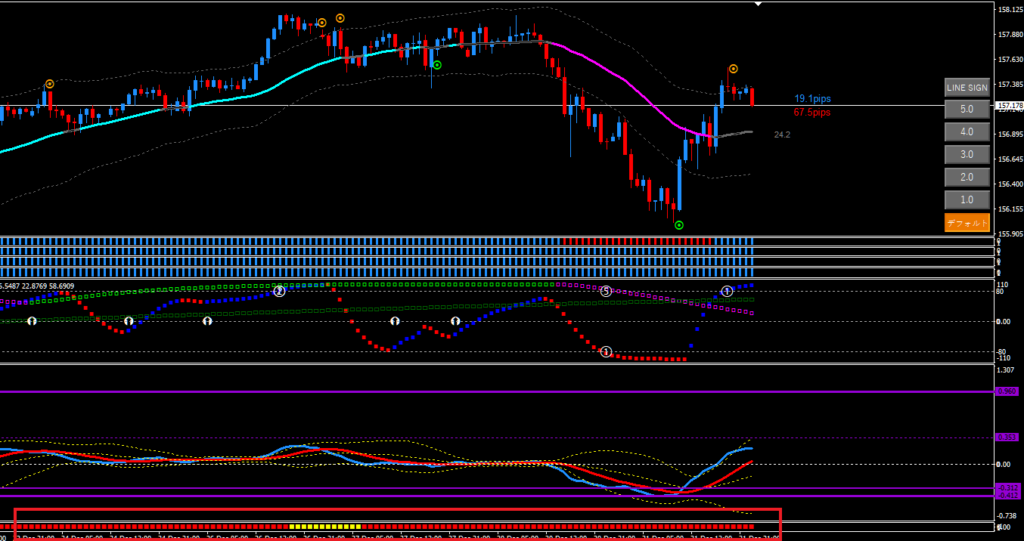
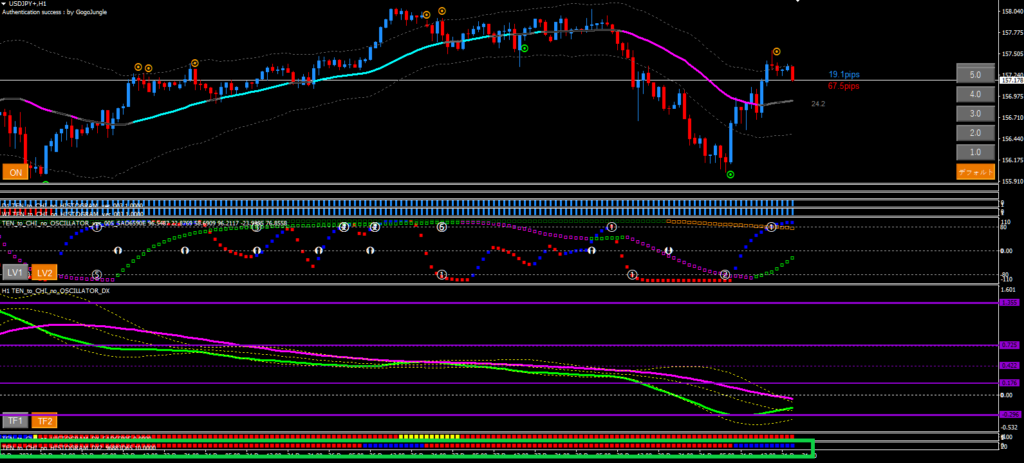
Heaven and Earth Histogram refers to the four bars at the top of the followingfour bars in the oscillator
Dollar-yen, 1-hour chart, January 1, 2025
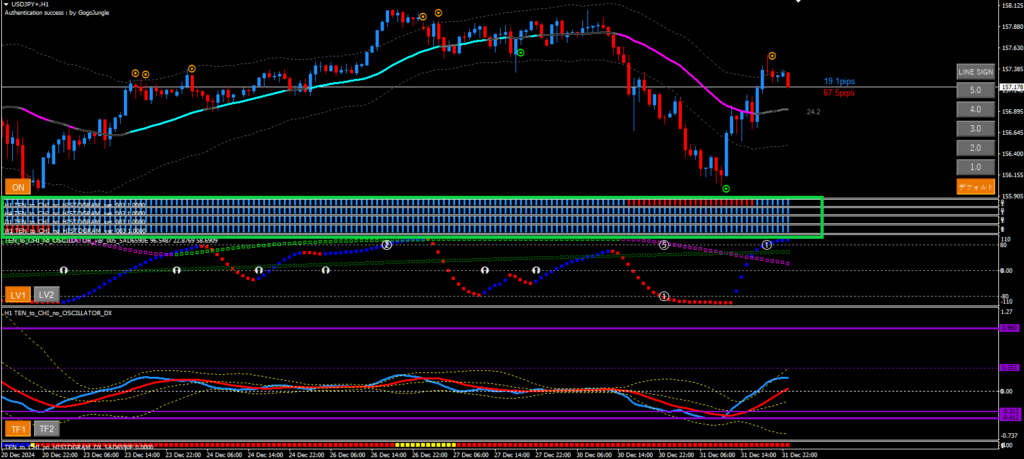
Since it is a 1-hour chart, the settings are CURRENT, 4-hour, daily and weekly.
The fundamental meaning of the histogram
In essence, a histogram isa distribution chart based on data.
An image of entering a bar graph by inputting data in Excel
In FX, it representsthe strength of a trendbased on market data.
Heaven and Earth Histogram is an indicator specialized for trend-following,
incorporating the calculation formula of Heaven and Earth dots
.
That is,it aligns well with the Heaven and Earth dots.
Depending on the symbol or currency,if the four histogram bars are in agreement, some traders enter in the direction after a point signal.
The role of Heaven and Earth Histogram
Heaven and Earth Histogram
- avoids false signals
- MTF analysis up to the third higher timeframe
is a capable indicator for that purpose.
In the Heaven and Earth indicator, entering in the direction of the histogram enables a trend-following entry, in other words
helps avoid false signals
.
In the manual, during entry, if the oscillator and other conditions align and CURRENT only aligns, that is OK; however
the more of the four that align, the higher the edge
.
For example, if all four are blue, the higher-timeframe three trends are strong for buying!
If the signal dot appears on the execution timeframe, you can enter!
In my case, I prioritized oscillator conditions and oscillator DX, treating histogram lightly...
So I used to display only one bar, but from now on I plan to display four bars to further avoid false signals.
Next, I will introduce Histogram DX!
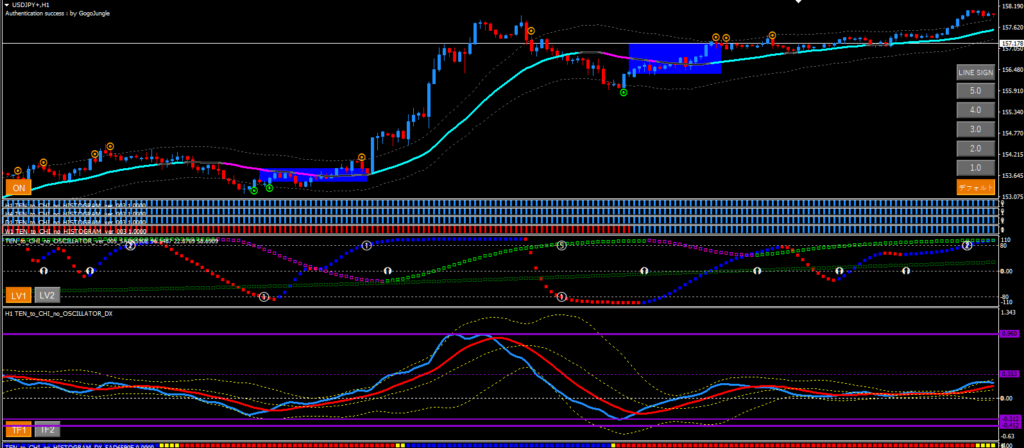
About Histogram DX
Histogram DX isa visualization of Oscillator DX.
Dollar-yen, 1-hour chart, January 1, 2025
The thinnest indicator at the bottom is Histogram DX.
Actually, it's easier to understand if you display the higher time frame of the oscillatorTF2.
There are two lines that visualize which is higher, buy or sell.
If blue, aim for long; if red, aim for short; yellow means the two lines cross
The setting is generally the next higher time frame.
This also
has the role of avoiding false signals
.
When the oscillator and line conditions are met, you can check whether the Histogram DX direction aligns to avoid false signals.
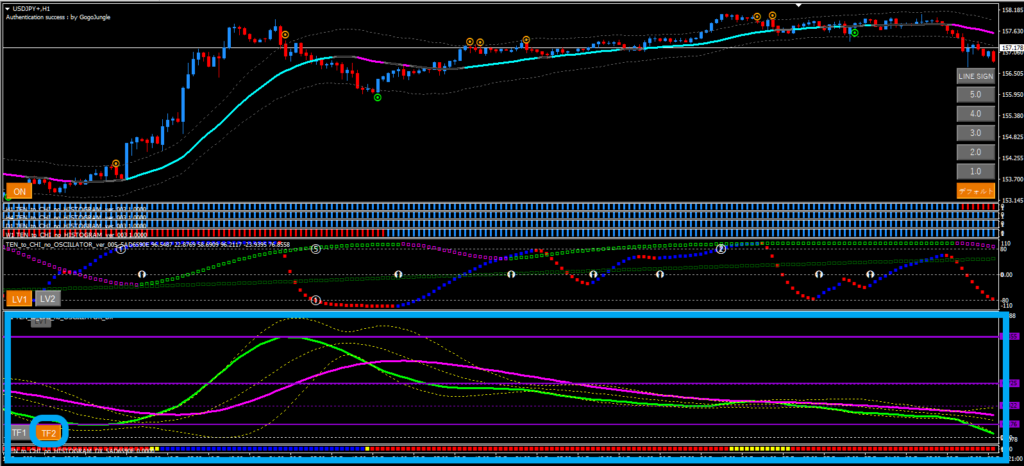
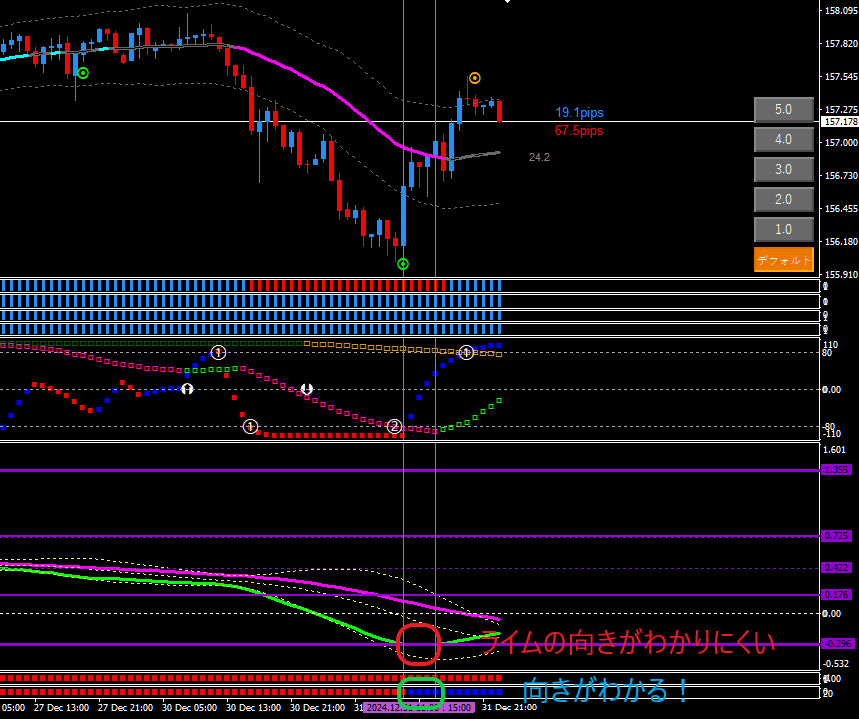
About Histogram DX2
Histogram DX2 is mainlyan indicator used in Heaven and Earth day-side swing.
Thelime direction of the Oscillator DX visualized.
In day swinging, it is used on 4-hour charts and similar to capture daily direction
As an example, I set it on the Dollar-yen 1-hour chart this time.
Image at the bottom
The Lime direction, due to the nature of Oscillator DX,reacts to the market faster than the magenta line.
Oscillator DX's Lime reacts quickly and is almost in sync with price movement
Therefore,it can quickly grasp the market direction.
In day swinging, it is commonly used for daily environmental awareness, but as in the image, you can grasp Lime's direction on other timeframes as well.
To be honest, I’m not yet able to use it fully...
For example, Histogram DX may be in a downtrend while the actual Lime direction is up, so it can be used to avoid false signals
That’s all.
This time, particularly
- the more Histogram matches, the higher the edge
- Histogram and Heaven and Earth dots are calculated the same and go well together
I realized this, which wasa great gainfor me.
There may still be things I don’t understand yet... I want to input more and apply it to trading.
Thank you very much for reading until the end!