

【Explanation】An indicator that pairs well with the personal method "Oshi DX direction feel & point signs" is Fibonacci
The Sky and Earth Indicator
follows the flow of two higher timeframes (environmental awareness) and enters at the favorable points on the lower timeframe.
This is what it means.
Personally, the method from the oscillator DX directional sense, which I thought of, was praised by Abusan as something “resembling the unveiling of the Sky and Earth Indicator.”
In other wordsa method close to the orthodox trading of the Sky and Earth Indicatoris what it becomes.
This time, I will explain Fibonacci, which matched well with such personal methods.
Fibonacci that harmonizes with the Sky and Earth Indicator personal method, oscillator DX directional sense, and dot-signal method
This method is similar to the orthodox method of the Sky and Earth Indicator.
- Buying on dips in an uptrend
- Selling on rallies in a downtrend
In short, it captures the initial move of Dow Theory (buying on dips, selling on rallies) to enter.
Then with Fibonacci that goes well with Dow Theory
target entries at psychologically significant levels
will improve accuracy.
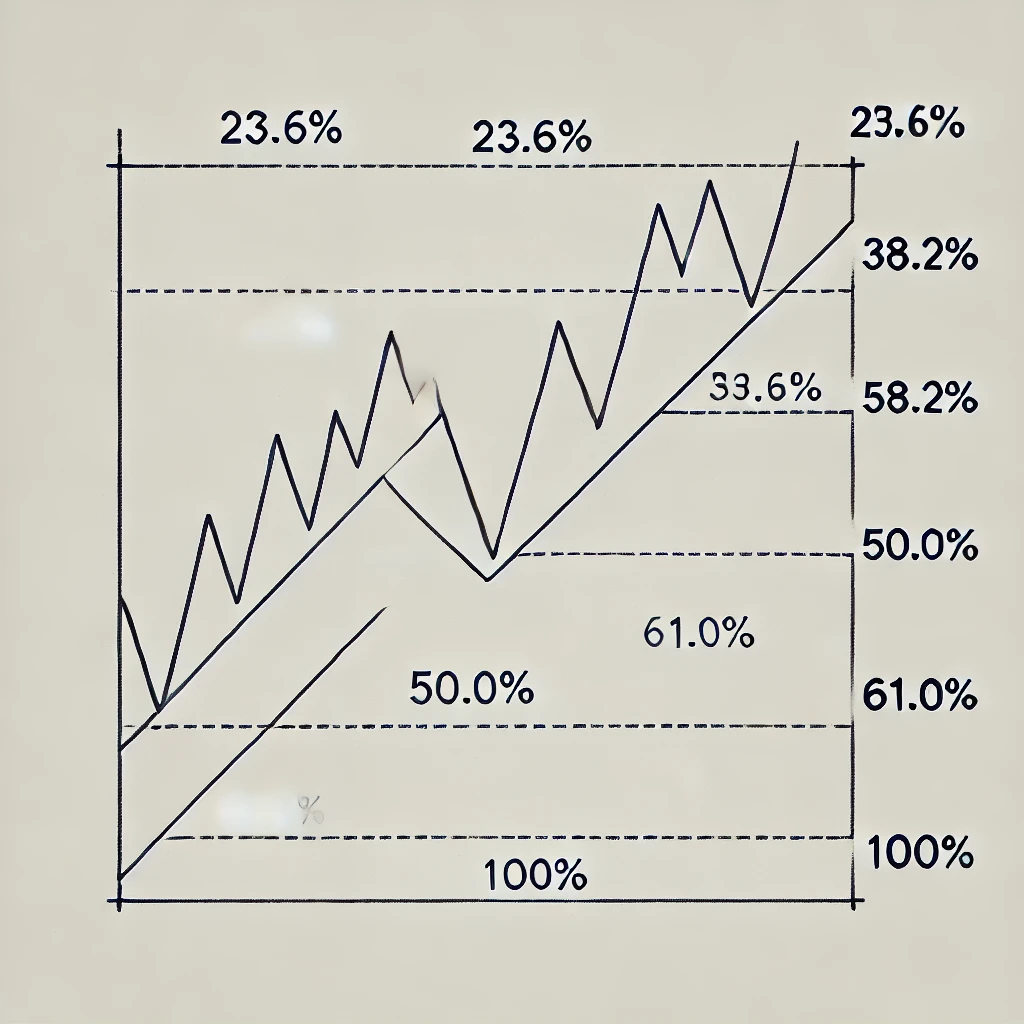
When you hear Fibonacci, you might imagine it as difficult.
However, in reality, traders tend to focus on
- 61.8%
- 50%
- 38.2%
as the key levels to watch.
Case on the 4-hour chart
GBPUSD, 4-hour chart.
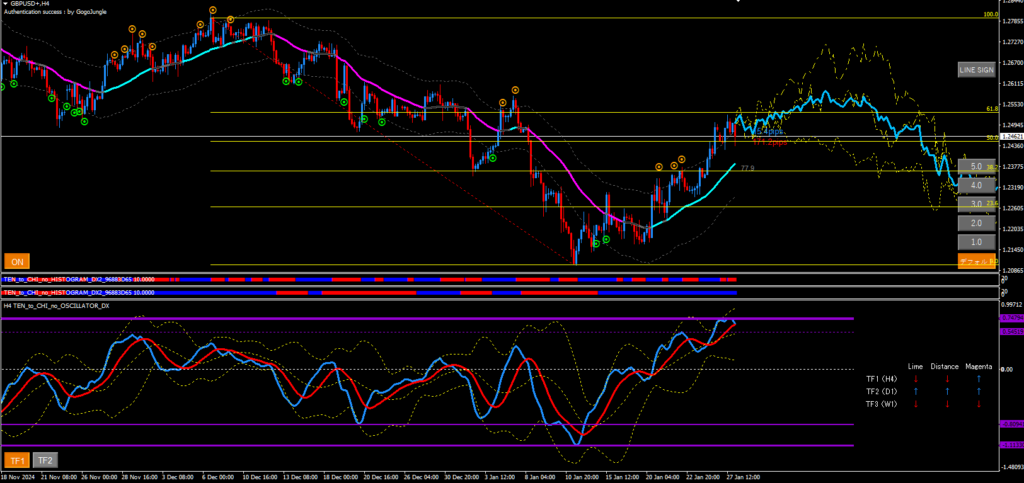
In my case, on the 4-hour chart, from the normal chart I draw lines
- from high to low
- from low to high
If the highs and lows aren’t visible, I zoom out once as shown in the image.
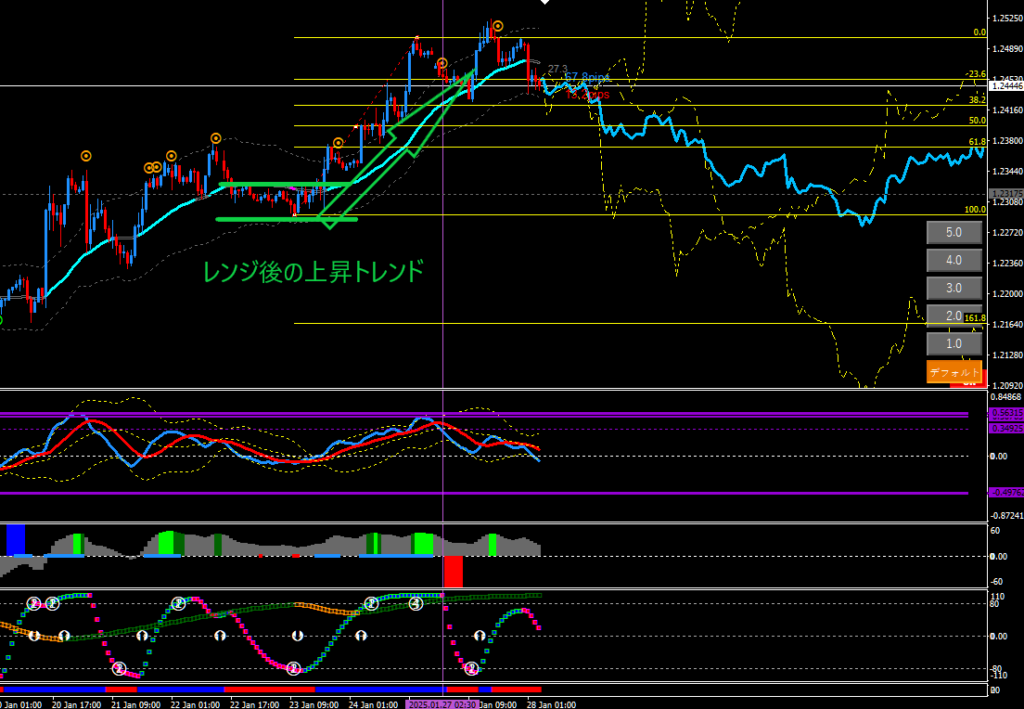
Right now,
the Fibonacci61.8%, meaning a commonly watched lineis present
and tends to cause a bounce
to occur.
Furthermore
the oscillator DX is rebounding at support 2–3 and turning toward a short bias, about to cross
as if about to cross.
It feels like a rebound and decline might be coming soon.
Case on the 15-minute chart
Let’s actually draw the lines.
The image shows
when the oscillator DX directional sense (4H) is long, a long signal appears on the 15-minute chart
.
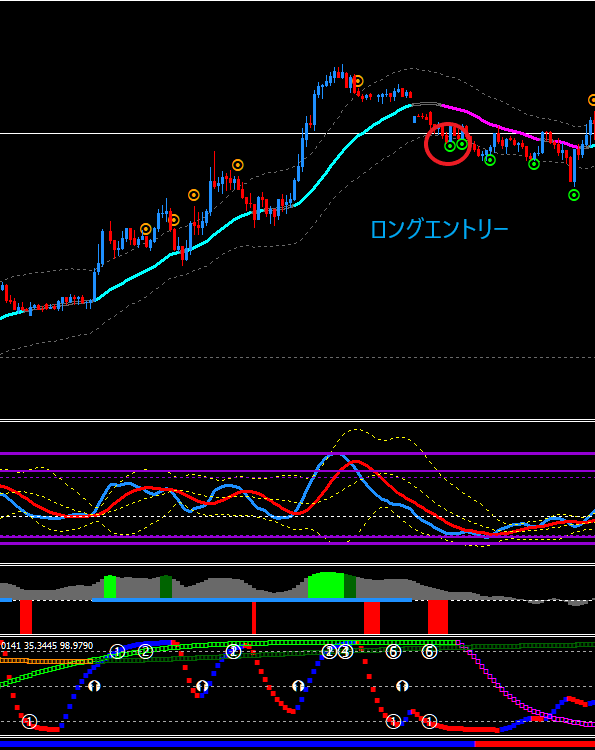
- Osc DX signal 1–2 with consolidation
- end of valley TF2 rising
- Oscillator ⑥1
There are good conditions, aren’t there?
I’ll draw Fibonacci on the 15-minute chart.
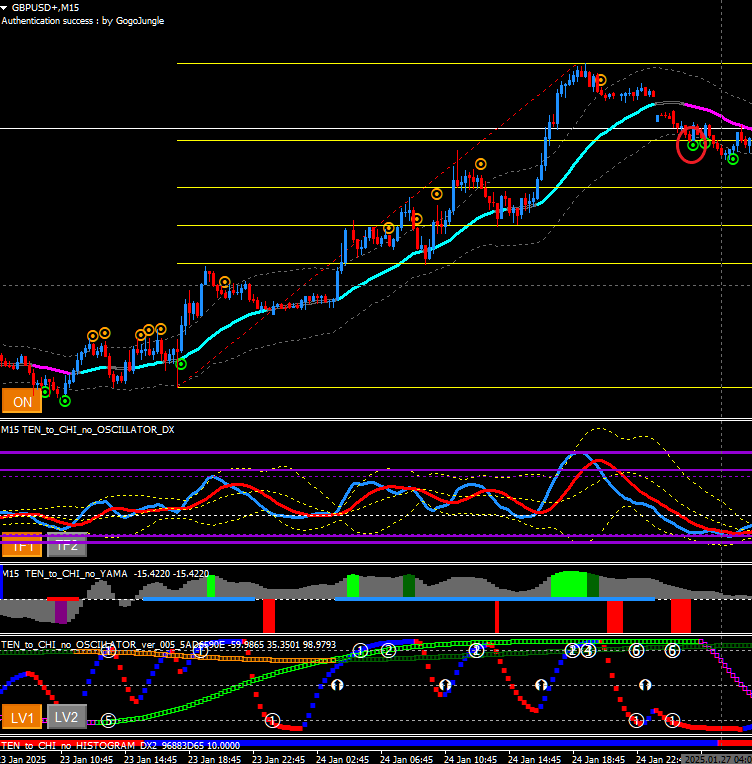
When the 15-minute chart is swinging up and down like this and you can’t tell which is the high or low,
drawing Fibonacci on a higher timeframe (1-hour if you’re on 15-minute)
makes it easier to understand.
Fibonacci on the 1-hour chart
Returning to the 15-minute chart.
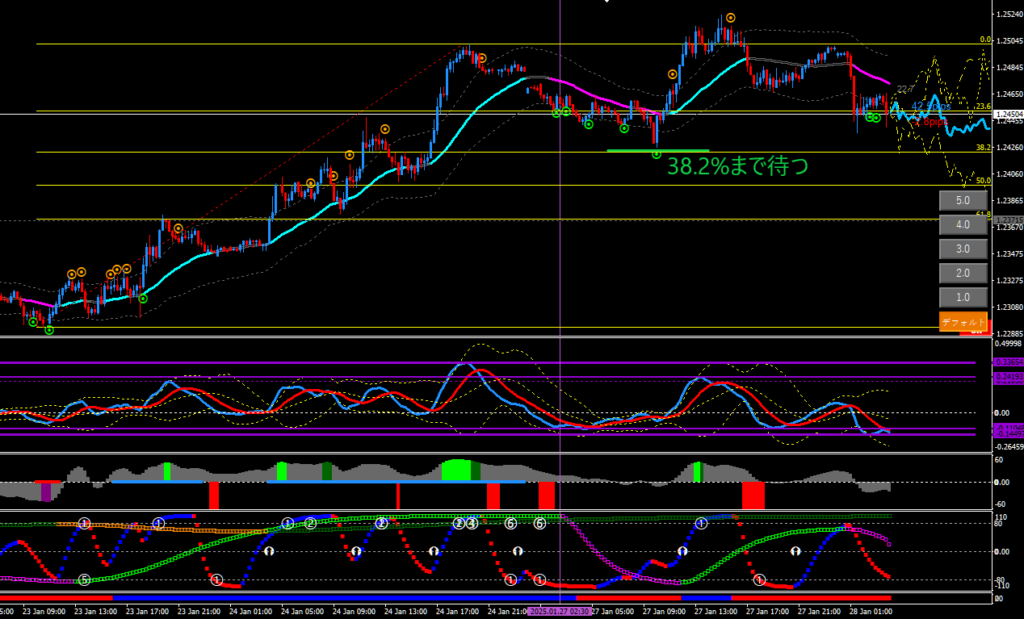
As shown in the image, when the purple vertical linesignals at 23.8%,
it is easy to be aware ofthat it may extend to 38.2%
and thus waiting can help target profit while also increasing accuracy.

If you have a strong case at 23.8% and still want to enter, when the stop loss is close to 38.2%, it is good to set the SL beyond that.
Summary

On the 4-hour chart, in addition to the oscillator DX state, we look at potential downtrends or uptrends using Fibonacci.
On the 15-minute chart,
- 38.2
- 50%
- 61.8%
Wait until these levels to enter, and you can target larger profits while improving accuracy.