

【Heaven and Earth Inquiry】A careful explanation of why the four points of MTF are a valid basis
Hello! This is Chirou.
Regarding the MTF on daily and 4-hour chartsFour key pointsthat we have introduced so far.

Why are the four MTF points fundamentally correct as a basis?
Aren’t you wondering about that and losing confidence in your trades?
To put it bluntly,
because the points tend to move in that direction = easier to predict
they are.
In this article,
why each of the four points is a correct basis
will be explained clearly one by one.
1. Oscillator TF1 color change from ①, second occurrence
The second occurrence of color change from Oscillator TF1①
is often seen as a valid basis for MTF in Abusan’s Investment Guide as well.
Let's look at the actual chart.
USD/JPY Daily
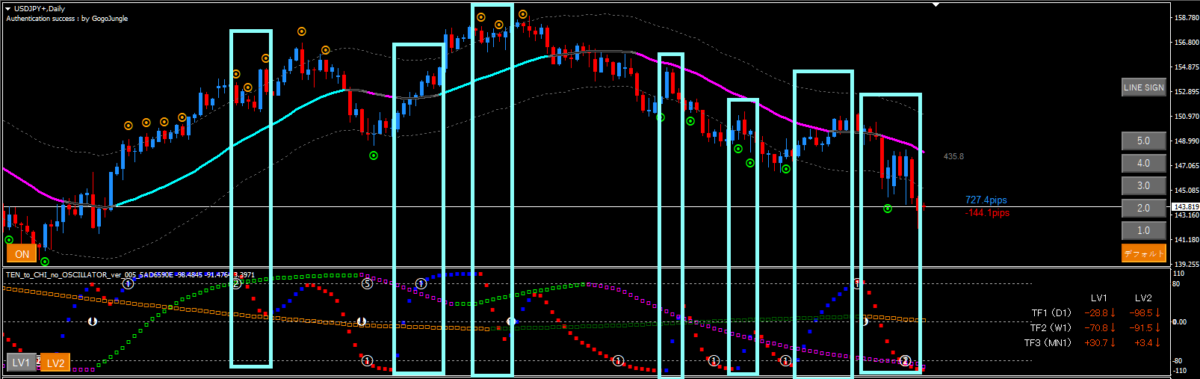
I circled the color change from ①.
From the image, you can see clearly that
the color change from ① tends to move in that direction
as a characteristic.
① is a state where TF1 is
overbought or oversold
.
From there,the second color change that confirms a reversaloccurs.
The second color change is
the point where the reversal from overbought/oversold is confirmed and started
.
Therefore, it is a strong and valid basis for MTF.
2. Oscillator DX crossing immediately
Right after the Oscillator DX cross, in the Heaven and Earth indicators,
- Entry trigger
- Avoiding whips
serve two roles.
Furthermore,
- you can discern the end of the Oscillator’s sustained movement
It is an excellent indicator.
Let's see in the image.
Daily USD/JPY
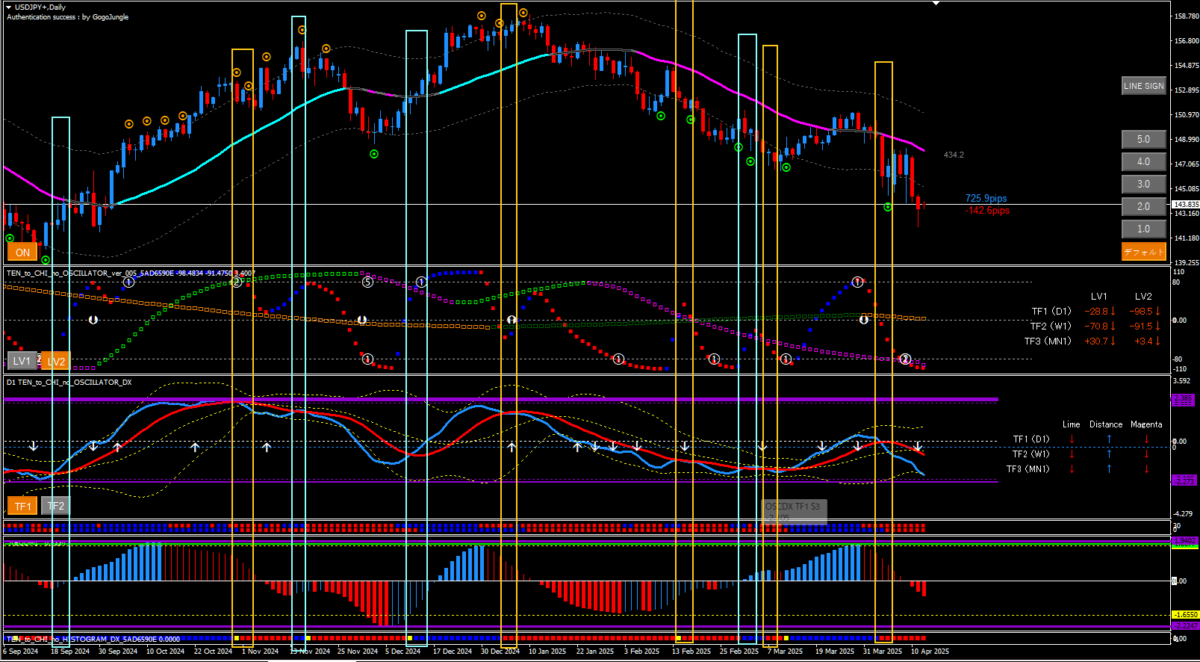
This is the daily USD/JPY. I circled the long cross in blue and the short cross in orange.
Generally,
right after a cross the price tends to move in that direction, and a cross from support/resistance strengthens the basis
.
One-point tip
Is it still valid if Oscillator color change and Oscillator DX cross occur in reverse (contrary) direction?
There were scenes where the Oscillator color change and Oscillator DX cross moved in the opposite direction.
For example, in DSATEA 1-hour trades, with the 4-hour chart as a filter,you can avoid unnecessary entries.
Similarly, users who rely only on Heaven and Earth indicators also have a correct directional signal, so for instance
- Clear MTF on the daily chart
- Follow the two 1-hour lower-timeframe charts according to the procedure
By doing so, you can trade at areas of high odds while avoiding unnecessary entries.
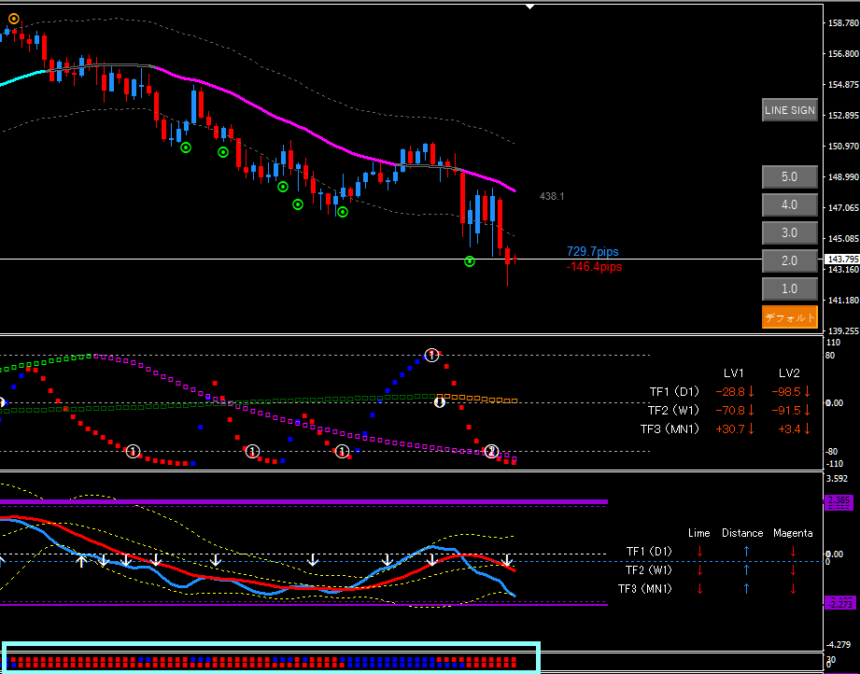
3. Histograms DX2 ver2 alignment
Next is Histograms DX2 ver2.
The histogram shows
the direction of Oscillator DXLime and Magenta.
Lime reacts quickly, which is why it is watched, but when Magenta also aligns, the justification for trading in that direction becomes stronger.

Personally,
Oscillator LV2 = Lime
Oscillator LV1 = Magenta
that’s the idea
Histograms DX2 ver2articulating the alignment of top and bottominto words
After a cross,the trend continues
and this provides ample basis in MTF.
Let's look at a chart.
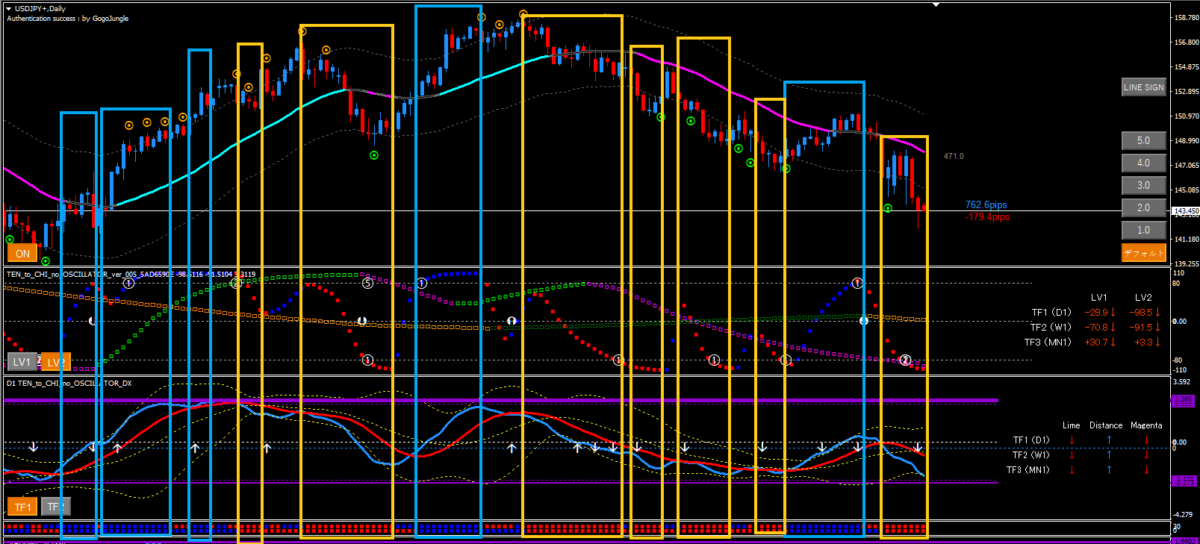
Again, USD/JPY on the daily chart.
I circled the top-bottom alignment with a blue frame (long) and yellow frame (short).
Most of the moves head in that direction after the top-bottom alignment
In terms of accuracy, this is as strong a basis as the Oscillator color change or the Oscillator DX cross immediately after the cross.
Moreover,
In Histograms DX2 ver2,the trend continues until one side changes color,so alignment of top and bottom alone provides strong justification
.
Personally, I felt more opportunities when the top-bottom alignment started.
Reason:
When the top-bottom alignment starts, the price tends to continue in that direction for a period
.
After this analysis, you can understand how strong the top-bottom alignment in Histograms 2 ver2 is, and it makes sense why Abusan updated it.
4. ABUDMI: the bold line, first occurrence
Finally, ABUDMI.
ABUDMI is an indicator that has been installed since the release of Heaven and Earth’s Daily Swing,
and it looks at the direction of the trend.
If you remember ABUADX as strength and ABUDMI as direction, it becomes easier to understand
After crossing the 0 line, the first bold line has high odds.
Let's see in the chart.
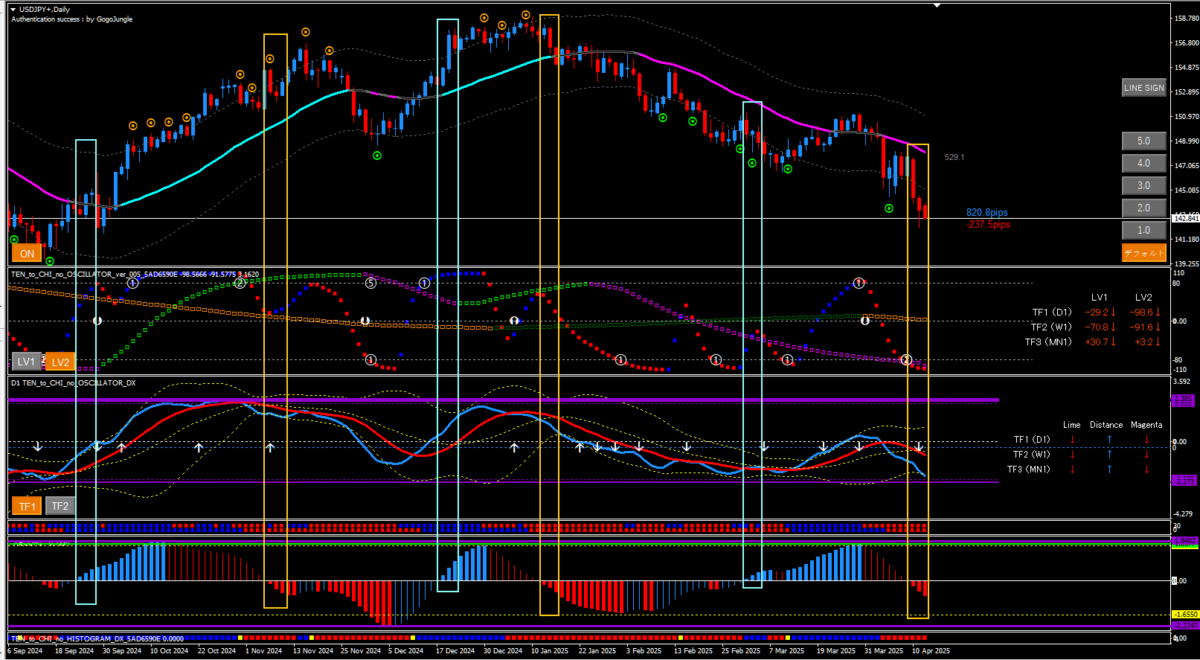
USD/JPY on the daily chart.
I circled the first to the third bars with blue frame (long) and orange frame (short).
As expected, the first bold line after the 0-line cross seems to have strong justification.
The reason is clear when looking at the image
After the 0-line cross, the first bold line tends to continue in that directionfor several bars
In other words,
- Color change from Oscillator TF1 ①
- Top-bottom alignment in Histograms DX2 ver2
Both indicate that the trend tends to continue, providing a strong basis.
Conclusion

To summarize, based on verification and discussion,
the four points of ABUBU’s MTF guide
all have strong basis
as a result.
The top-bottom alignment in Histograms DX2 ver2 has become clearer through deeper analysis, which explains why Abusan updated it recently.
I’m happy that this expands the currencies I can enter on DSATEA as well!
Thank you for reading until the end!
Feel free to leave a comment.