Indicator of Heaven and Earth explanation | Introducing meanings and ways of thinking one by one!
This is the knowledge base for the Sky and Earth Indicator users!

I bought the Sky and Earth indicators, but there are so many types that I don’t know what each one means...

I want to know about each Sky and Earth indicator in detail
Do you have such concerns?
Actually, many users of the Sky and Earth indicators and beginners have these concerns.
The Sky and Earth indicators are highly capable and multifunctional, but unless you understand the meaning, the way to read them, and the correct usage of each component, you may not be able to use them effectively.MeaningandHow to read, andproper usageare essential.
If you closely study the manual created by Abusan, you’ll understand, but in this article I’ll explain from my perspectiveso that beginners can understand,
each Sky and Earth indicator is explained carefully
one by one.
While touching on common questions, I’ll present them in a ready-to-implement form.
What are the Sky and Earth Indicators

The Sky and Earth indicators are a unique set devised by a person named Abusan.

Abusan spent an enormous amount of time creating the Sky and Earth indicators
By combining indicators of different types, it is possible to enter with a high edge.
Furthermore,
- They can be traded across various FX currency pairs, cryptocurrencies, and futures
- They support from scalping to swing trading
That is a major feature as well.
Sky and Earth Indicator: Sky and Earth Point
It’s a type of indicator that is not often seen.
Rather than an indicator, it looks more like a signal tool.
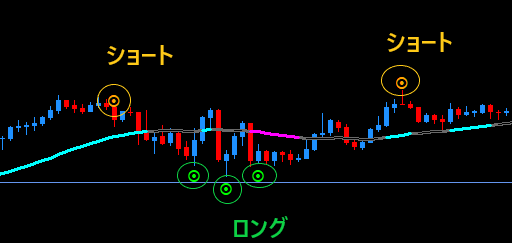
Basically,
- Long entry when the point lights up
- Short entry when the short lights up
is how you trade.

What exactly is Sky and Earth Point?
Abusan’s Post
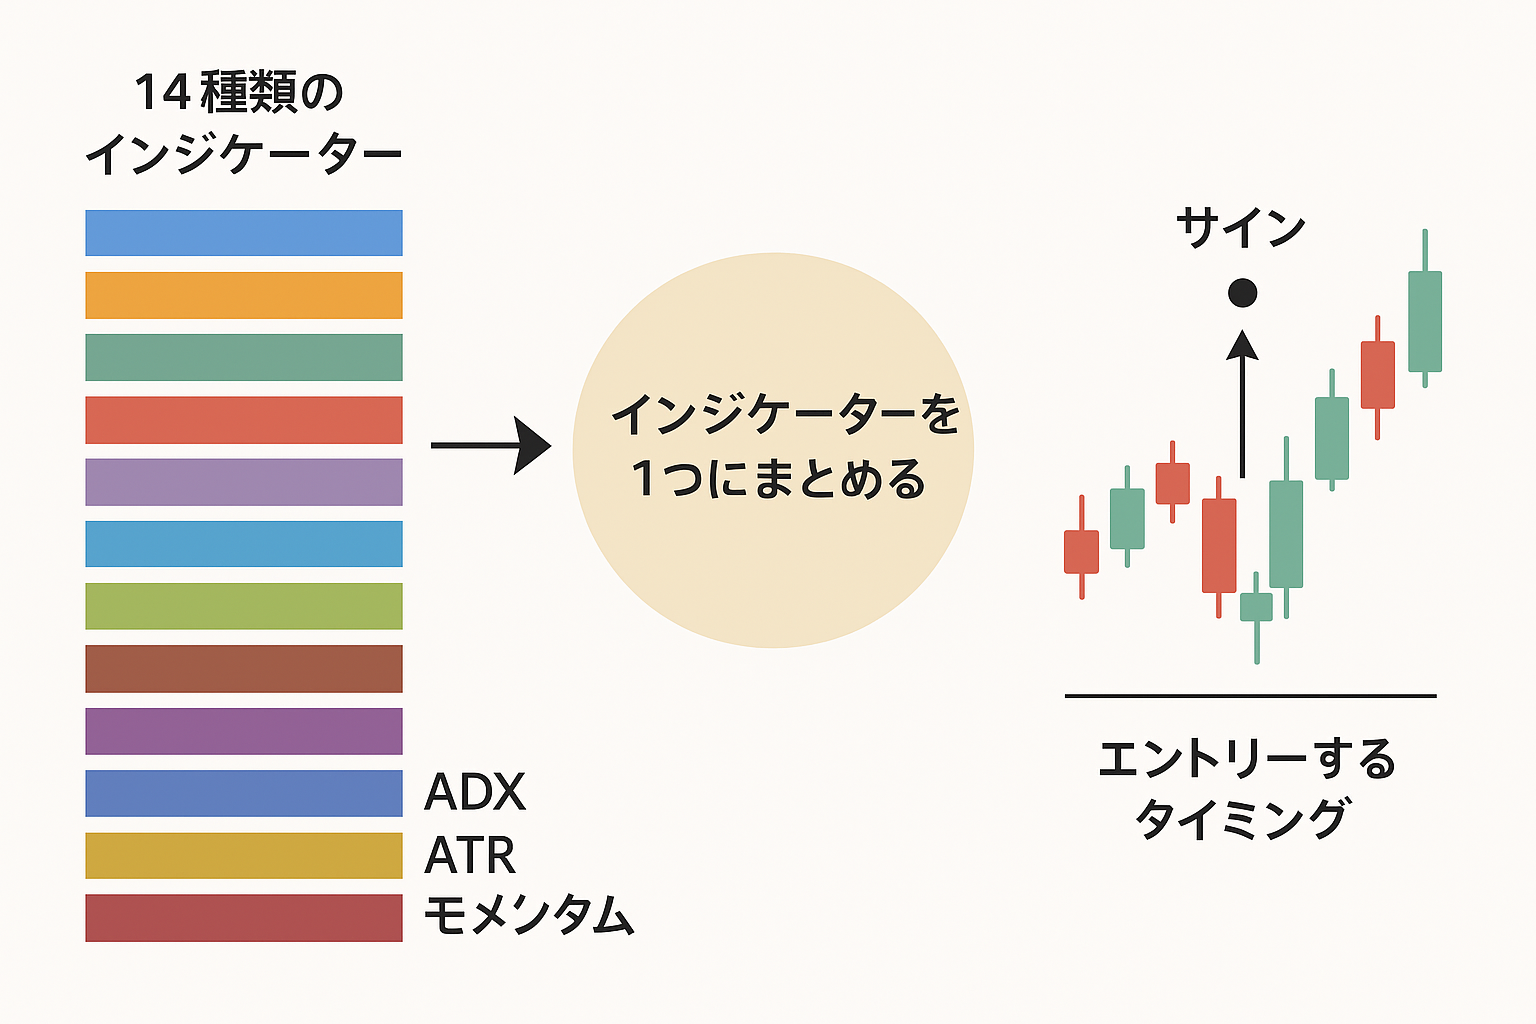
Among indicators, the 10 (now 14) indicators centered on ADX, ATR, and MOMENTUM were consolidated into one (with the same period or a multiple thereof), then categorized by use via programming. That’s the gist.
I apologize for the unclear explanation, but when you phrase the actual logic, this is how it looks.
To explain in my own simple way,
Sky and Earth Point is a consolidation of 14 indicators into one,
and the point is generated where analysis of past charts indicates an entry timing.
That’s how it works.
The movement of Sky and Earth Point is heavy
and that makes sense.
My view is
it lights up when the price moves beyond a band formed by a complex logic
in a simple rule.
For the timing of point generation, see here.
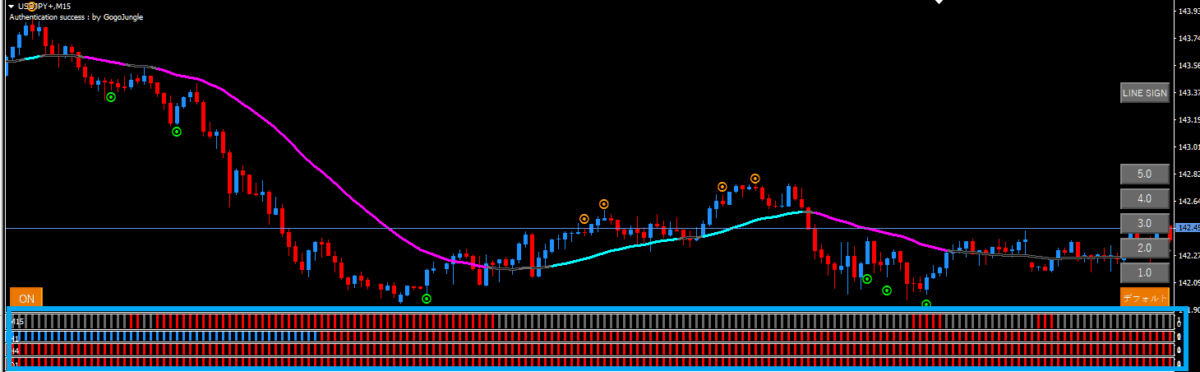
Sky and Earth Indicator: Sky and Earth Line
The Sky and Earth Line is primarily traded by aiming for a bounce off the line.
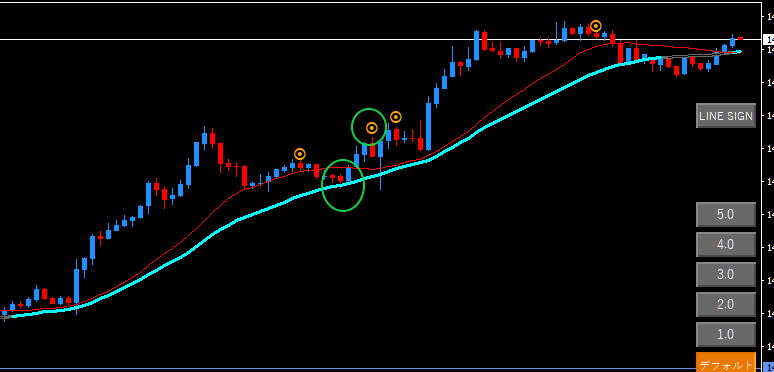
The classic move is to target when a trend is present.
In highly volatile, strong-trend markets,you can simply trade by line color alone.
As shown in the image, when you look again you can see
it’s something akin to a moving average
and it’s difficult to match with settings and values due to its complex logic.
Always running through the middle of the market
Originally,
there are bouncing moving average trades and Grandville's rule trades
but those are traded with reference to oscillators and histograms.
That’s trades on the Sky and Earth Line.
Personally, line-rebounce trading using the Sky and Earth Mountain trend detector is the easiest and most efficient.
[One-word advice] Narrow down entry points
For beginners with the Sky and Earth indicators,
focus on entry points
- points
- lines
as the main options.
Lines have more entries, points have fewer
- People good at trend markets should use line rebounds
- People who only do pullbacks and retracements can aim for points to points
That would be good.
Sky and Earth Indicator: Oscillator
In fact, this was the oscillator that took the most input time
Sky and Earth Oscillator
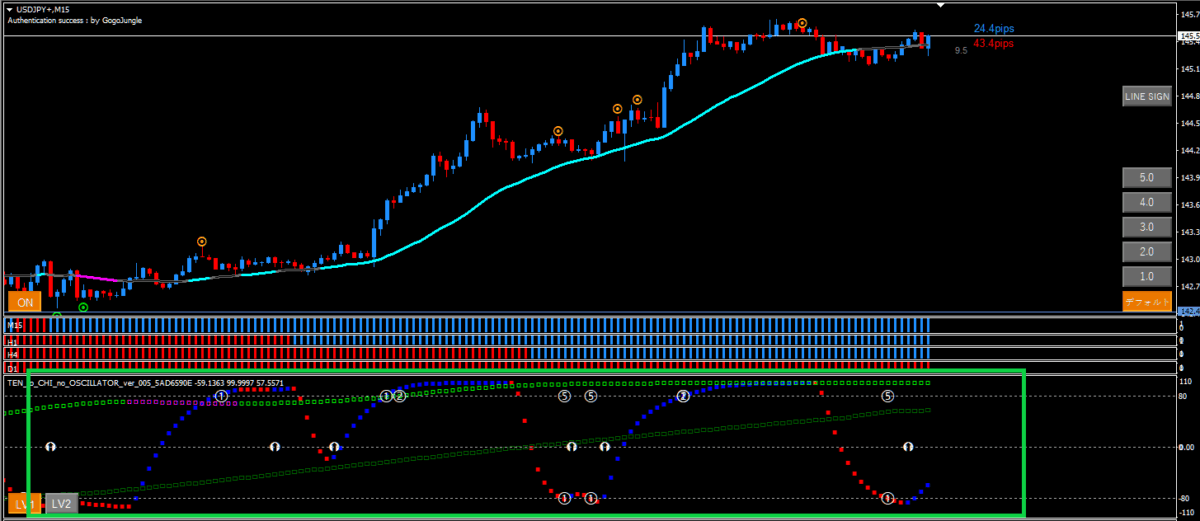
The general role of a typical oscillator is to
judge overbought and oversold
.
Reason for the judgment is
- if overbought, aim for selling
- if oversold, aim for buying
to aim for
The Sky and Earth Oscillator is the same: overbought means look for a sell; oversold means look for a buy.
For beginners, first
look at theSignal ①: Overbought/oversold
so please start there.
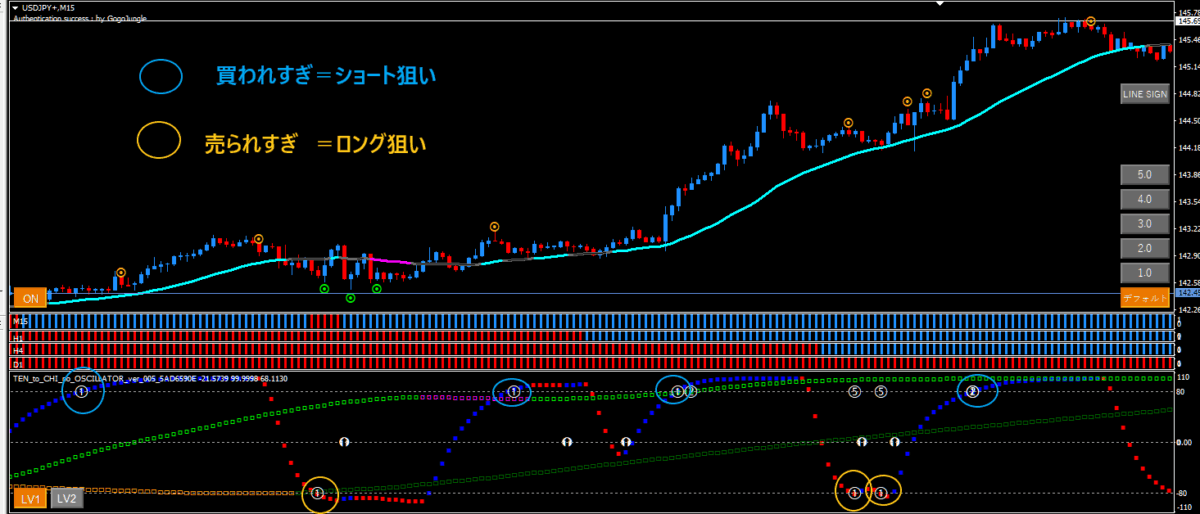
After that, trade in the direction of the higher timeframe with a long or short entry at the points or lines.
Let’s look at Oscillator TF2!
Now it’s green, so a long bias.
Yellow circleis the entry point.
- First time: long point and lighting up
- Basic pullback buying
- Second time: line rebound
- Up in all directions = meaning the two higher timeframes are long, so line rebound
Abusan's indicators are strongly focused on MTF (multi-timeframe)
to the point thatthey are highly adept at market awarenessas an indicator.
Of course they can be used for entry points as well, but without overthinking it
use them as indicators for market awareness
and that is fine.
If you remember them as indicators for market awareness, eventually you’ll be able to enter using oscillators too
Sky and Earth Indicator: Oscillator DX
Oscillator DX has the roles of
- catching the end of oscillator stalling quickly
- avoiding false signals
- increasing the edge of entries
- MTF
.
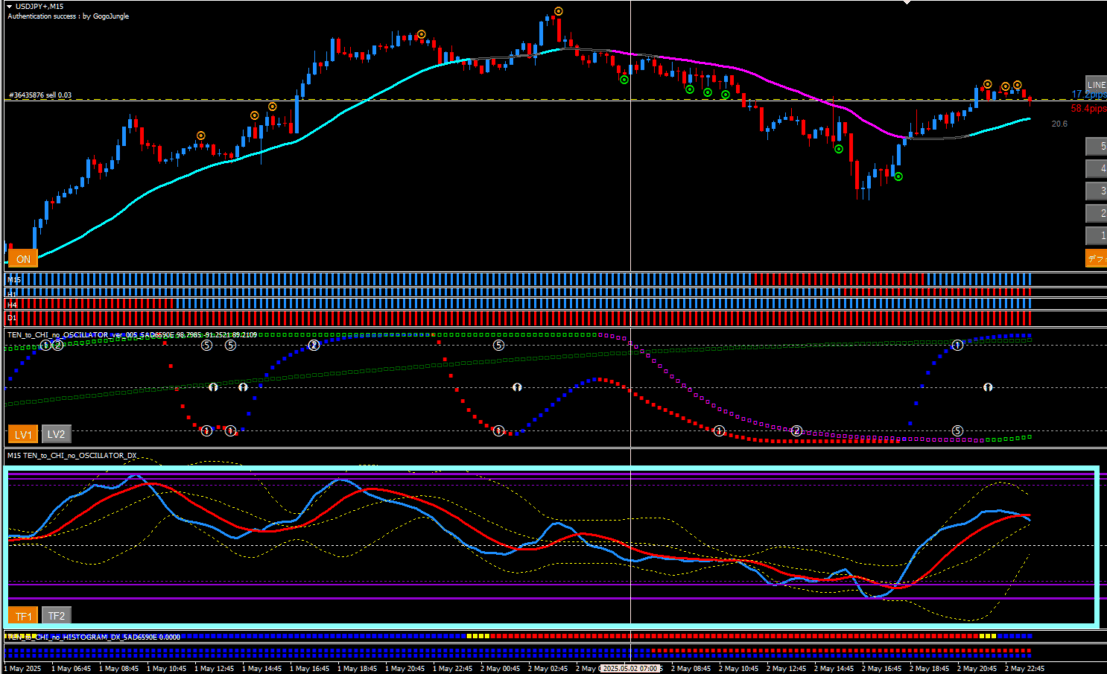
Basically, entering after Oscillator DX crosses helps avoid false signals and increases edge.
Right after a crossit tends to move in that direction, soit can be used as market awarenessas well.
Sky and Earth Indicator: Histogram
Histogram incorporates the calculation for Sky and Earth Point, soit pairs well with the point.
With updates, trend mode can be turned on/off and ranges can be identified.
It serves to avoid false signals
.
Personally, the more four lines align, the higher the edge and win rate, sohistogram is a tool to increase win ratein this sense.
Unlike other indicators,
you can judge up to three higher timeframes at a glance
which is the great advantage of Histogram.
Sky and Earth Indicator: Histogram DX
Finally, Histogram DX.
The idea behind Histogram DX is simple.
Check the buy/sell zone of the higher timeframe at a glance
.
Histogram DX displays the buy zone and sell zone of the oscillator DX on the next higher timeframe.
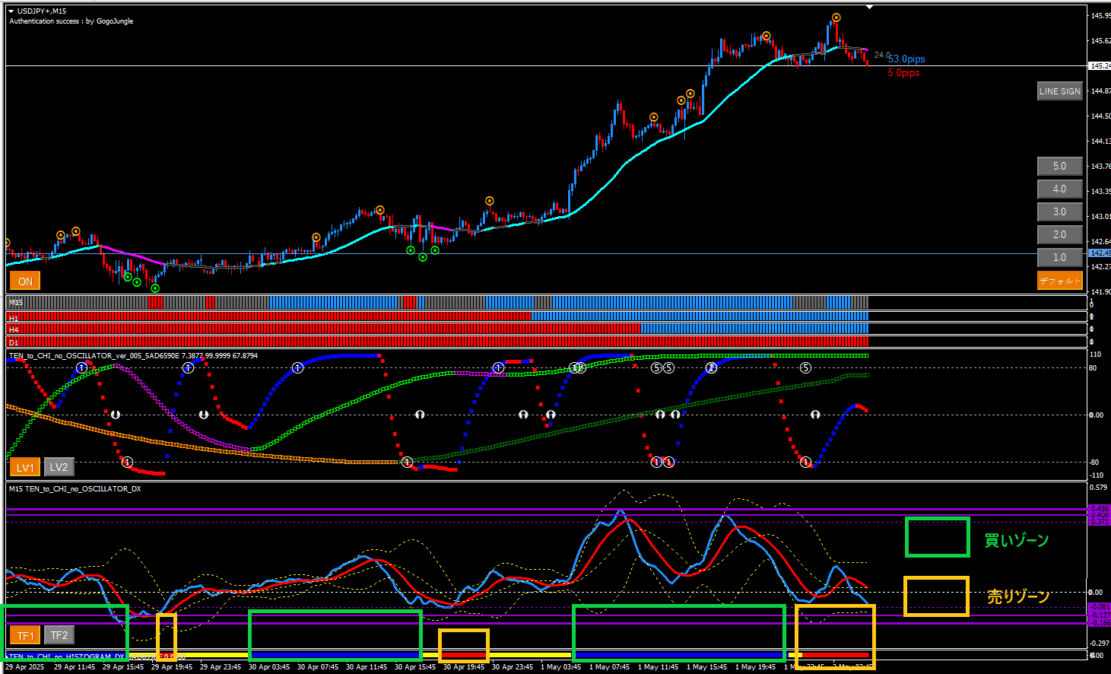
- When the higher timeframe is in a buy zoneLong targets
- When the higher timeframe is in a sell zoneShort targets
That is the basic approach.
Summary

Here is a summary of this article.
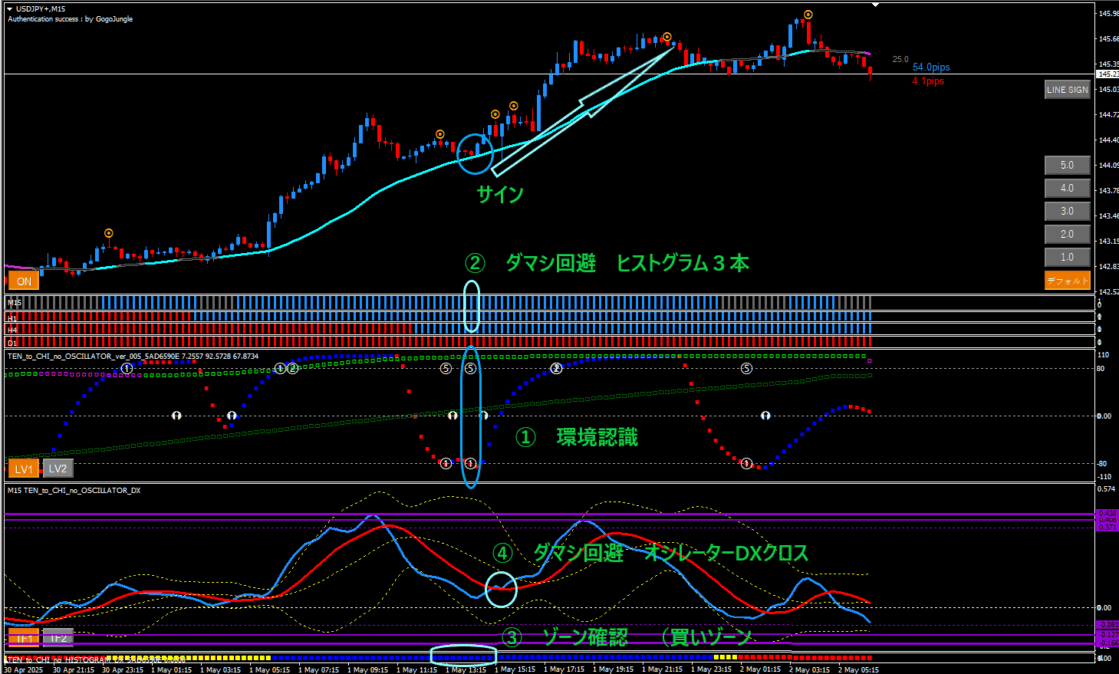
When a point or line signal appears
- Use the Oscillator to perform market awareness
- Use Histogram to increase win rate while avoiding false signals
- Use Histogram DX to confirm buy/sell zones
- Use Oscillator DX to avoid false signals
→ Enter
This is the flow.
In today’s market (May 2, 2025, USD/JPY, 15-minute chart), these are the target areas.