

[Basis] Reasons why the direction of lime for Oscillator DX and Oscillator LV2 are similar, and how to use them in the market and strategies
There was something I understood in the process of verbalizing and validating trades.
That the Oscillator DXLime and Oscillator LV2 are similar
in their behavior.
In this article,
- the reasons why these two indicators are similar
- the strategy for point-based fully automated trading
will be explained clearly.
【Basis】Why the lime direction of Oscillator DX and the LV2 of Oscillator LV2 are similar

This is shown on the 4-hour chart only the following are displayed:
- Oscillator TF1 (LV2)
- Histogram DX2 (lime direction)
- The lime direction of Oscillator DX
Only these are displayed.
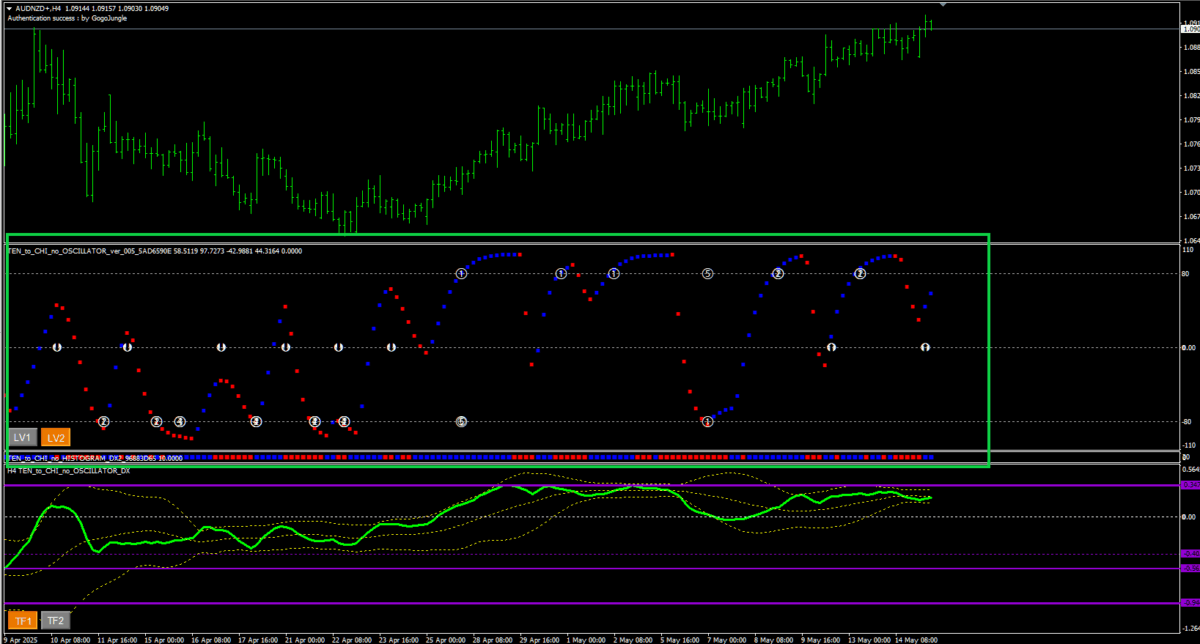
The directions of Oscillator LV2 and Oscillator DXLime are similar in orientation, though the high-low ranges differ.Their directions are quite similar.
The reason is thatboth react quickly.
Furthermore,
Oscillator LV2 responds quickly and its accuracy is twice that of LV1,
which increases the edge at entry.
Within the green frame, it is common for the Oscillator LV2 and Histogram DX2 (Oscillator DX) to share the same color.
Moreover, since they share the same color, combined with the higher accuracy of Oscillator LV2,parts where the trend is clear can be identifiedas such.
This was the conclusion.
【Basis】Strategy considerations for the lime direction of Oscillator DX and Oscillator LV2

In a 15-minute chart trade, it is known that entering at points aligned with the 4-hour Oscillator DX lime direction allows for clean pullbacks and retracements.
Furthermore,
watching Oscillator LV2 together increases the potential of that trend
which is possible.
In other words, the win rate for pullback buys and retracement sells on the 15-minute point trades increases.
A remarkable feature of oscillators is “linking”
One notable point is that
all oscillators displayed on the chart are linked
to each other.
15-minute chart
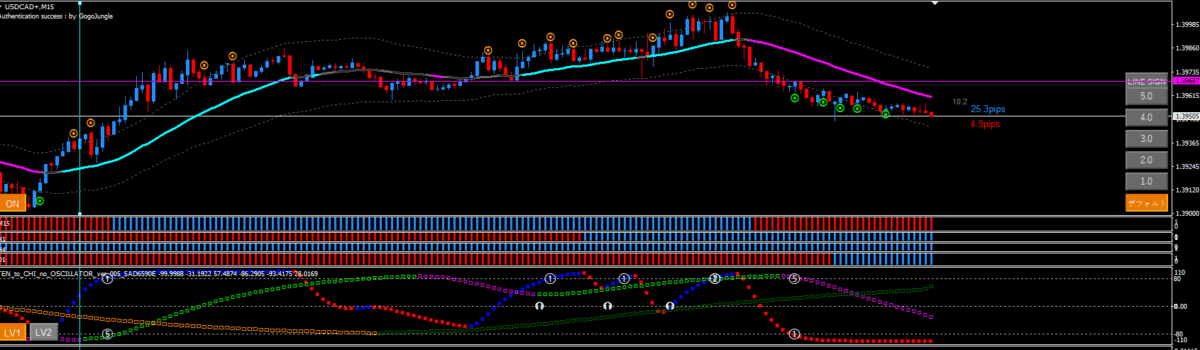
Oscillators are daily observed, butTF2 and TF3 are in real-time fully synchronized.
To explain in detail, TF2 is the 1-hour chart, and TF3 is the 4-hour chart, butthe state is the same across each timeframewhen viewed.
Moreover, you can also see overbought and oversold positions.
From a personal view, what I want to say is
When performing environment recognition on a 15-minute chart trades by following the 4-hour chart (Oscillator DXLime direction), by also looking at the state of Oscillator TF3 on the 15-minute chartyou can completely clear the environment recognition
This is the result.
【Strategy】Oscillator LV2 and Oscillator DXLime in trading

Now, it is well known that entering in alignment with the Oscillator DXLime direction on the 15-minute point trades is effective for environmental recognition.
In trading, what exact effects does it produce?
We will delve into that.
In the DSATEA environment,there is a benefit of being able to automatically trade at points while solidifying environmental recognition
.
Furthermore, in DSATEA you can
narrow the range
using oscillator filter settings.
By narrowing the range, you can set rules such as not taking long when the market is overbought, and not taking short when oversold.
Additionally, using LV2 which is faster and more accurate than LV1,you can quickly detect overbought/oversold
and avoid unnecessary entries
This is the idea.
For shorts (setting not to short when oversold)
- Level H 100
- Level L -80
For longs (setting not to long when overbought)
- Level H 80
- Level L -100
In point-to-point trades, an extremely important point is
to discern trend reversals
is important.
On the 4-hour chart, when it is already oversold, you can automatically avoid going short.
This article ends here.