

【Evidence】A method and measures to quickly identify reversals when the oscillator of the Heaven and Earth indicator sticks
It's Shirou!
Using the Heaven and Earth Indicator, do you have any of these concerns?

When will the oscillator jam be resolved?

I want to know the timing of reversal after oscillator jam!
By knowing the reversal timing when the oscillator is jammed, you will be able to tell whether entering is possible and whether it is correct as market awareness.
In this article,
We will clearly explain the forward direction and reversal timing when the oscillator is jammed.
Based on the indicator’s manual, we present it from a personal viewpoint
【Basis】 Heaven and Earth Indicator’s oscillator jam

The Heaven and Earth Indicator includes an indicator called the Heaven and Earth Oscillator.
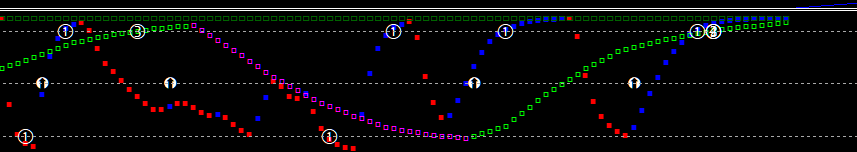
From signs such as ⑤・⑥ and all-directions, by also looking at other indicators, you canTrade with a higher edge.
However, the problem is
when the oscillator is jammed, for example
Other indicators look great, but is it possible to long when Oscillator TF1 is jammed above?
Oscillator TF2 is jammed, is it correct as market awareness?
there are challenges during the jam.
In other words,
when jammed, will it continue in that direction or reverse?
It is important to determine this.
In the next phase, we will introduce methods and countermeasures.
【Basis】How to quickly identify reversal during oscillator jam and countermeasures

First, as the classic method, as per the manual,
look at the Oscillator DX
to determine the forward direction and reversal when the oscillator is jammed.
IBM stock price
It is a daily chart of a certain stock price.

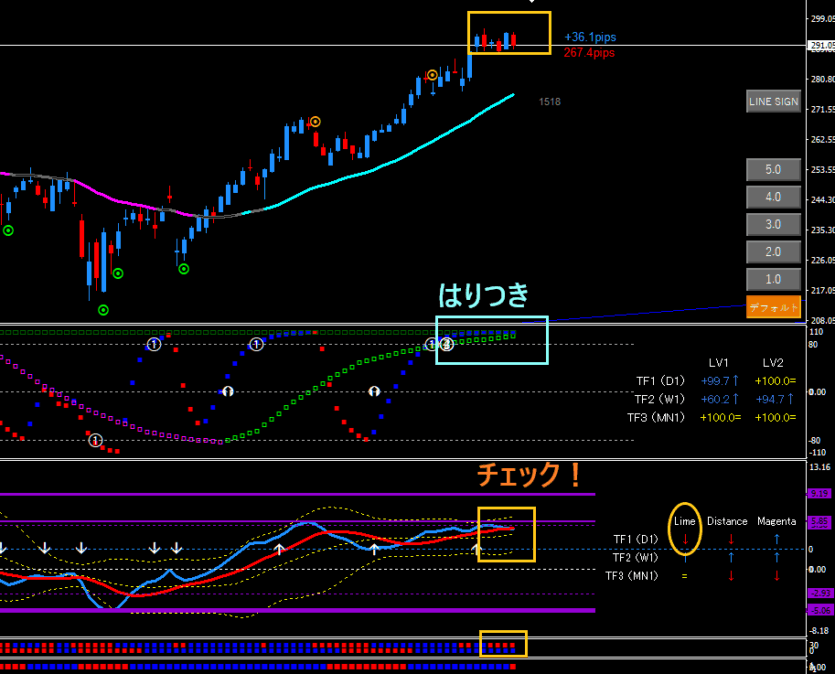
It’s viewed on Oscillator TF1・LV2
Looking at the candlesticks, since the price has crossed the dotted band, it seems about to come down.
However, with Oscillator TF1・LV2 jammed, we cannot tell when it will decline.
Let’s look at Oscillator DX.
Histogram DX2 ver2 Lime is already descending (four icons)
Oscillator also trending downward
First, look at these two.
Moreover, Oscillator DX looks like it will cross (to be confirmed on the day’s candlestick).
Another point is
Is it a reversal after touching the resistance/support of Oscillator DX?
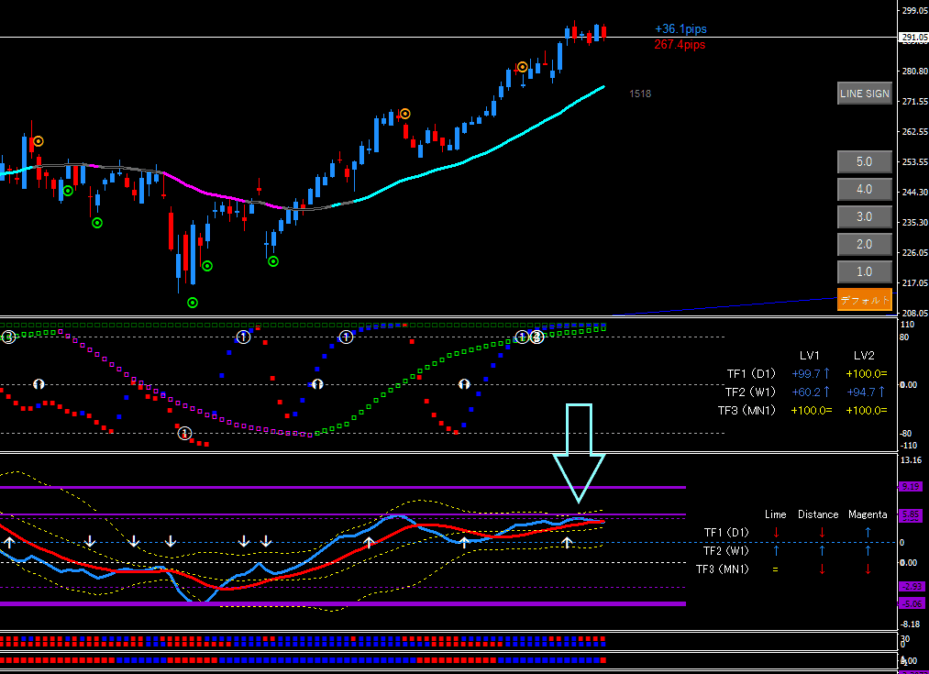
It’s touching Resistance ③ (dot).
If touched, it becomes a point where reversal is likely.
- If touched, be cautious
- DX cross after touching
- Trend reversal
This is the perspective.
Summary

Essentially
- Lime descending (red two icons or more)
- Oscillator Lime↓ arrow
If these bases align,the jam is nearing end.
Furthermore,
- Rebound from resistance/support
- Oscillator DX is about to cross
If these are also true, the jam ending is even more likely.
Also, by closely watching economic indicators, candlesticks will move as the indicators predict.
Oscillator TF2 jam can be understood for the end timing by looking at the higher-frame oscillator TF1
Advice
If Oscillator TF1 is jammed,
- Oscillator DX has not touched support/resistance
- Histogram DX2ver2 aligns up and down
then it can be targeted.
But in this case, other indicators must also be 100% correct.
After all, it is a matter of caution for overbought longs or oversold shorts.