

【Basis/Justification】My own interpretation & commentary on the new “ADX_DX” desynching of heaven and earth, as interpreted by me
Hello!
This is Chirou.

I want to deepen my understanding of the Heaven and Earth Day Swing ADX_DX

I want to know more about how to use ADX_DX
For those who are curious, it also serves as my personal memo,
I will explain in an easy-to-understand way my own preliminary interpretation of the new indicator ADX_DX
in an easy-to-understand way.
My Interpretation & Explanation of the New Heavens and Earth Day Swing Indicator “ADX_DX”
The new indicator ADX_DX for Heaven and Earth Day Swing, updated on August 8, is
essentially
a visualization of ABUADX
- The movement of the arrows of ABUADX
- The up-and-down movement of ABUADX
made clearer.
Let’s actually take a look.
CHFJPY
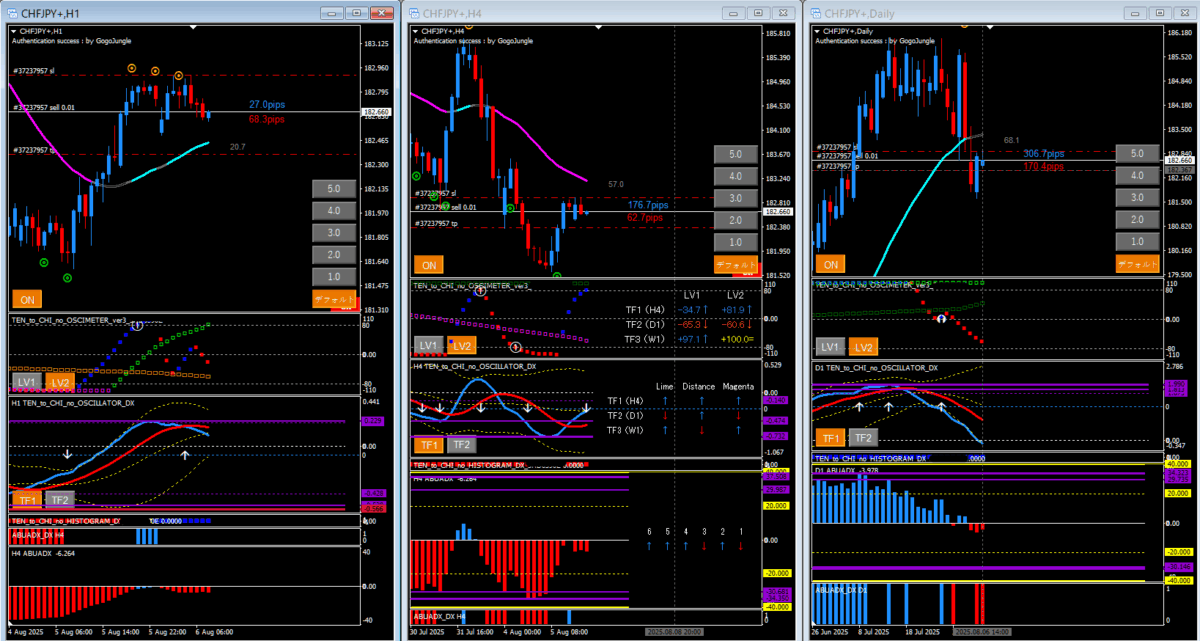
It’s the Swiss franc pair.
Right now it’s a bit heavy, so I deliberately turned off ABUDMI (for screenshots and blog posts).
What’s under the ADX is ABUADX_DX, right?
It is simply blue and red in structure.
As Abe said, it feels like a structure similar to the trend judgment engine of Heaven and Earth’s peaks.
How to place the ADX_DX indicator
According to the manual,
- 1-hour chart = TF2
- 4-hour chart = Current
- Daily chart = Current
these are the settings.
Since the 1-hour chart is TF2,
be careful as it may disappear or light up until confirmed.
Since it’s the 1-hour chart,
four bars (four hours) will light up and will be confirmed when the next candle starts.
Right.
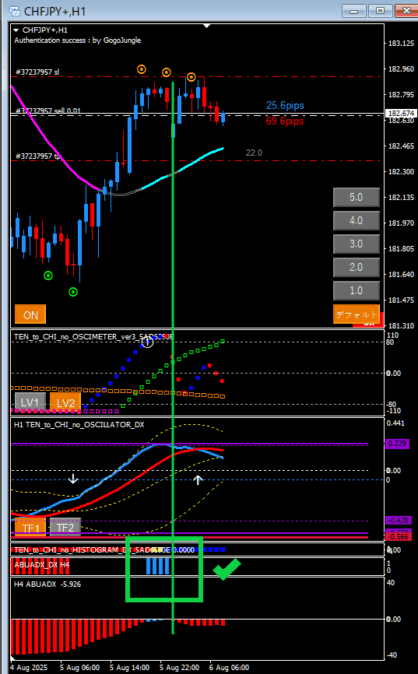
It’s better to place it near of the ADX, either below or above it.
How to read ADX_DX and how to aim for it
About the reading
ADX_DX displays when the ADX has strengthened, that is,
when the trend has become stronger.
It tends to light up when the ADX exceeds 20
- and it is more likely to display when there is a strong rebound from there
- also
as per the manualshows when the trend is strongyou can see.
As for the logic of ADX_DX,
- the strength of the ADX number itself (20 or higher indicates a trend)
- the number of times the arrows overlap in the direction of the ADX
are the two main factors, I think.
There may still be other logics incorporated.
About the method of aiming
According to the manual,
after the daily ADX_DX lights up, look for a trigger on the 1-hour chart to enter
that’s right.
In other words, the daily ADX_DX lights up, and the next day (6:00 AM / summer time).
It seems usable not only for day trading but also for scalping.
Basically,
- Daily ADX_DX — Current
- Daily ABUDMI — Current
is how to judge.
However, rather than staring down every move, at first it’s clearer to target only after the daily ADX_DX is firmly confirmed.
As you get used to it, if you can, watch ABUDMI as well and recognize the environment by looking at both.
Personally, my ironclad entry is as Abe mentioned with X
Daily chart with ABUADX_DX lighting up on the 4-hour chart
and then enter with the Heaven and Earth line trade on the 1-hour chart and a band touch exit.