

【Basis】Explanation and overview of the Distance (Distance) on the Heaven and Earth’s Oshima Meter DX
Shirou here!

What does the distance between the heavens and the earth on the Oscillator meter mean?

I don’t know how to correctly view it as evidence
For those who feel puzzled, this article explains and designs
the distance of the Oscillator DX (Distance)
and the considerations behind it!
【Evidence】Explanation and designまとめ on the distance (Distance) of the Oscillator DX between Heaven and Earth
What is the distance (Distance) of Oscillator DX?
The distance between the two lines of Oscillator DX
In other words, it represents the distance between the previous candle and the current candle, indicating the distance between Lime and Magenta.
So, which direction of the arrow is correct as evidence?What is the correct arrow direction?
Arrow for Oscillator DX distance — Approach
Oscillator DX is still somewhat confusing for many.
Regarding distance,
after a cross, the upward arrow (↑) and just before the cross, the downward arrow (↓) is correct
.
- After cross ↑: trend continues
- Before cross ↓: trend reversal / starting point

Key point
Basically, think of ↓ just before the cross, and ↑ otherwise
as a reasonable understanding.
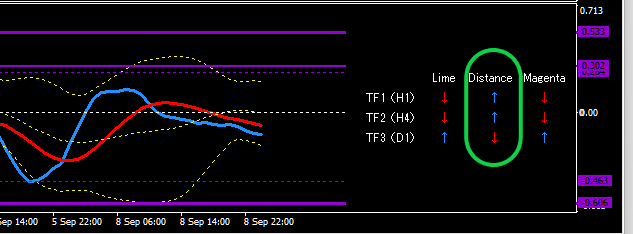
Chart Image Analysis
Let's look at actual images.
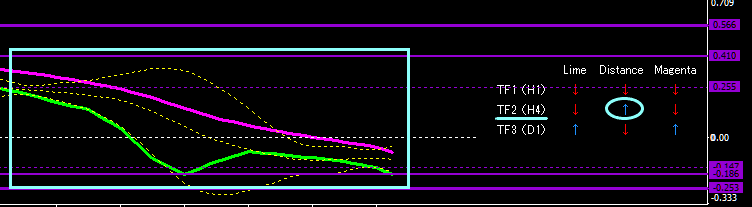
It’s the USD/JPY hourly chart.
Oscillator DX crosses on TF1 and time has passed, but since it’s after the cross, ↑ is correct.
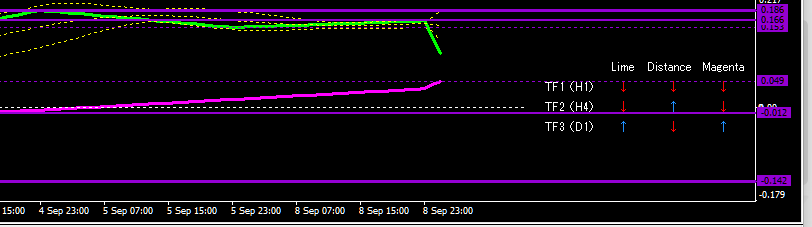
Let’s also look at TF2 as a basis.
Oscillator TF2
Even though TF2 has crossed a long time ago, the distance is ↑, so the trend continues and is a valid basis.
Since we’re here, shall we also look at TF3?
TF3 is hard to read, isn’t it?
(Perhaps because it’s hard to read, it’s limited to TF2 by design?)
Let’s look at TF3 on a daily chart.
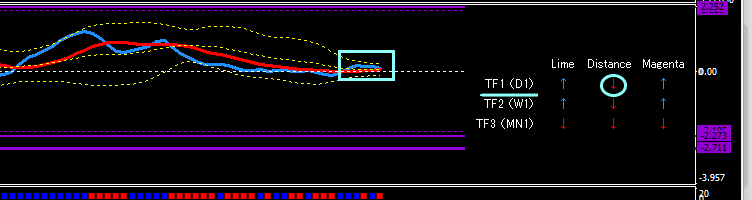
Since just before the cross it’s ↓, there is a possibility of a trend reversal (bearish cross).
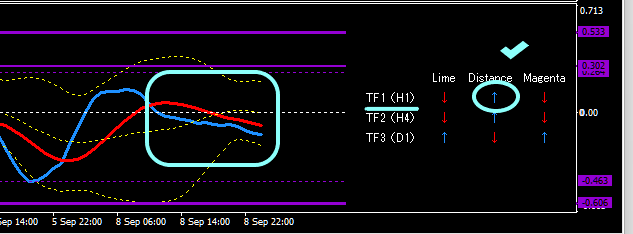
From my impression, Lime and Magenta point upward, and the histogram DX2 (Lime direction) is confirmed as blue, so in principlethe long perspective is evidenced as correct.
However, thanks to the distance, there are also judgments like “oh, it might cross downward”.and so,
- “It probably won’t move much”
- “TF1 and TF2 are short-biased, but the daily chart lacks a clear direction”
- In a short position, cut profits early
- “If the daily chart shows a bearish cross, aim for further shorts”
These are the kinds of judgments you can make.
Conclusion

That covers the distance of Oscillator DX.
Heaven-and-earth indicators include many diverse indicators, but
Oscillometer DX is a rare indicator with no peers
and therefore some users may have found inputs difficult, right?
I was one of them as well.
In particular, many people lack knowledge about “distance (Distance).”
Oscillator DX is not a moving average, but in usage it resembles it closely.
To explain with moving averages…
- Golden cross = buy zone
- Dead cross = sell zone
Also, after a Golden cross, the trend is treated as upward, and a Dead cross is treated as downward.
Also
Moving averages have short-term and long-term lines,the distance indicates a continued trend when lines diverge; and a tendency toward trend end or reversal when they converge
This is a characteristic.
1-hour chart — Gold
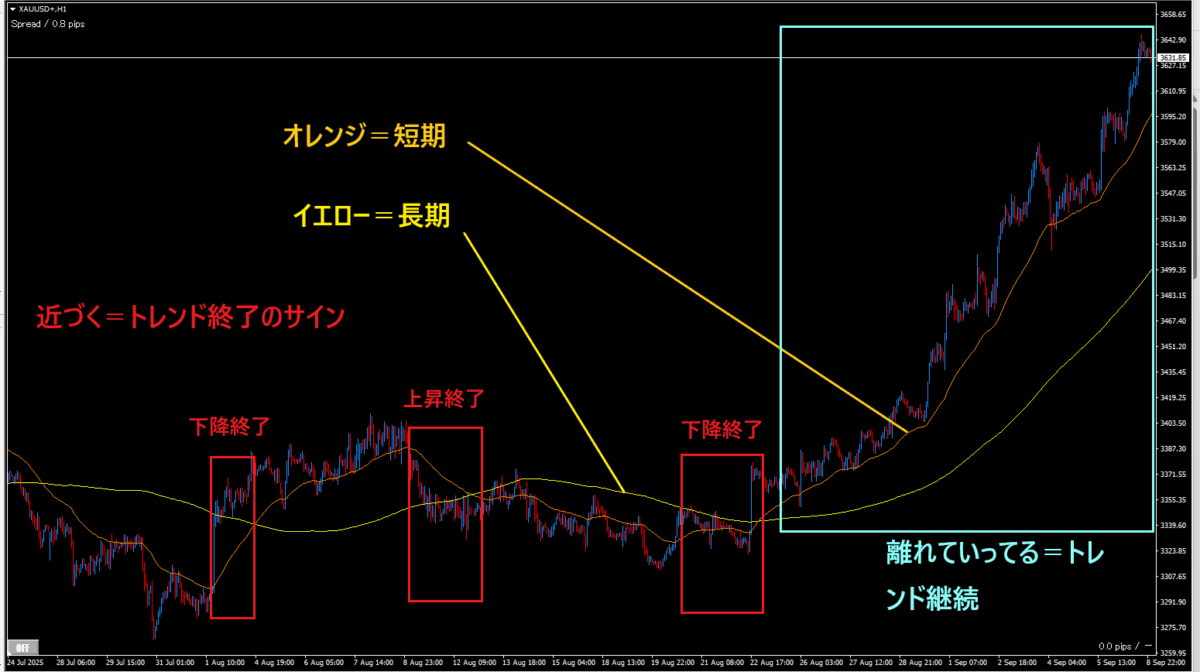
- Moving average line short-term = Oscillator DX Lime (faster to react)
- Moving average line long-term = Oscillator DX Magenta (slower to react)
In short, when the distance is ↑, the trend continues; when ↓, the trend may end or start a new move.
That is all for this article. Thank you for reading until the end!