

We tested Owari-san’s “valley technique” of the mountains of heaven and earth on an actual chart②
This is Shirou!
Chart validation of OWARI's Heaven and Earth Mountain and Valley method
This is the second time.
The first time is here
We will share the validation results.
What is OWARI's Heaven and Earth Mountain “Valley Method”
- Oscillator TF2 LV1 rises upward and sticks
- Valley signal (no MTF setting)
- Touches the line
A simple trade, isn’t it?
The ideal for Oscillator TF2 is
When long, it should rise in a straight line from -100 to 80
If it zigzags or moves irregularly, avoid it.
This pattern is evidence that the market is moving strongly in the direction of the trend.
This time's rules
Basic rules
- 15-minute chart
- About 10 currency pairs
- Oscillator only TF2 LV1
- (signals shown in all directions)
- Only highs and valleys are shown
- Stop loss at the recent high/low → risk-reward set 1:1 in width
- Rule may change depending on chart conditions
I am also developing the logic I actually think about, so I hope you find it helpful.So, we are testing at points where, on the most recent 15-minute chart, a valley occurs against the LV1 of Oscillator TF2
Testing OWARI's Heaven and Earth Mountain “Valley Method” on an actual chart②
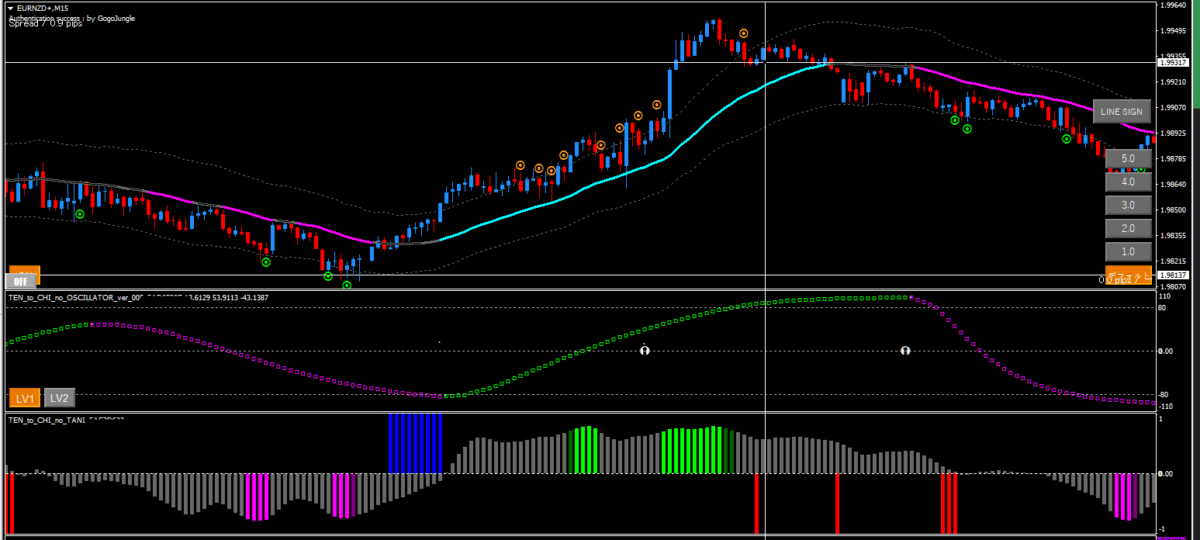
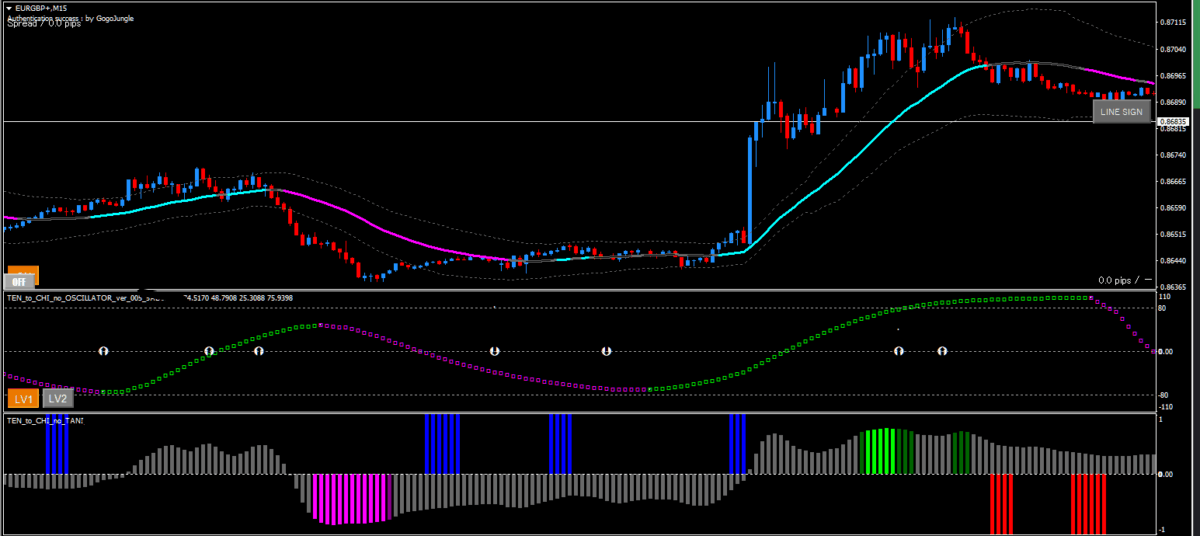
The TF2 is smooth at the cross line + a valley remains
Both conditions are good, but
It hasn’t touched the line, right?
If it were me, I might have entered at the second valley, butsince it has clearly crossed the confirmation line, be cautiousand wait for a confirmation.
Enter with a smaller lot, and since there are three consecutive valleys again and the mountain is about to end, I would exit at breakeven around here.
There is a large valley at the central-left blue valley.
TF2 is slightly lower but not in a bad shape. It has also touched the line.
The mountain remains, which is good, but the issue is the TPSL setting.
Since the most recent high/low is hard to catch, I would set it to the leftmost high for now,so what about the take profit next?
It could be a point, but since it was London time with high volatility, the appearance of a point could occur in odd places.
It actually appeared in a strange place.
The risk-reward balance is not great, but I think manually setting TP at the point is good.
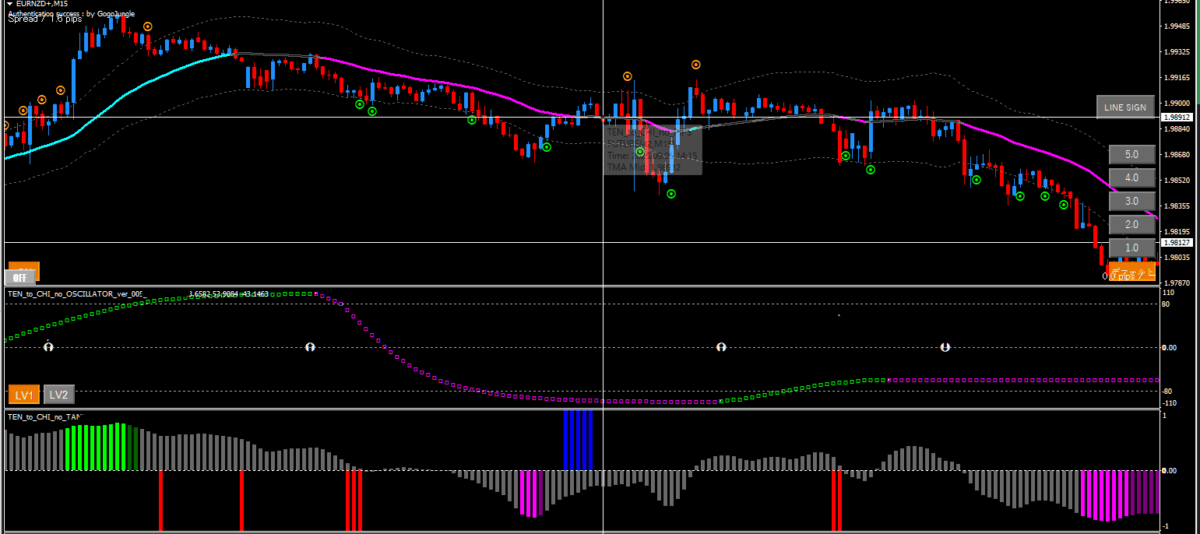
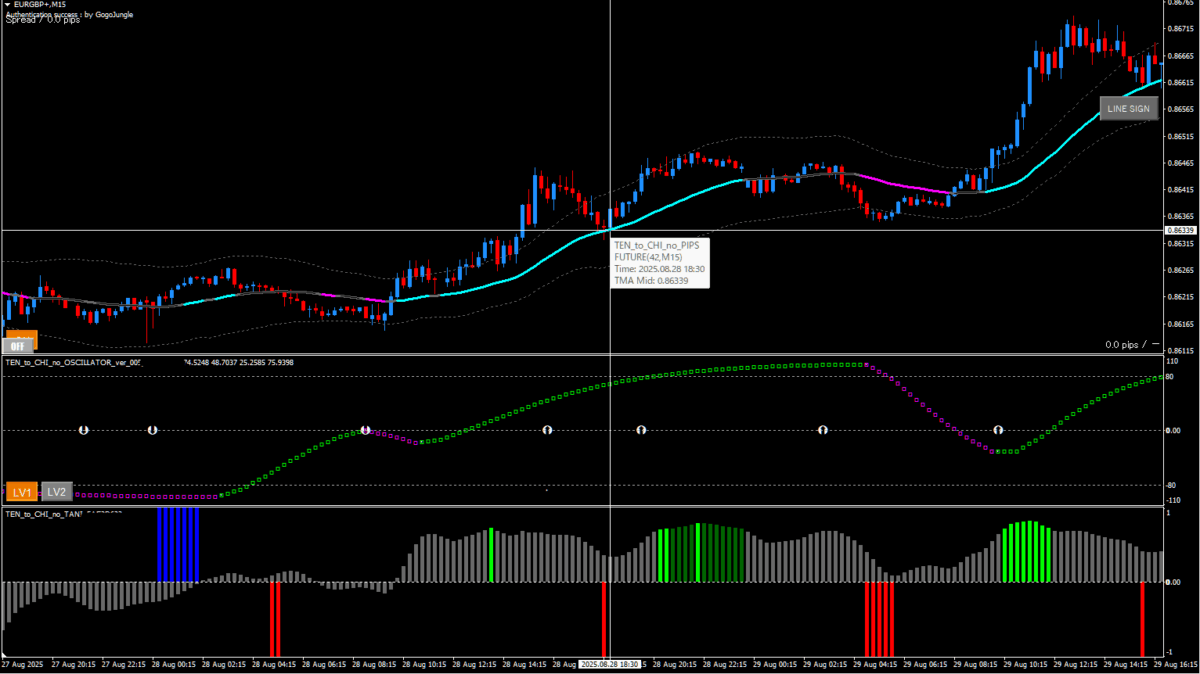
The blue valley slightly left of center.
The mountain remains and TF2 is smooth, and it touches the line, so entry is possible.
However,I would probably cut loss when TF2 changes colorI think.
If I had done environment analysis, and there was still room for a downward move on the 4-hour chart, I might continue (Oscillator TF2 LV2 color change to down, Oscillator DX crossing down, etc.).
But if following the method, entry is possible, and after all, it was a place where you could neatly take 1:1 from the most recent swing high/low, so waiting without overthinking may be fine.
TF2 is smooth, the mountain remains, and line touch are good conditions.
However,this is a stop loss.The reason is clearly due to an economic indicator.
Be sure to check economic indicators as well.
If there were no economic indicators, this pattern should have won.
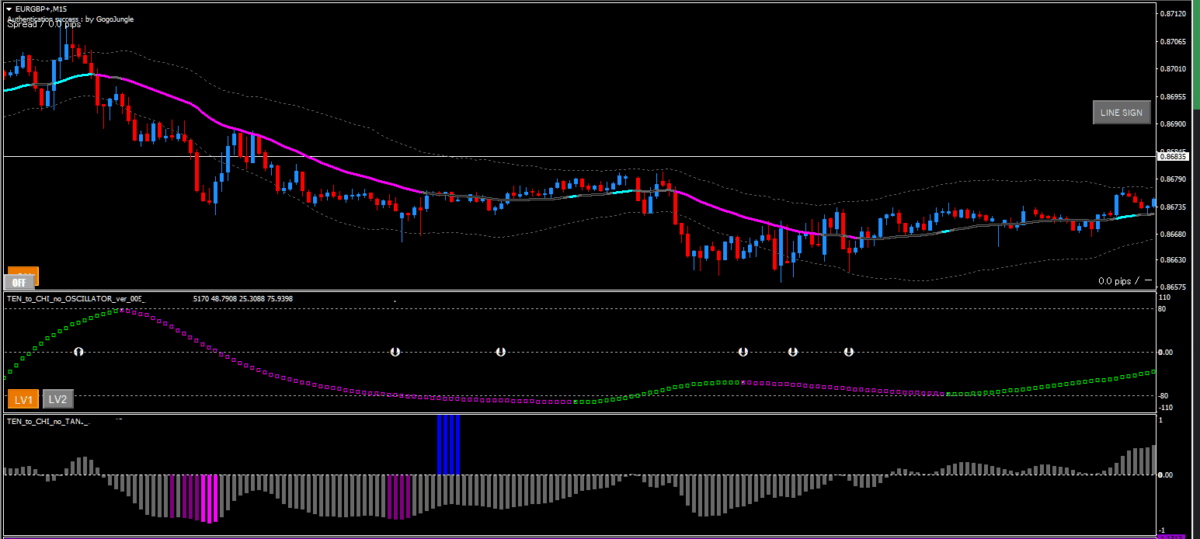
TF2 color change occurs in the middle, but it is smooth with a remaining valley and a line touch, which are favorable conditions.
- note that the next valley is approaching and
- TF2 has changed color, so at this timing
I would likely close the position early.
Probably just aiming for a few pips.
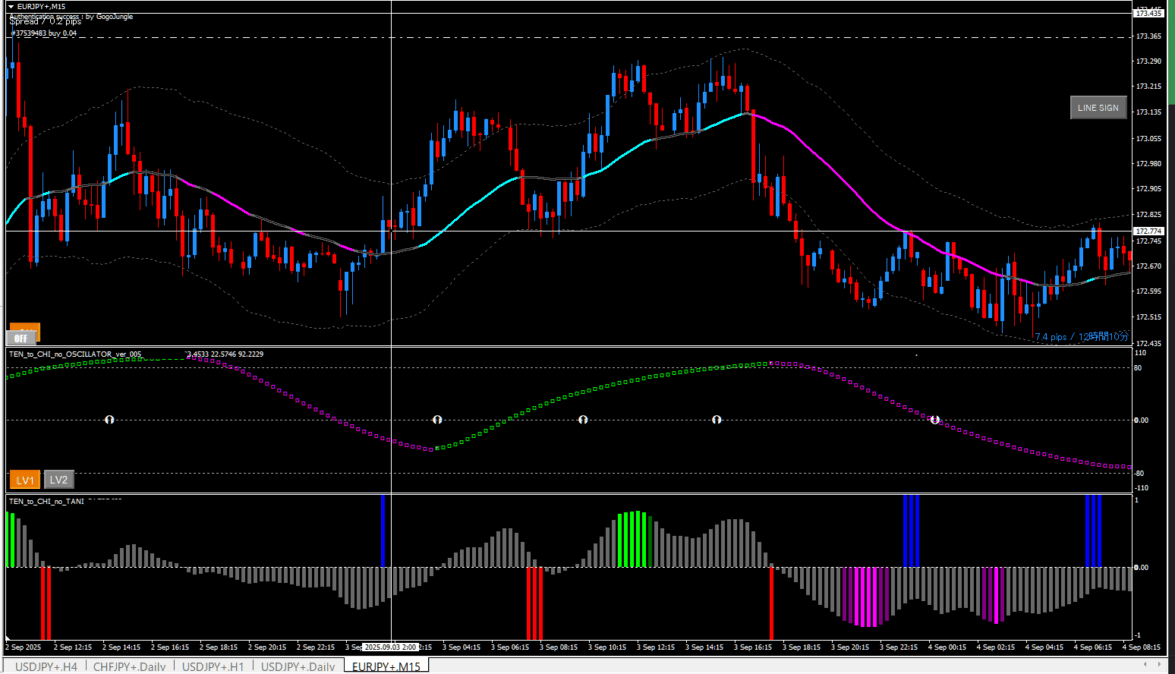
TF2 is somewhat strong but the pattern isn’t bad and the mountain remains.
Howeverit has not touched the lineyet.
Since the candle has already crossed the line with a solid stroke, caution is necessary.
TF2 is smooth and clean.
Although it hasn’t touched the line, it seems good to enter when it touches the line.
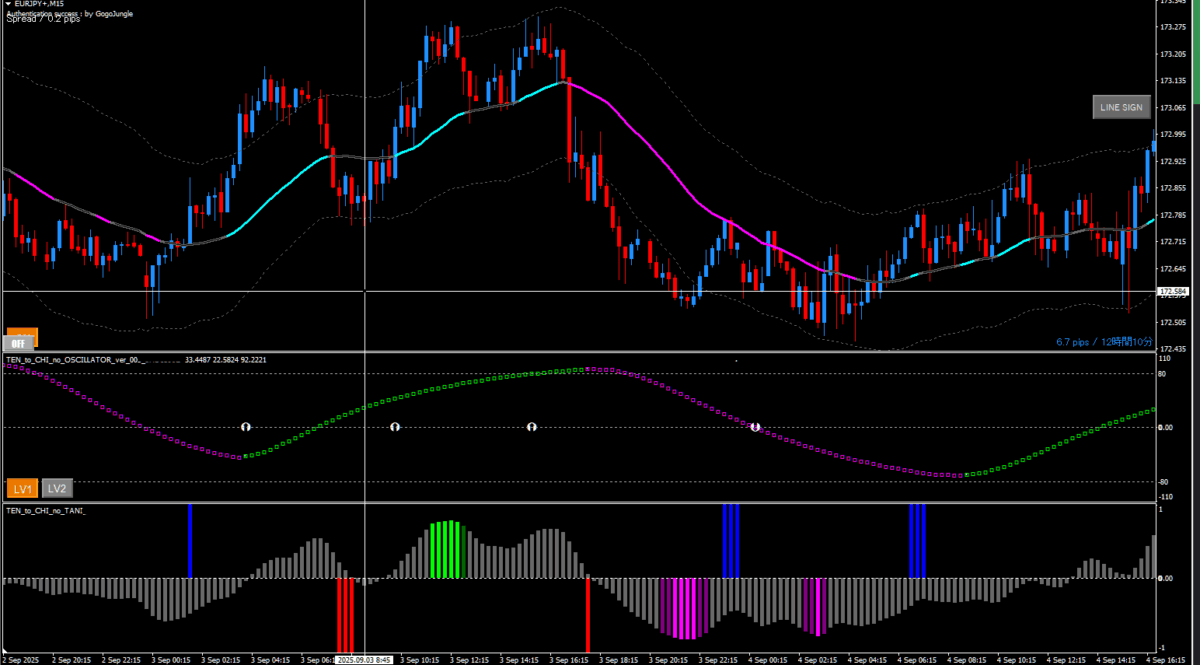
From the previous screen, the two central red valleys are still worth noting.
A valley appearing near the area where the mountain is fading is not a real valley
This article ends here.
There are about ten more charts left, so I will finish in Part III.