

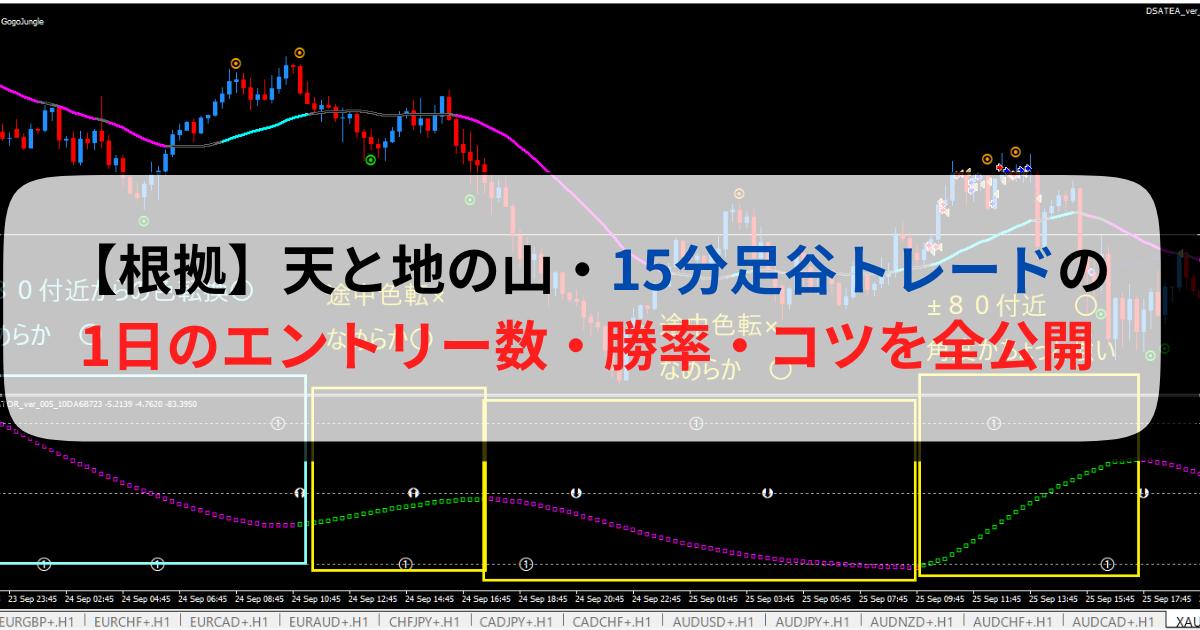
[Basis] All about the number of daily entries, win rate, and tips for the Heaven and Earth Mountain - 15-minute valley trades
It's Shirou!
Over several days, I have been doing 15-minute chart valley trades on the 天 and 地の山 (Ten to Chi no Yama).

How many entries per day?

What about win rate? Any tips?
For those curious, in this article I will share
the 15-minute valley trades
- Entry count
- Win rate
- Tips
About the method
First, I’ll share about the method.
The method is based on the OWARI method from the Ten to Chi no users.
- 15-minute trades
- Entries after valley formation against TF2
Since the Ten to Chi dashboard (standard version) can also signal valleys, I tried it with 29 currencies.
In addition, I set the most recent low to high to 1:1.
It is formed by selecting from the instruction manual.
In the actual manual, the technique adds Histogram DX (set to hourly when using 15 minutes) and enters when colors match.
【Basis】 Ten to Chi no Mountain・15-minute valley trade daily entry count・win rate・tips
First, regarding the number of entries, it varies by day, but
between 7:00 and 18:00,
- Signal about 12 times per day
- Actual entries about 4 times
I don’t stay glued to the chart all day; for example, from 13:00 to 15:00 there are times I cannot view the screen, which affects the count.
In the morning and from 16:00 to 18:00, it tends to light up well.
Even in short windows in the morning and 16:00–18:00, you can enter 5 or more times, and on some days more than that.
About win rate
The oscillator is very simple, which was a bit confusing at first, but
Initially,
about 60% to 65%
and then, after actually performing environment recognition with 4-hour candles and drawing horizontal lines, the entries decreased and the win rate rose to
about 70%
and it reached roughly.
Tips for valley trading
I'll share what I learned from actual trading.
First, as OWARI-san says, if TF2 conditions are good, the win rate is high.
TF2 is
- smooth (not very sloped)
- color change near around ±80
The features are explained with images.
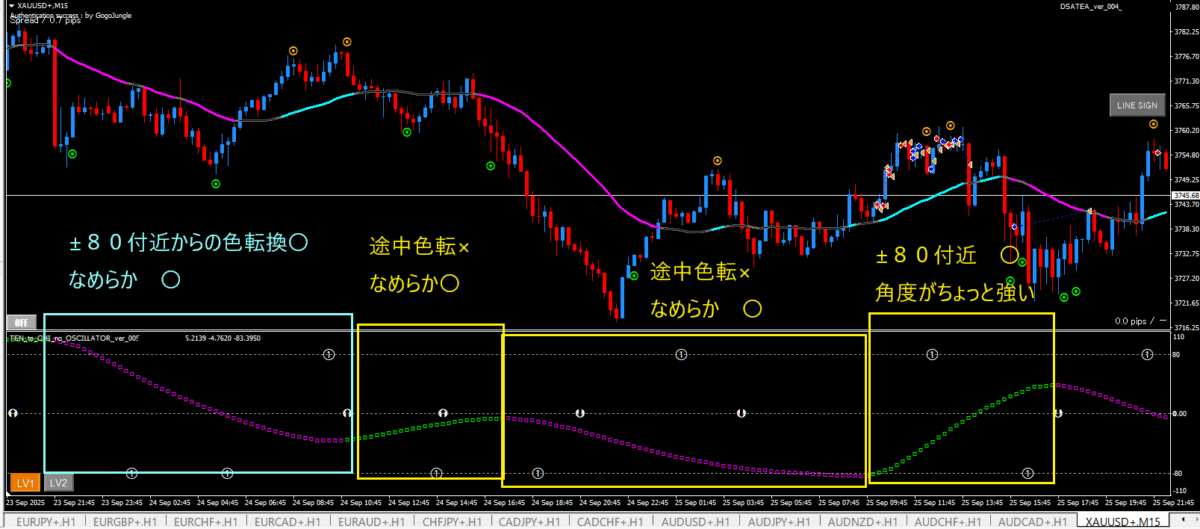
- Color change after some time → tends to range
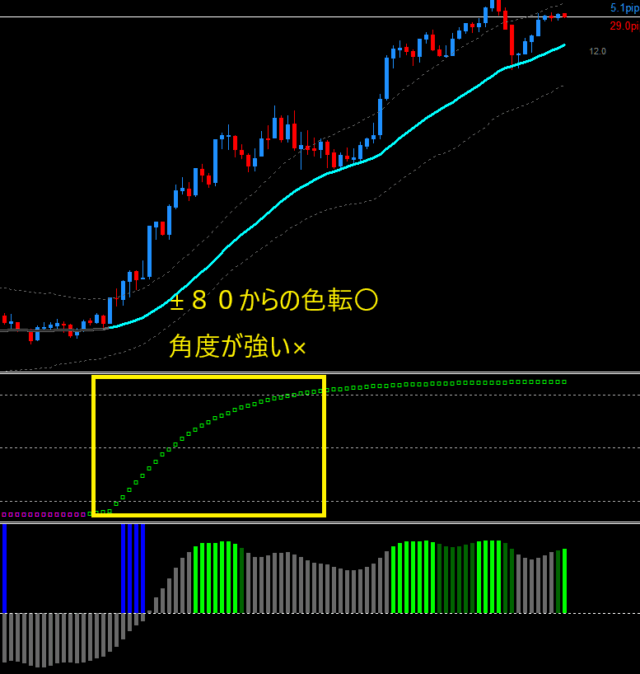
- Steeper angle → the trend is too strong
There are many cases.
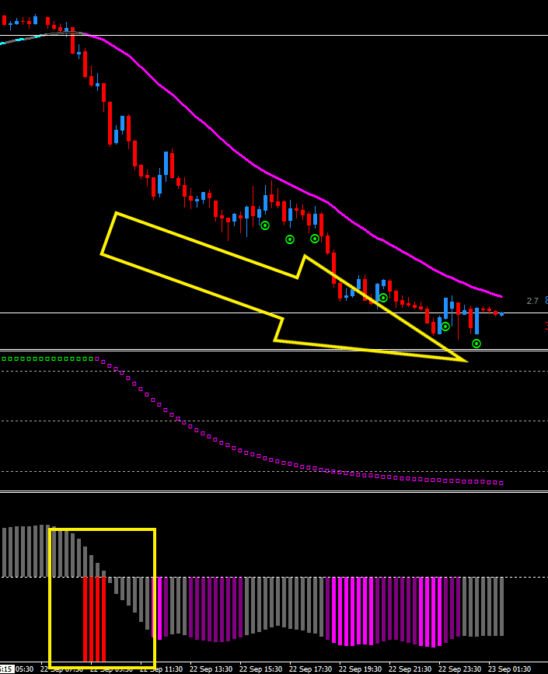
When the color change happens midway, it tends to become a range, so in my case I manually set TPSL.
And,I also include Oscillator DX settlements,so
in ranging markets, the entry price, stop loss, and small profits tend to occur
as a characteristic as well.
In areas with strong angles, there are cases where the trend is overextended (not all).
From that valley, if you tradeyou may already be in a scene where the trend has ended and a reversal occurswhich tends to become a stop-out.
Especially in areas with strong angles, be careful.
Personally, I think this method is perfect for beginners.
By intentionally turning off the oscillator colors, the chart becomes simpler.
The required charts are
- Ten to Chi dashboard
- 15-minute chart
- a chart for money management entries
so you can manage with a small number of charts.
In my case, I use one MT4 for the Ten to Chi dashboard and one MT4 for the 15-minute valley trades & money management entries.
Also, another tip isto check at valley formation whether the mountain has already ended.
If the mountain remains, it becomes a false valley, and it is likely to be a pullback buyback sell valley rather than a trend reversal false valley.This tends to become a stop-out.
There is also an article to determine whether it is fake or real, so feel free to refer to it.