

Utilization of the "Visualization Indicator" (Part 230)
The use of the "Visualization Indicator" (its230)
1. To further evolve the "28 Currency Pair List Indicator" into an indicator
“8CPVisualization Indicator”that drawsAUDJPY.
The “8CPVisualization Indicator” hasOceania version,London version,NewYork version,AnyCP version. This time, we used theOceania version.
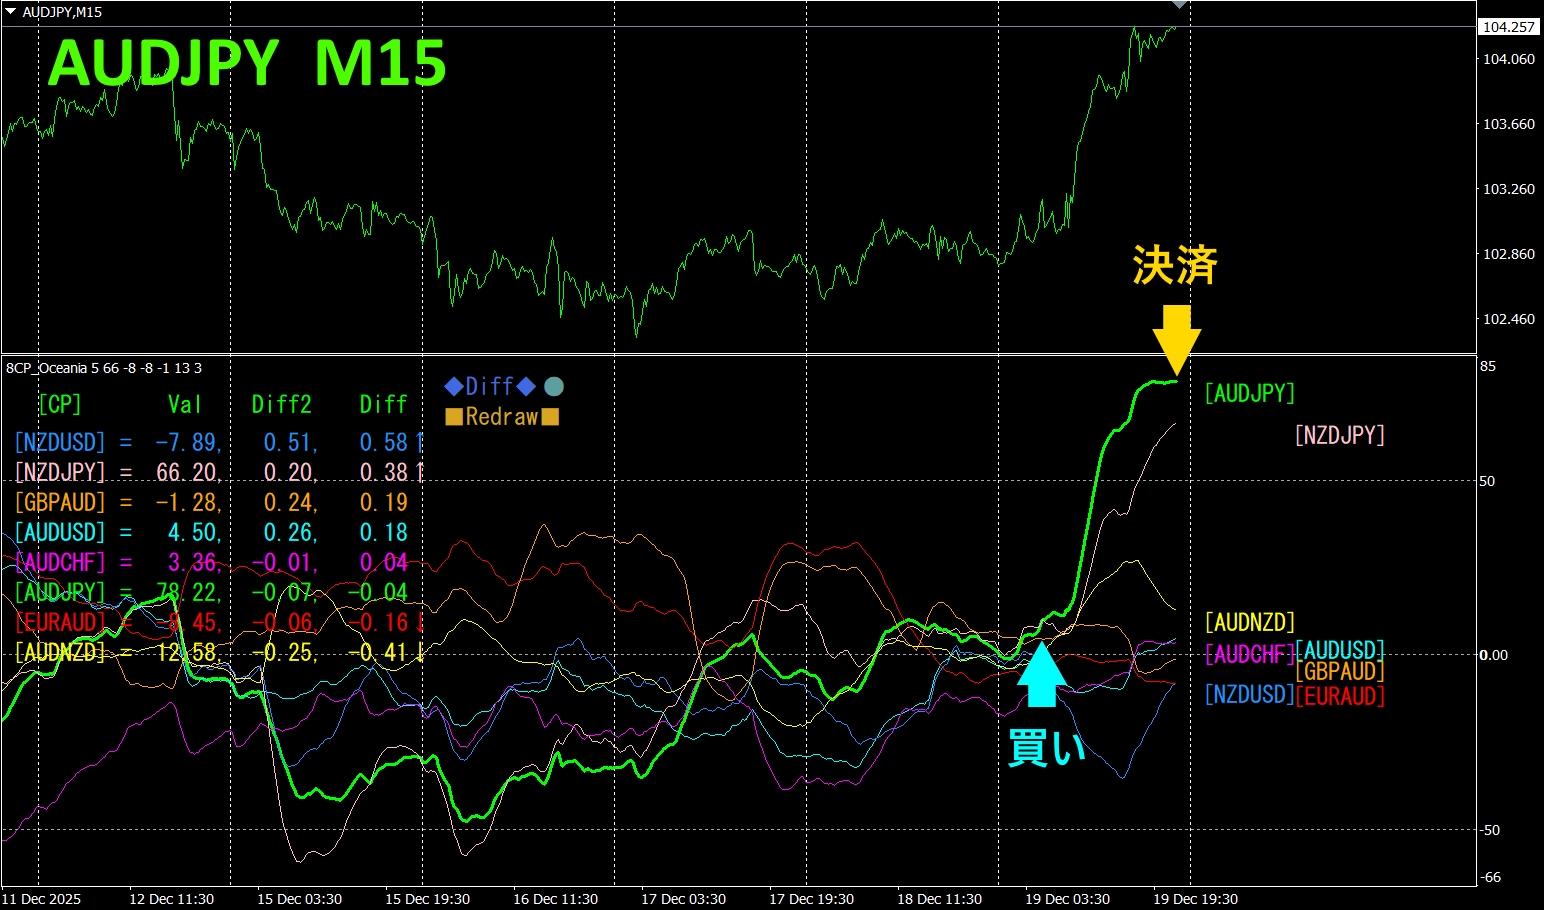
The upper half is a 15-minute chart ofAUDJPY. The lower half is from the “8CPVisualization Indicator”; the green thick line graph corresponds toAUDJPY.
On Friday, the AUDJPY chart rose above the others, so we entered a buy trade. It peaked later that night and was closed. Profit was about115 pips.
Currency Strength-Draught
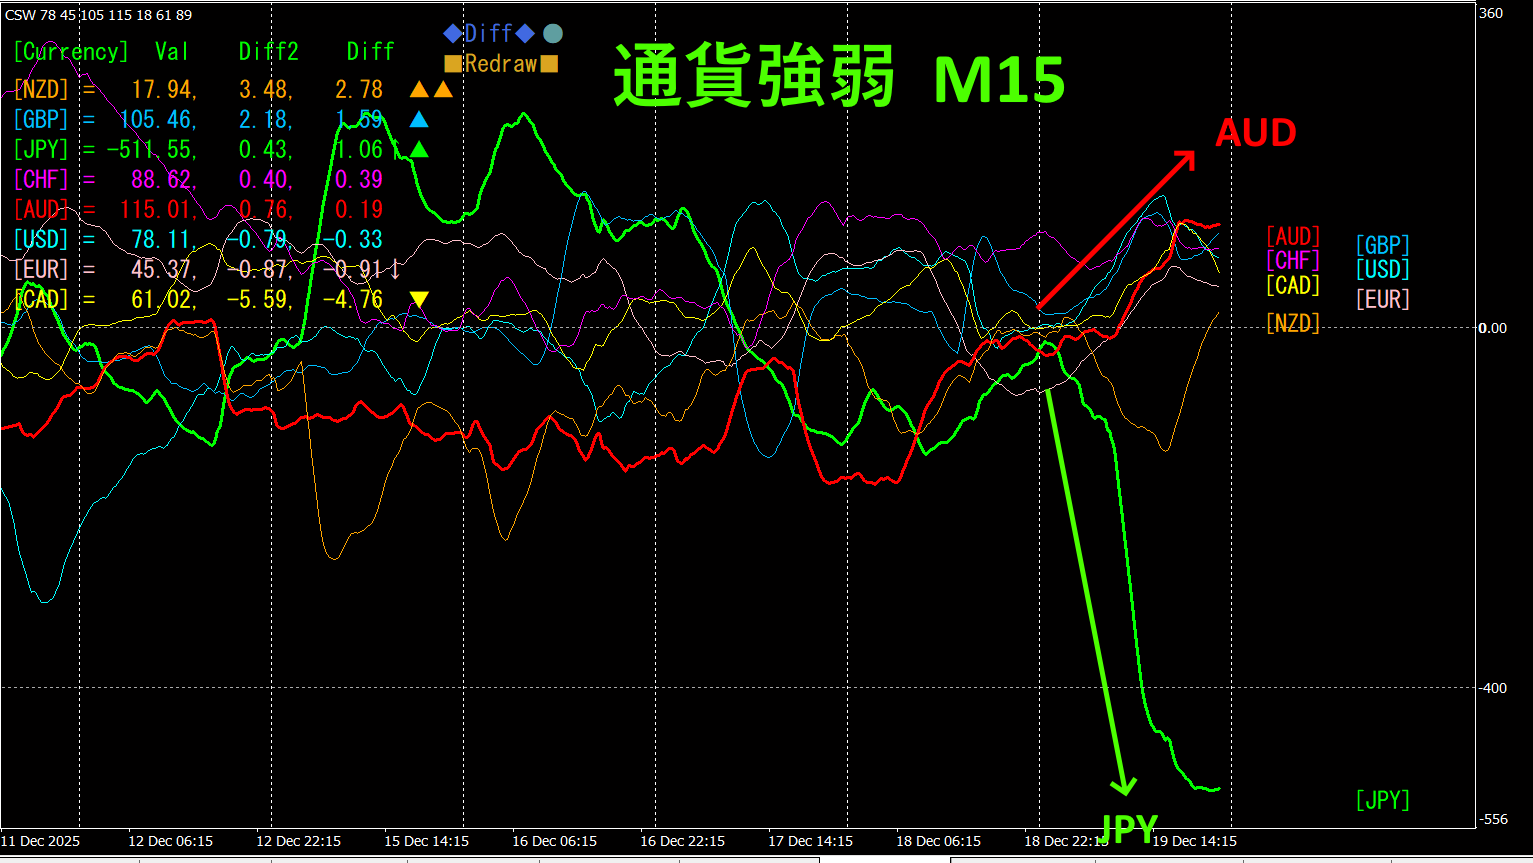
Looking at the 15-minute currency strength graph, onlyJPY is continuously weakening. This weakness ofJPY came after the news that the Bank of Japan would raise its policy rate by0.75% to its highest in 30 years. When rates rise, the yen weakens.
In the currency strength graph,AUD andJPY show a remarkable inverse correlation.AUD andJPY relation isAUDJPY>, so focus on the parts where AUD and JPY diverge, and trade by buyingADUJPY. It forms a clean inverse-correlation chart, so as the vectors ofAUD andJPY diverge, simply hold the position.
In FX, you should pick the currency pair that is currently rising the most and inversely correlated, and trade accordingly to see results.
“Aim for Currency Strength Inverse Correlation!”isFX's cardinal rule.
If you useTrendLine-EX, entries and exits can be automated by diagonal trendline breakouts. You can leave it as is, making trading easy. “TrendLine-EX” is a semi-automatic EA that can short automatically on a trendline break and automatically close on an upbreak.
2. Best SelectTry the indicator
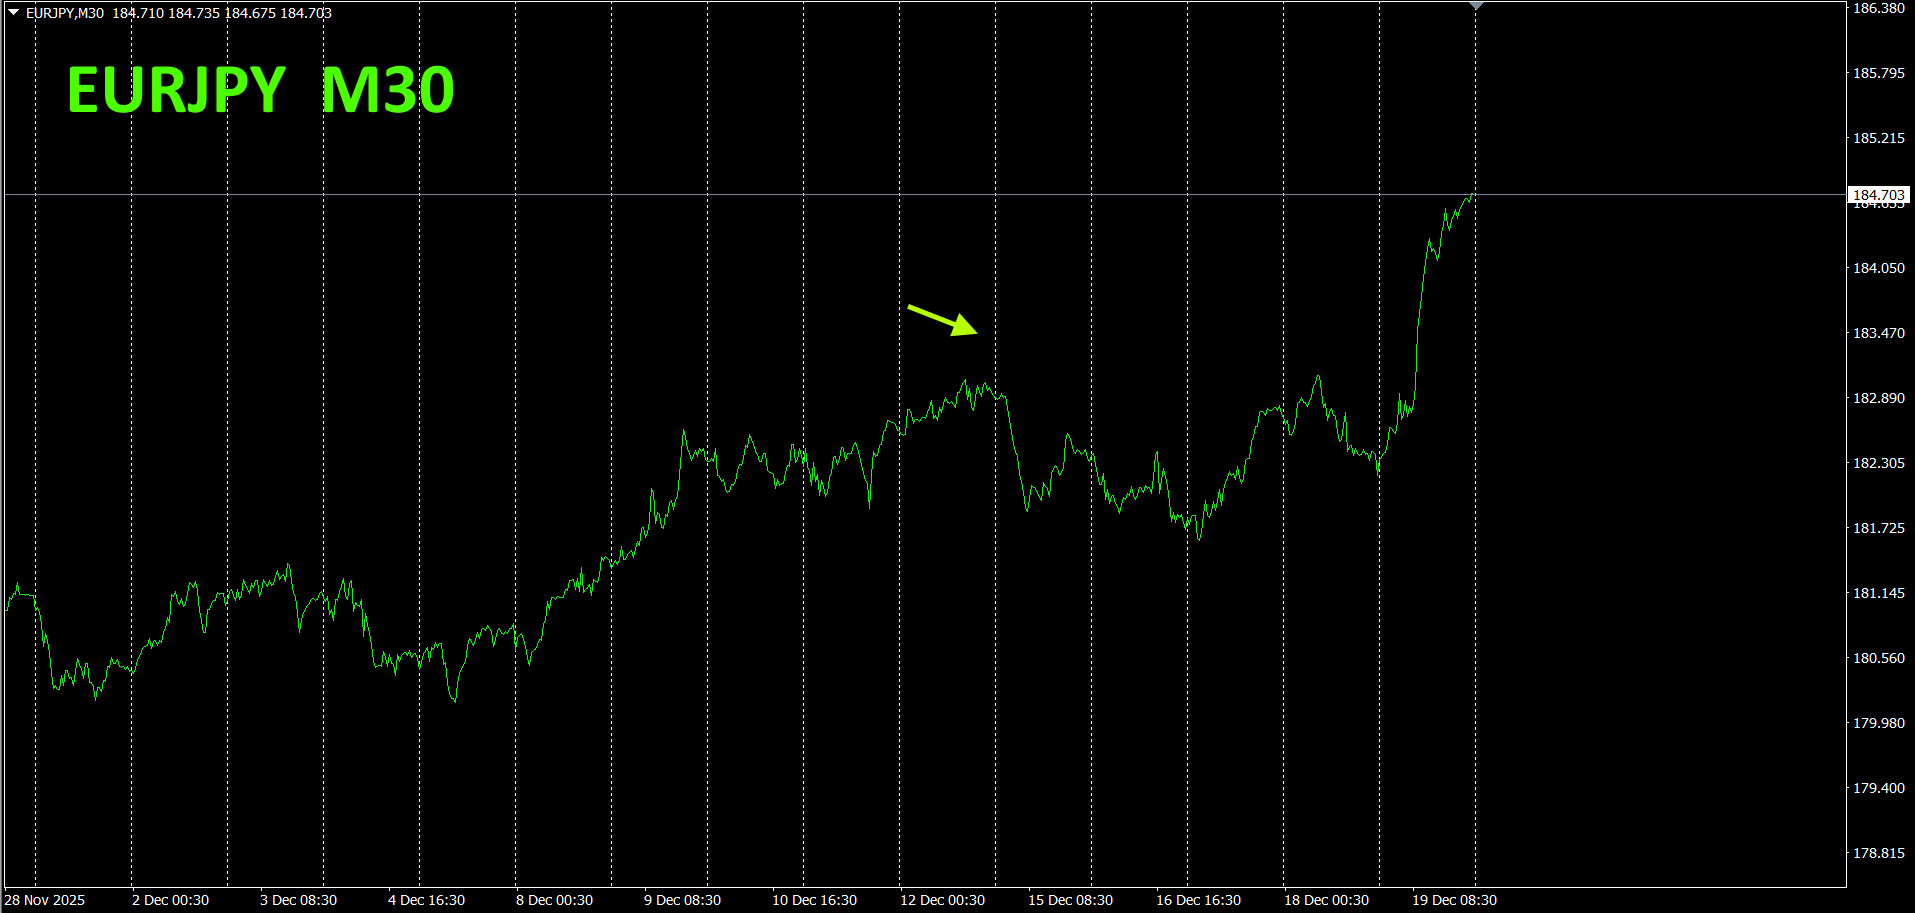
The figure below is a screenshot taken on2025 year12 month15 day 13:27 (JST)
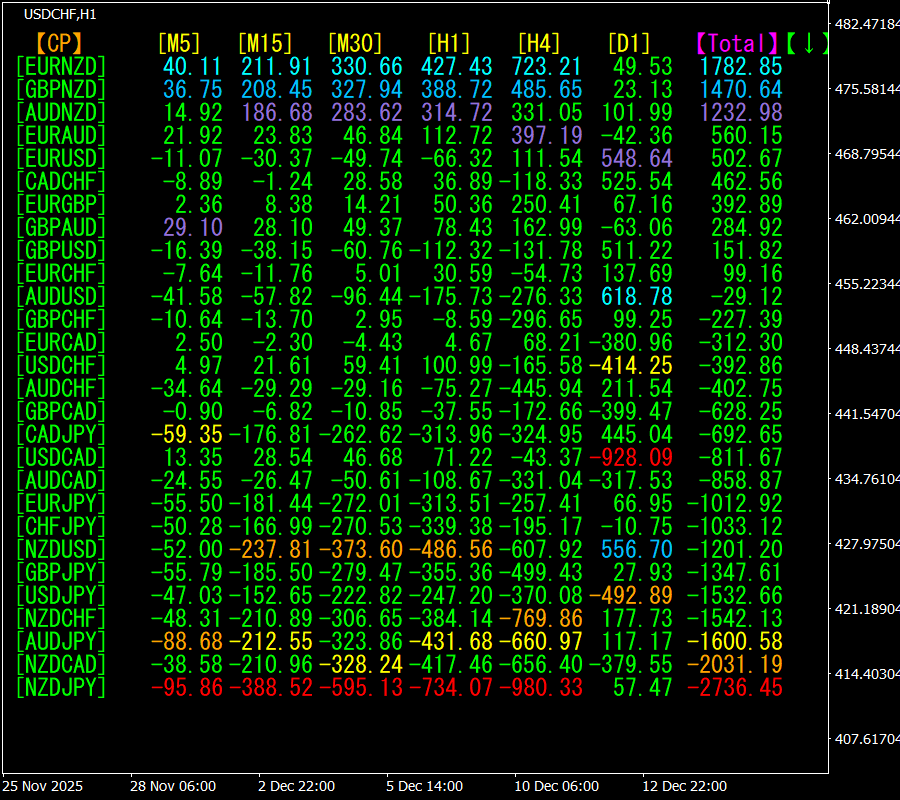
[Total]The numbers are sorted in descending order. The lowest entryNZDJPY shows red across all time frames except[D1. The Total value is, indicating a strong downtrend forNZDJPY.
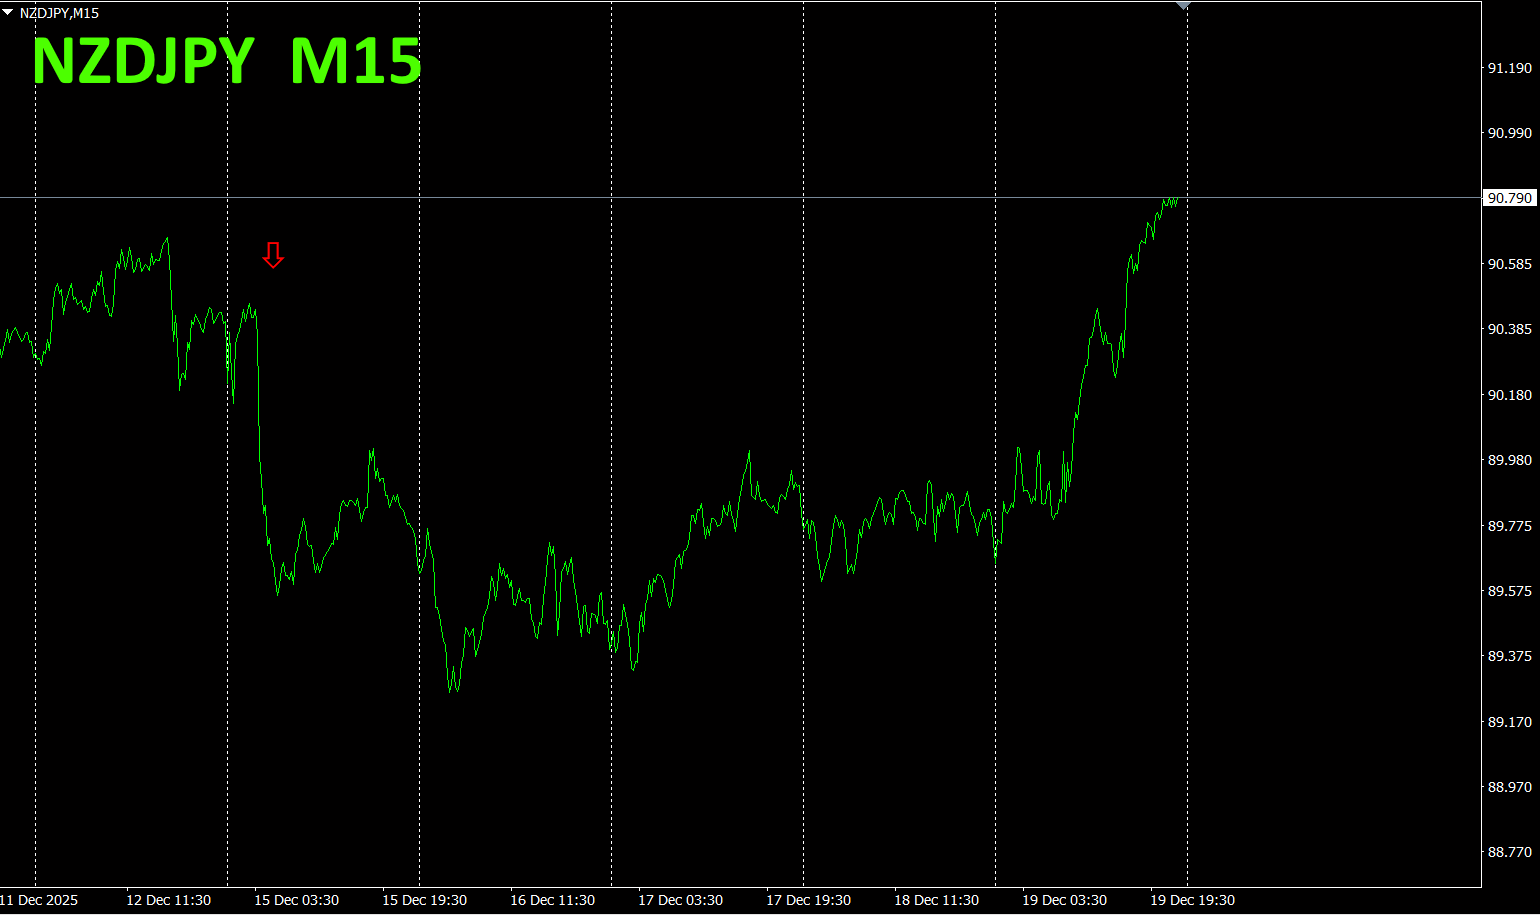
Now, let's look at the chart ofNZDJPY.
The red arrow marks the screenshot location. It captures the declining portion.
“28 currency pairsBest Select
“28 currency pairsBest Select indicator”

https://www.gogojungle.co.jp/tools/indicators/35128
3. 2021 year5 month sinceEURJPYup to now, what happened?
We have been tracking EURJPY since year5 month, movement.
To view the overall trend, we are displaying roughly the last30 minutes of the3 weeks on a 30-minute chart.
Last time I wrote the following.
Pink isEUR, green isJPY.EUR andJPY graphs move horizontally. The vectors point slightly downward forEUR and slightly upward forJPY, so it is expected to move slightly downward in the future.
As predicted, it turned slightly downward and then rose thereafter.
This is a 30-minute currency strength chart.
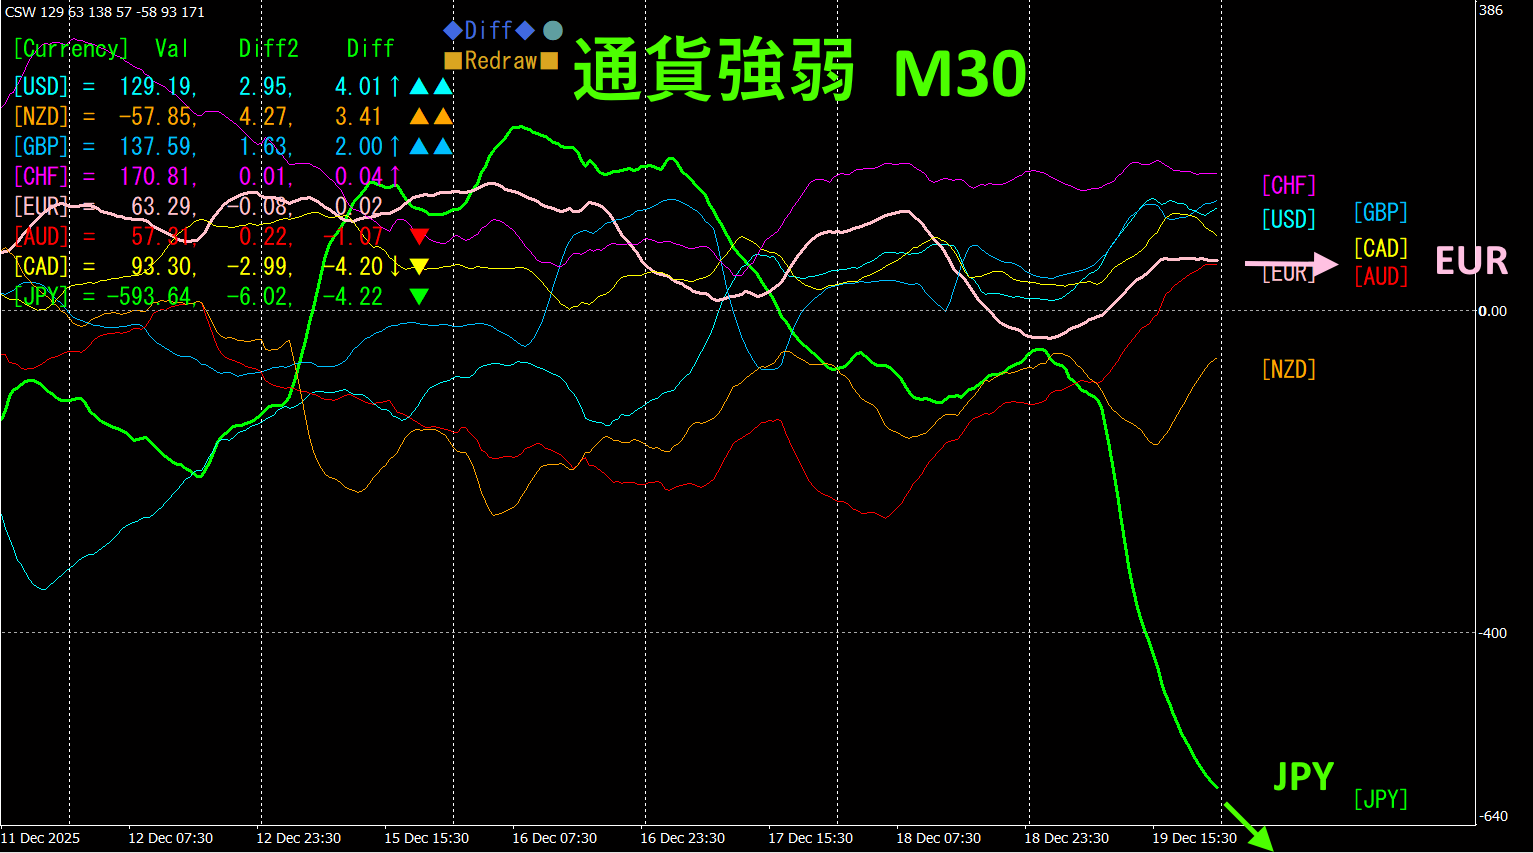
Pink isEUR, green isJPY.EUR moves horizontally,JPY drops sharply.JPY is too weak, so EURJPY is expected to continue an upward trend.
4.New IndicatorDual_MACD_Trend_Indicator to trying
New indicator “Dual_MACD_Trend_Indicator” see below.
MT4 version:https://www.gogojungle.co.jp/tools/indicators/62199
https://www.gogojungle.co.jp/tools/indicators/62202
It is an indicator that clearly shows the direction of the trend with color. If the color bars are Lime, it is a buy; if Red, it is a sell. It is easy for beginners to use. If the bars are green, there is an uptrend; if red, a downtrend; if no color, there is no trend. Because it is color-coded, you can grasp the trend at a glance.
I tried introducing this indicator toAUDJPY on the1 hour chart.
The red sell zone and the green buy zone are clearly separated, making trading easy at a glance. Focus on the circled areas for trades. If you use theDual_MACD_Trend_Indicator, you can trade only where the trend is strongest.
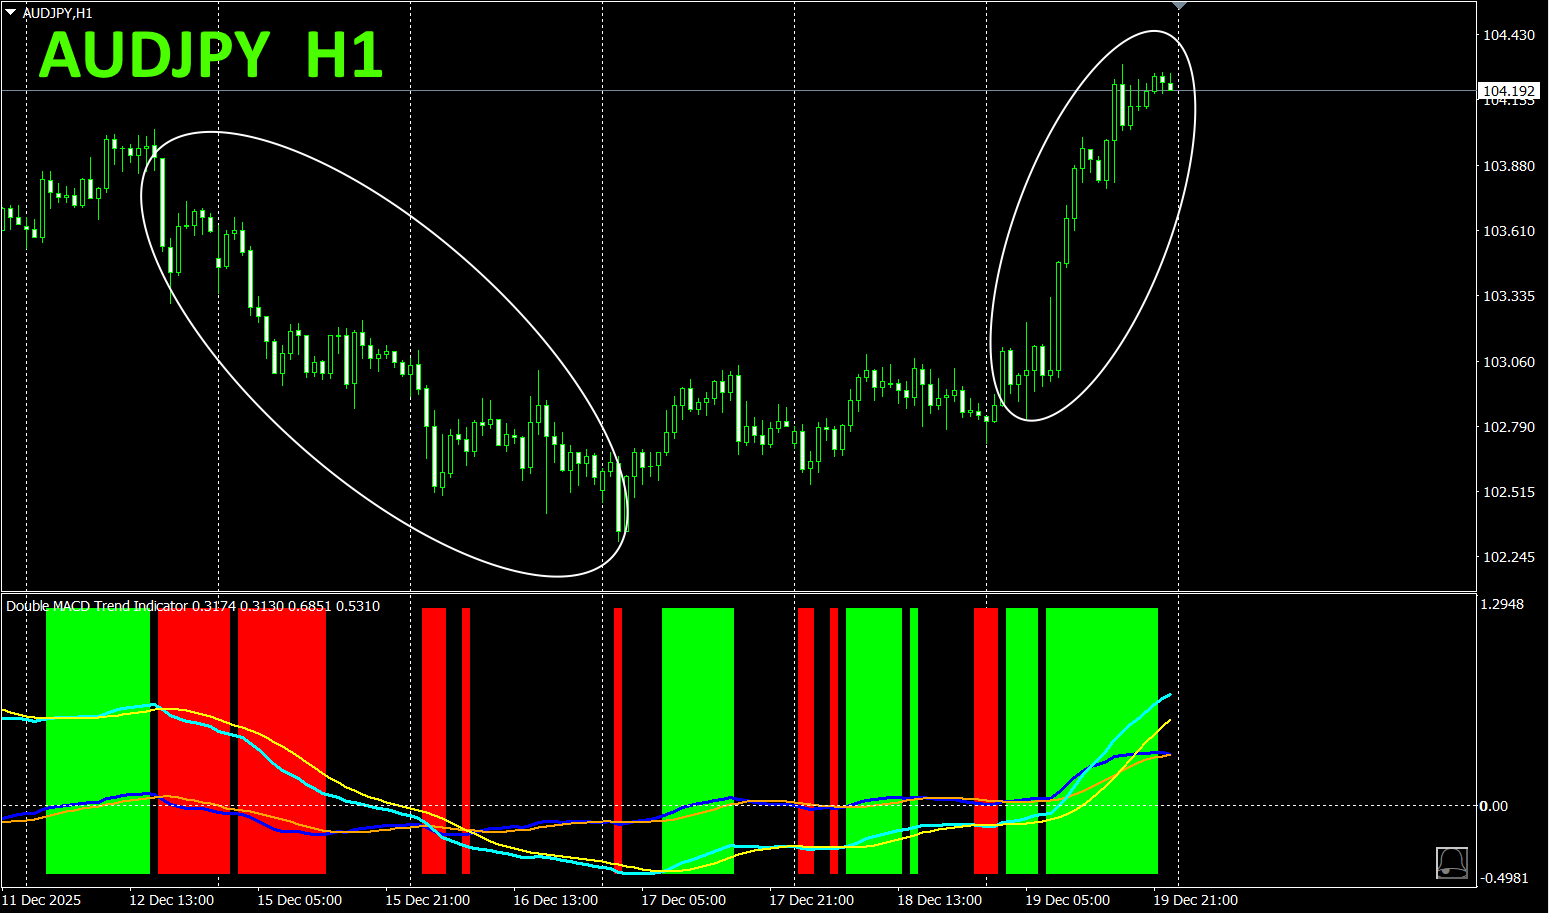
With theDual_MACD_Trend_Indicator, buy in the green zones and sell in the red zones; do not trade otherwise.
Using theDual_MACD_Trend_Indicator eliminates any doubt about trade direction.
5.
“Hyper-CSW” has been released
“Hyper-CSW” is a high-performance indicator that visually presents the strength of the eight major currencies at a glance. It records, for the current timeframe, the strongest currency among the past ten bars and its score, enabling accurate detection of trends' persistence and turning points. Furthermore, it supports multi-timeframe analysis with currency strength rankings for multiple timeframes (top four currencies) across M15, H1, H4, D1, and W1, displayed with scores. Its highly legible color lines and separate window display empower you to gauge market momentum effectively.
For details, please see the following link.
https://www.gogojungle.co.jp/tools/indicators/65082
※ Recommended indicators
“8CFD Visualization IndicatorAny version”
https://www.gogojungle.co.jp/tools/indicators/32288
“Toretore Indicator”
https://www.gogojungle.co.jp/tools/indicators/50115
“TrendLine-EX”

https://www.gogojungle.co.jp/tools/indicators/42257
“8C currency strength visualization indicator
MT4 version https://www.gogojungle.co.jp/tools/indicators/39150
version https://www.gogojungle.co.jp/tools/indicators/39159
【My listed items】


