2025/12/20 Dollar/Yen, Gold, SP500, and Nikkei 225 environment

『Trendline Pro 2』✖『Dowsing Break Edge 9』
‘Dowsing Break Edge’ has increased the Dowsing (Dow Theory Zigzag) from 5 to 9 this week.
Since there were opinions that a value of 5 was heavy, we have stopped aggregating scores from 1 to 5,
and now display the edge (boundary) of the break from 1 to 9 as is.
By default, only the most recent one of the 1–9 breaks is shown.
You can easily switch it with button operations.
▲Light Blueis an upper break (darkLight Blueis a reverse-triangle break)
▼Pinkis a lower break (darkPinkis a reverse-triangle break)
■ Triangle consolidation (on the chart, small white circles appear)
In the image below, ‘Trendline Pro 2’ is also displayed on the chart.
Dollar/Yen
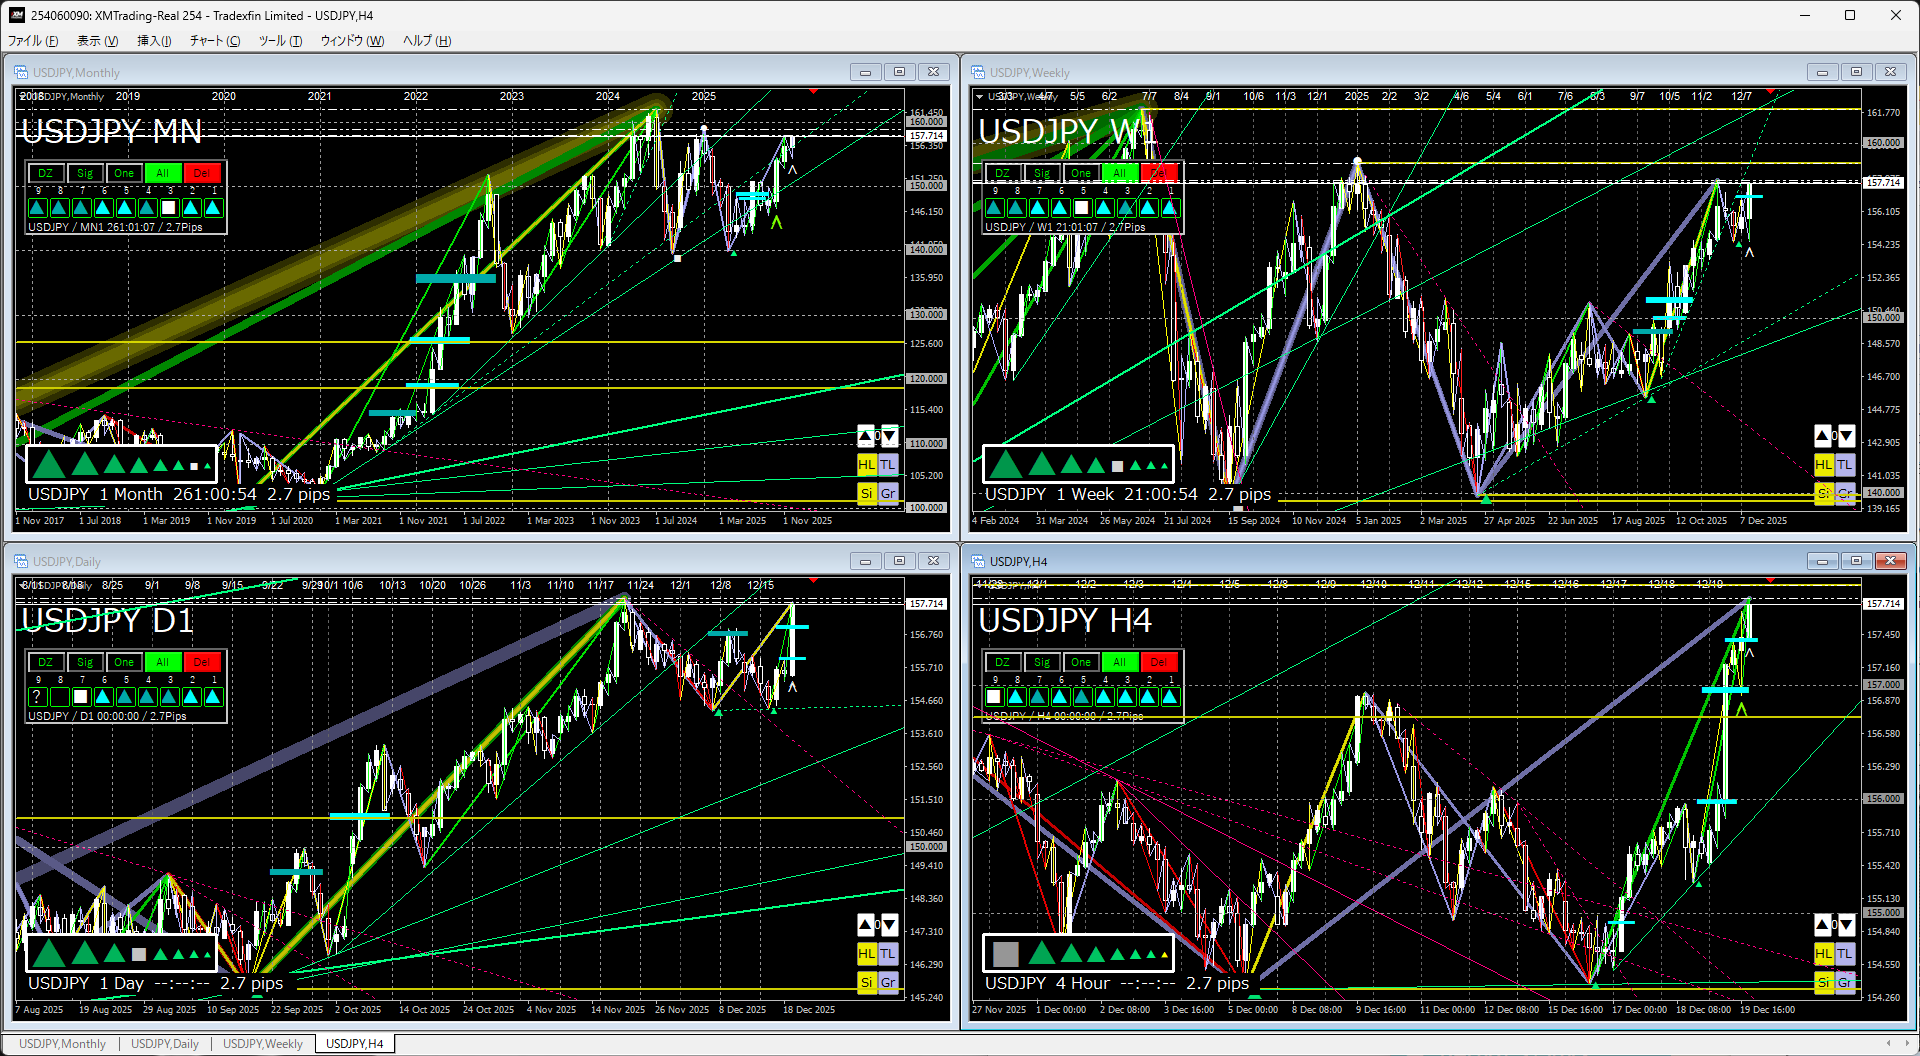
Monthly & Weeklylook, a failure of the lower break and a test upward, but currently still within the triangle consolidation range.
Since the price has been making higher lows, if it breaks the latest high upward and the triangle is broken, the long-term yen depreciation trend will strengthen rapidly.
Daily & 4-hourlook, already in an upward break and have reached the recent high.
Next week, it is expected to test the higher price levels, so it seems necessary to determine whether momentum increases or moves sideways.
Gold
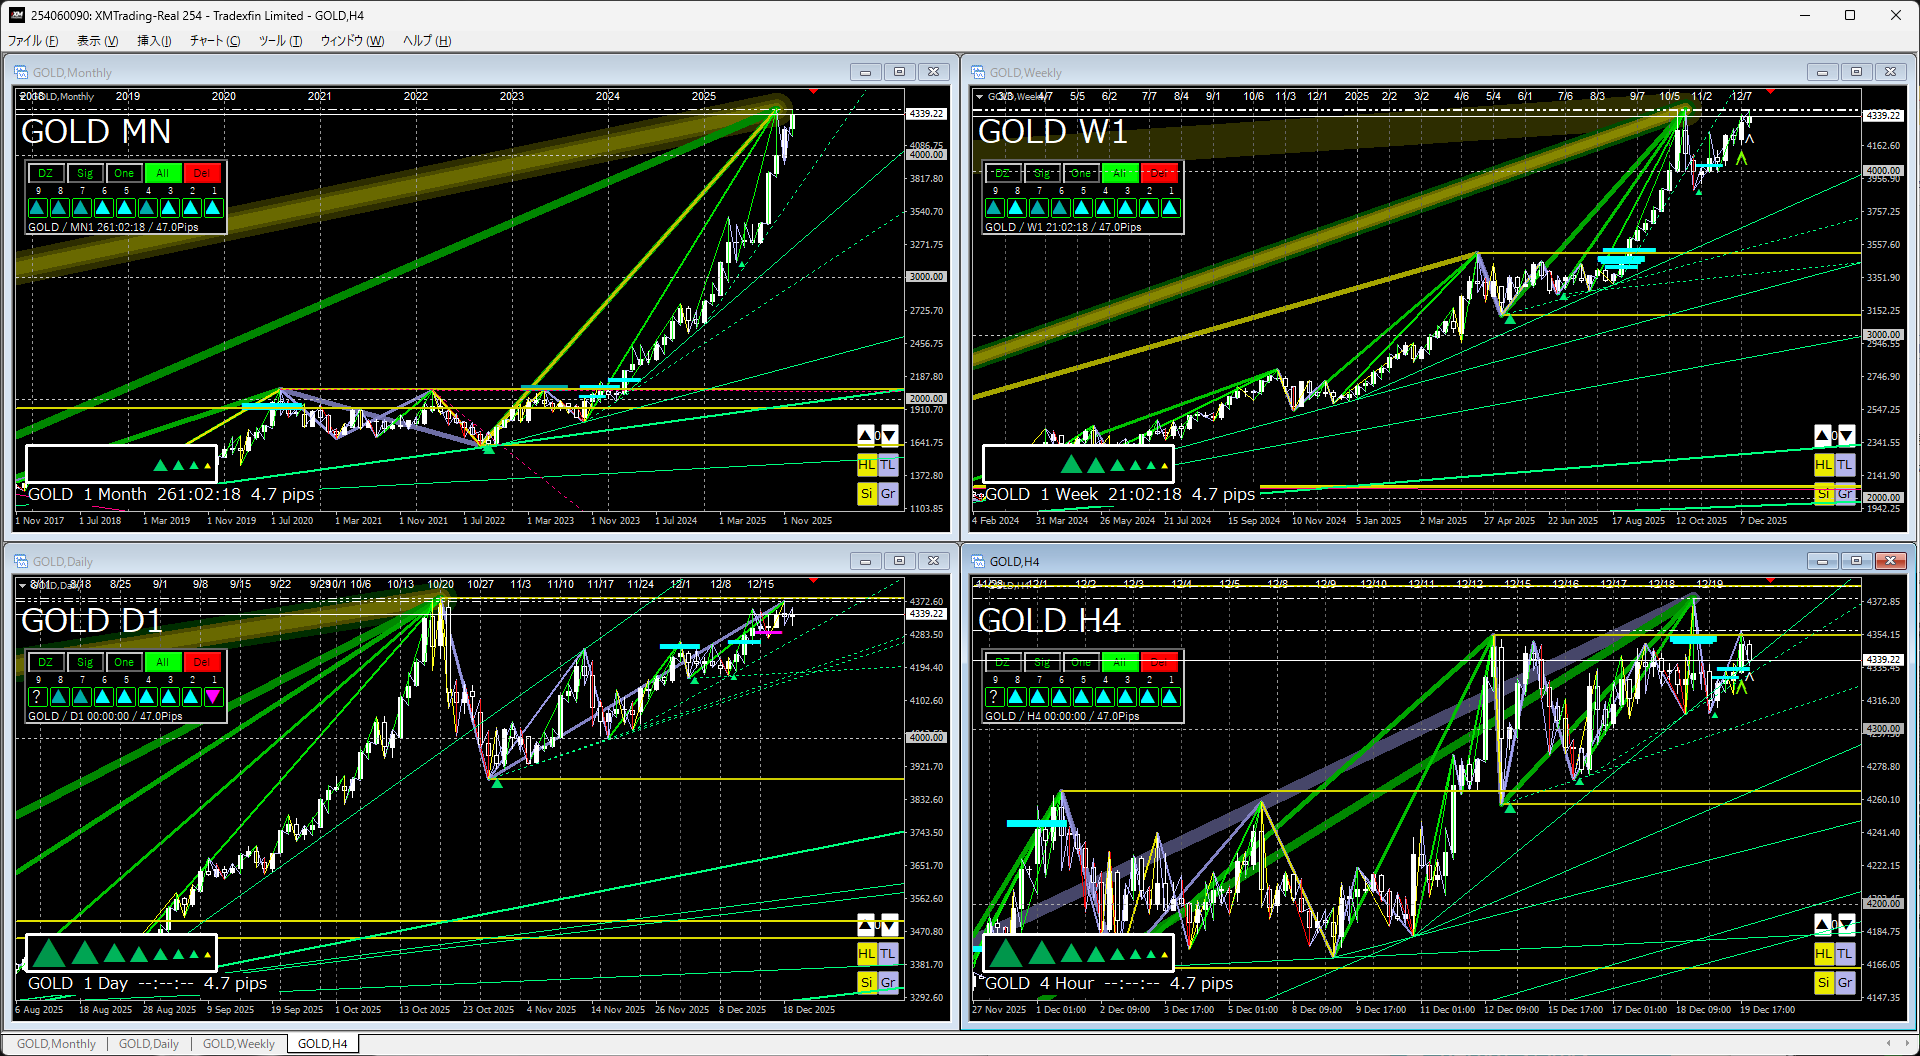
Gold remains a clear buy thesis.
Since there are no sellers, a stance of buying on significant declines (waiting) may not be appropriate.
That said, it is unlikely to break out to higher highs imminently, and a period of price action adjustment is expected.
On a daily basis, it would be good to buy if it falls to the support or trendline.
S&P 500
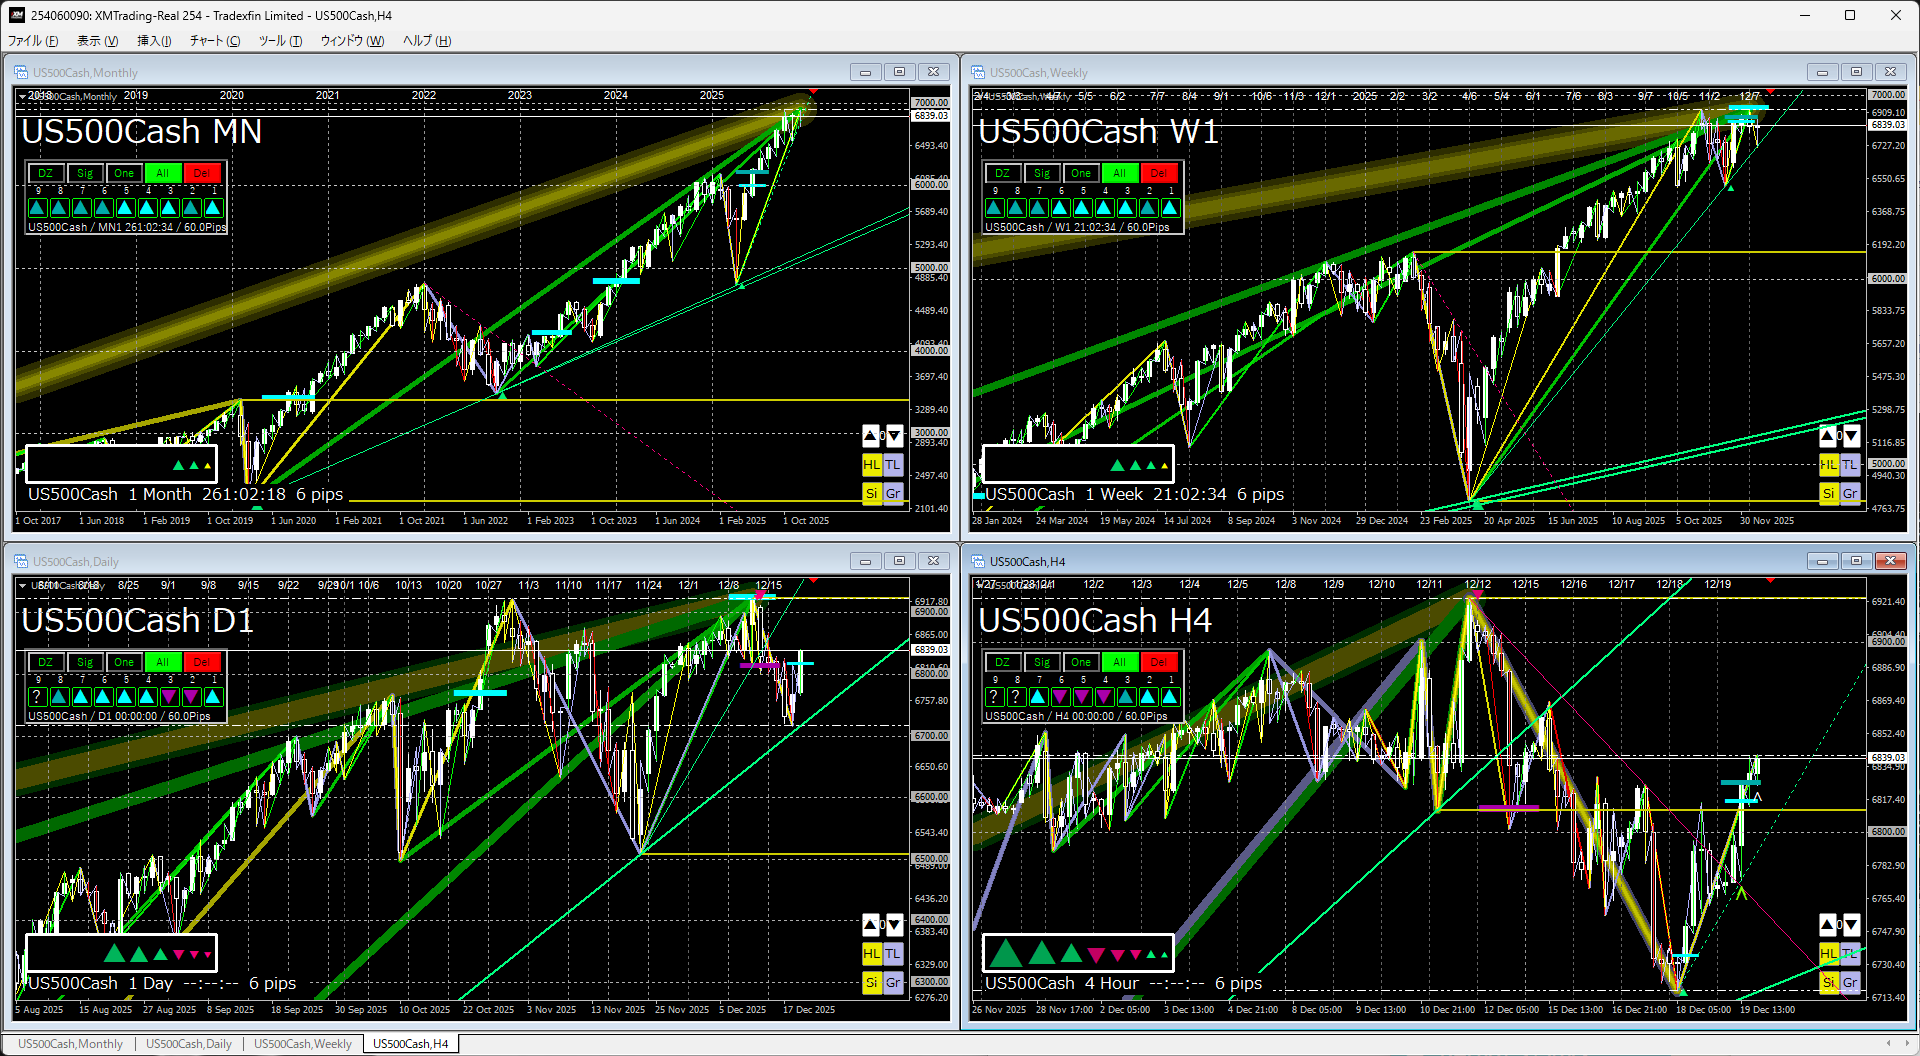
Monthly & Weeklylook, after a bounce from the trendline, it continues to rise.
Although there was a temporary lower break recently, the environment shifted back to an upper break.
Daily & 4-hourlook, supported by the trendline, just recently at a turning point to test upward.
As long as the trendline is not broken downward, I expect a continued attempt to set new highs.
Nikkei 225
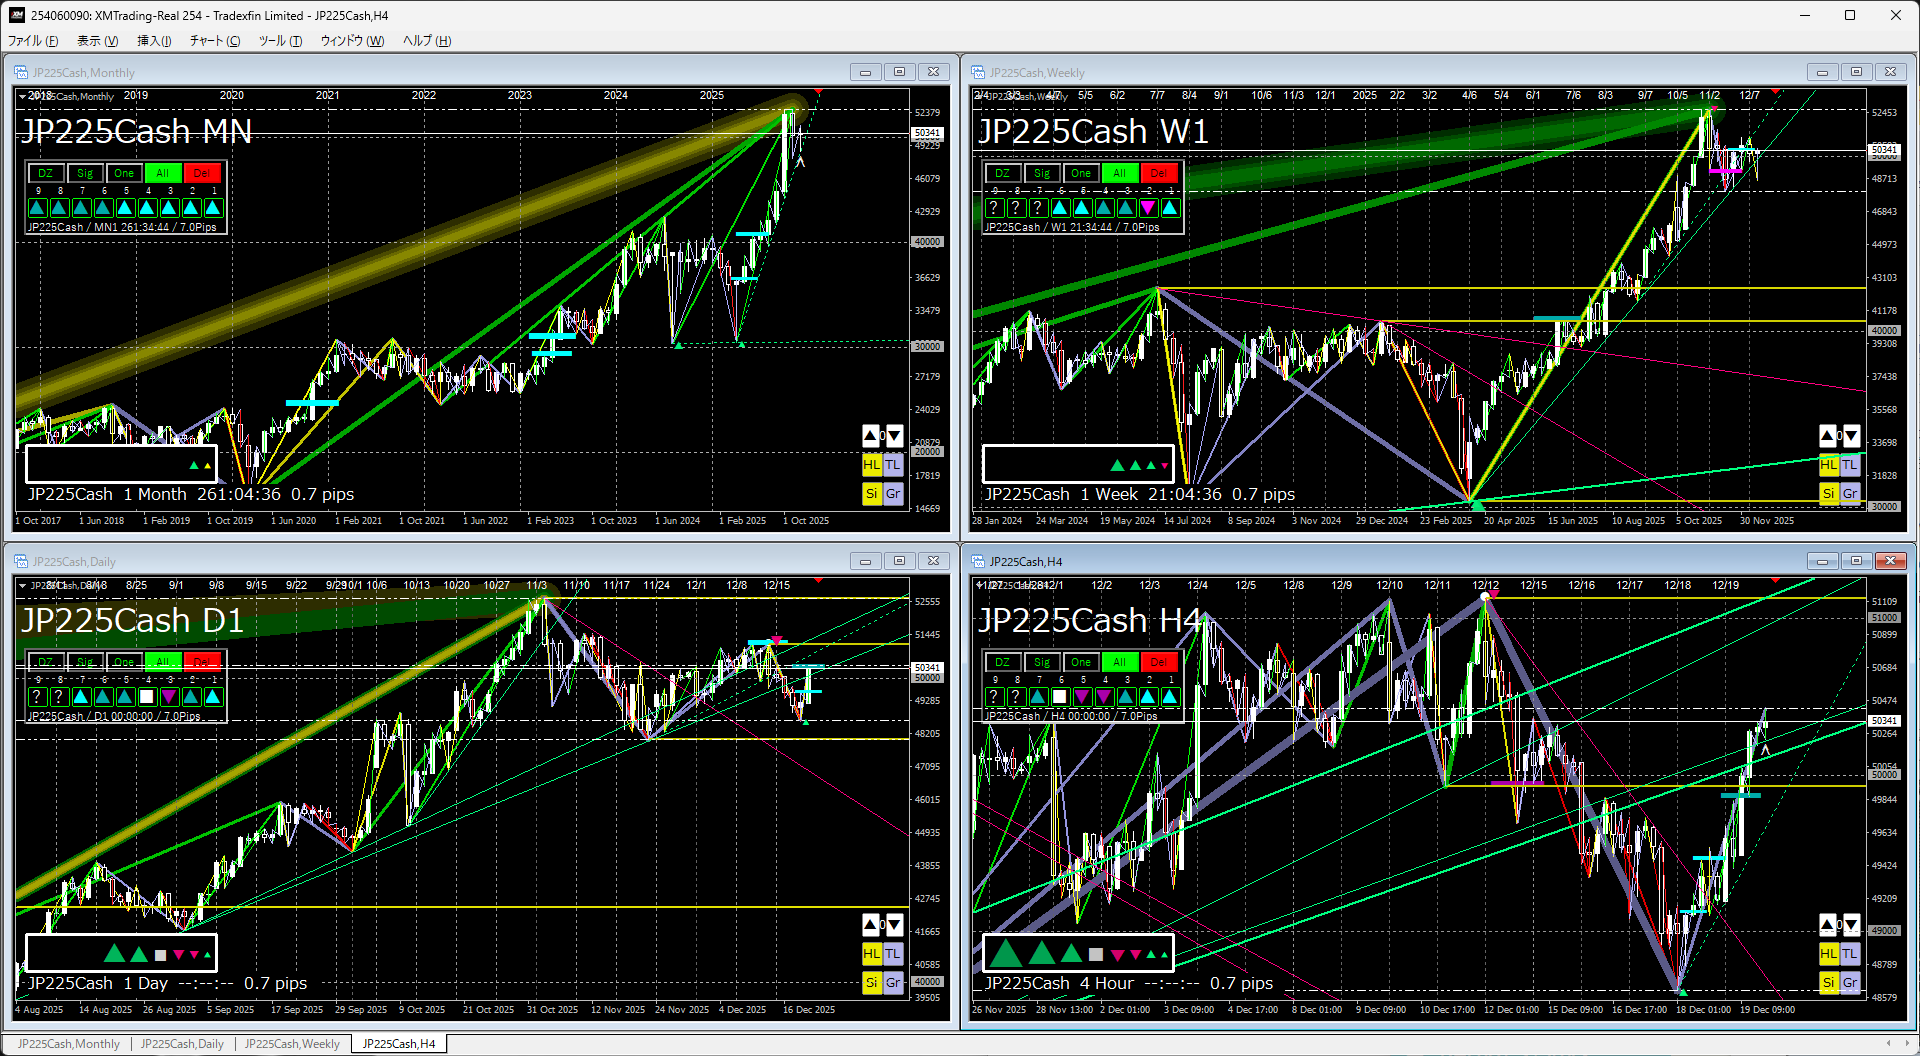
Monthly & Weeklylook, rising sharply from a double bottom with an upward breakout.
Recently there was a lower break, and the trendline also appears to have broken to the downside.
Daily & 4-hourlook, a lower break of the trendline has formed a triangle consolidation.
Basically, one should buy, but it seems fine to wait and see which direction the triangle will break.
The indicators in the attached image use the following two indicators.
If you’re interested, please have a look.
『Trendline Pro 2』✖『Dowsing Break Edge 9』
The following text is blank.
If you would like to continue viewing this article, please press the button.