

【December 14, 2025】Sky and Earth Series 3 Types × Chart Verification (Gold)
This time, Gold (GOLD) chart verification will be conducted. For environmental recognition, we will mainly explain Daysigning charts, and for entry triggers Prime Combo Signals.
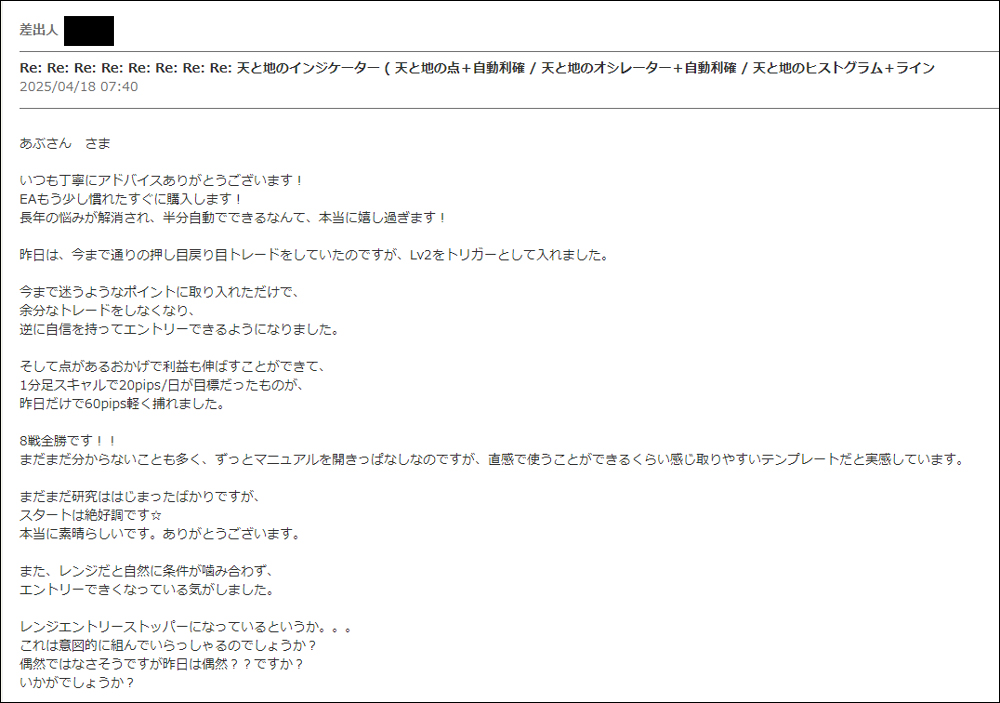
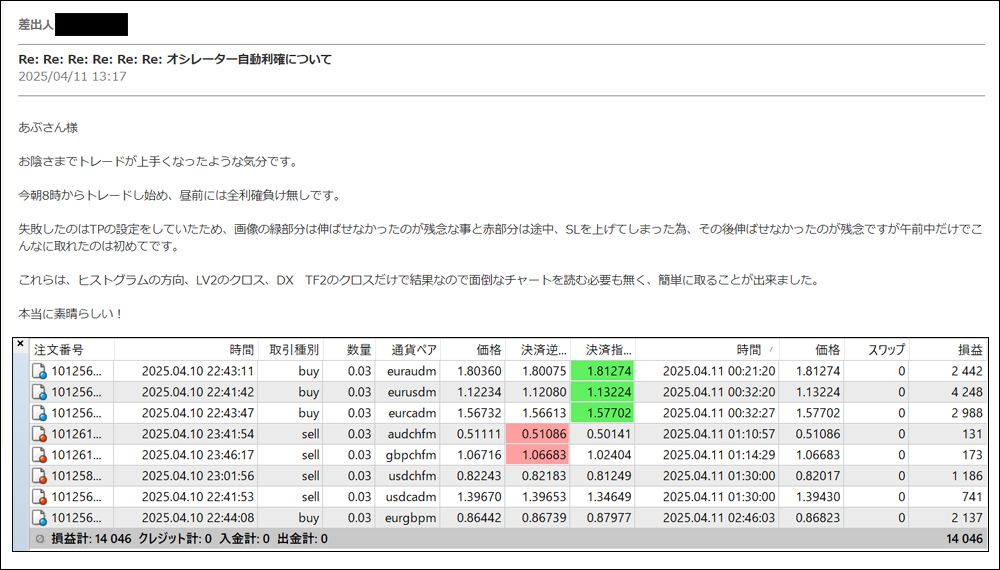
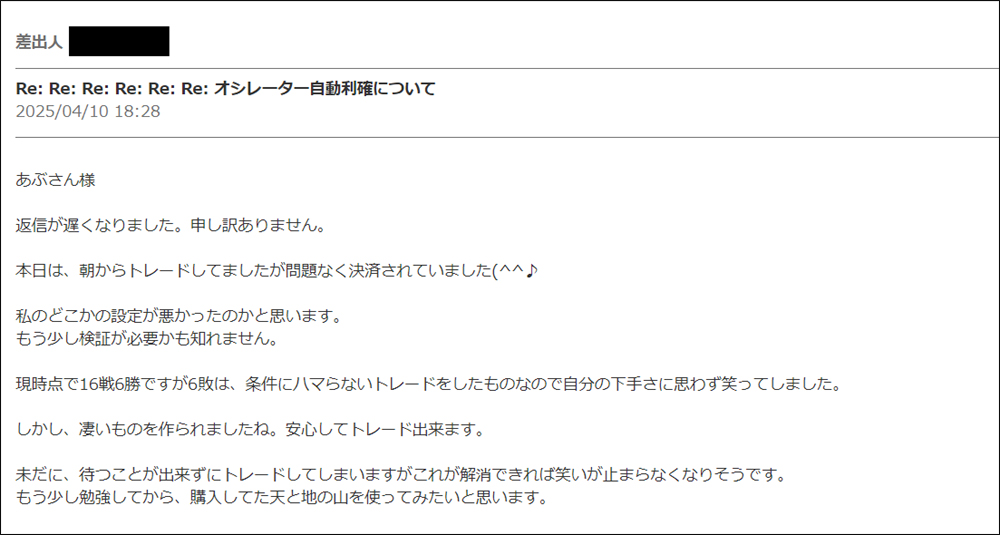
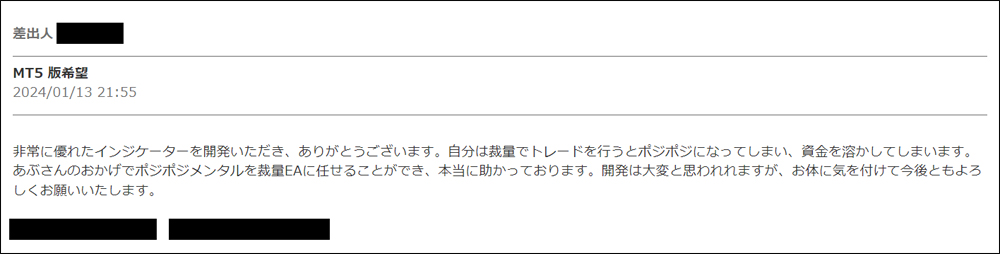
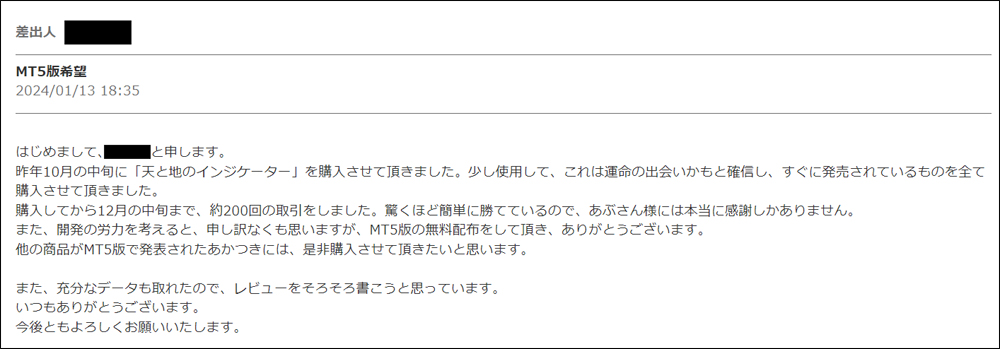
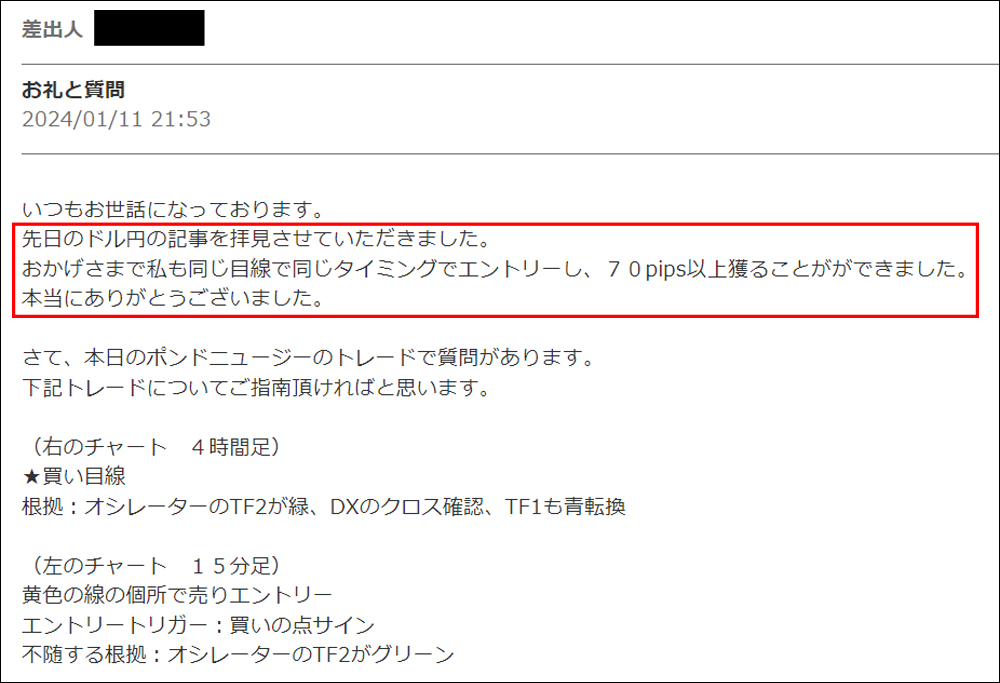
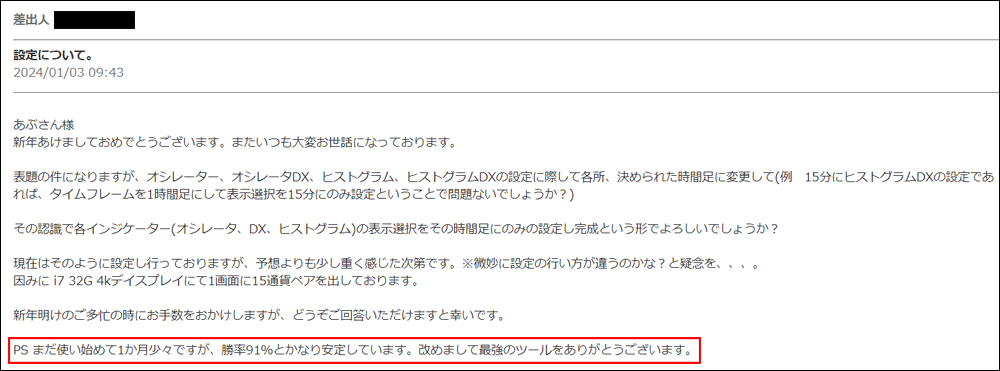
・Voices of people who actually used Prime Combo Signals
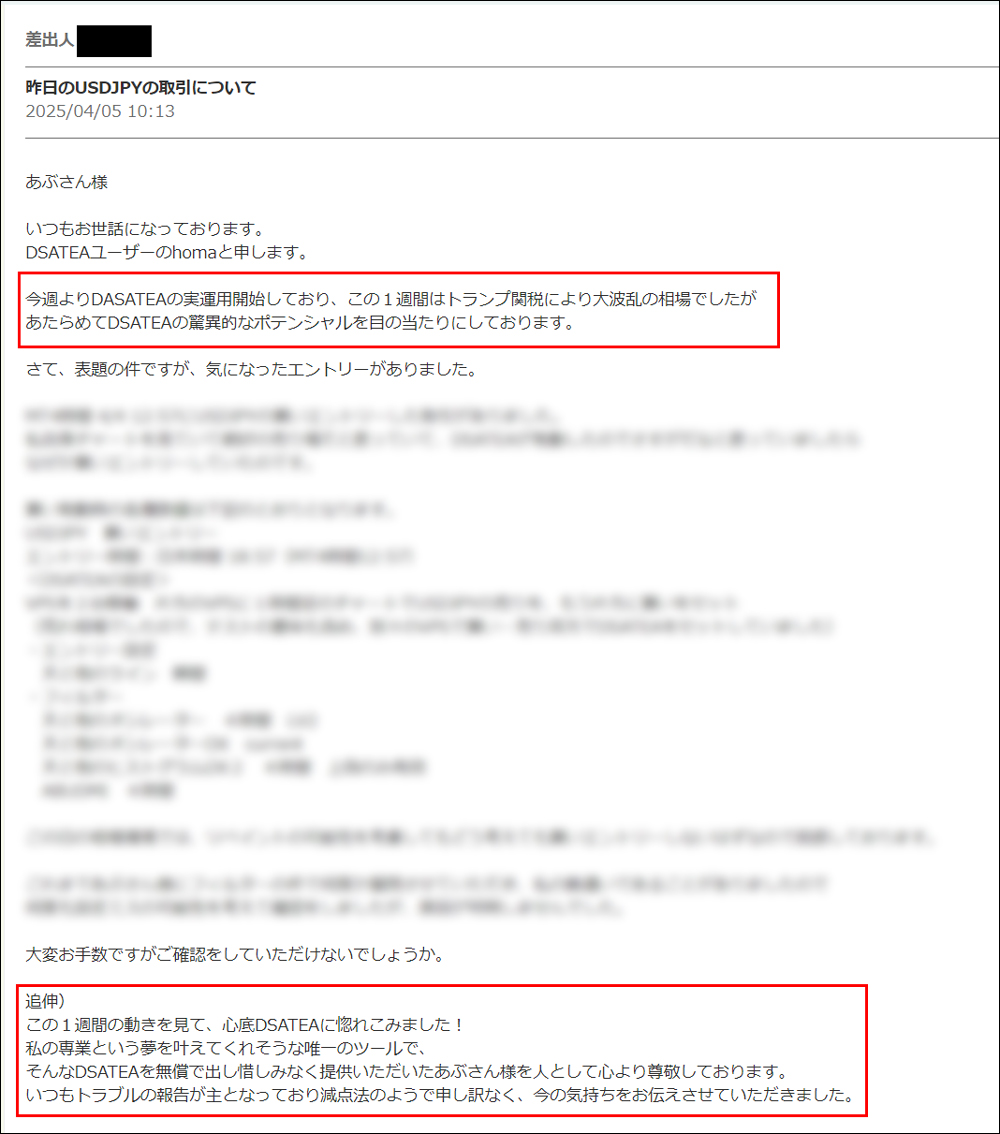
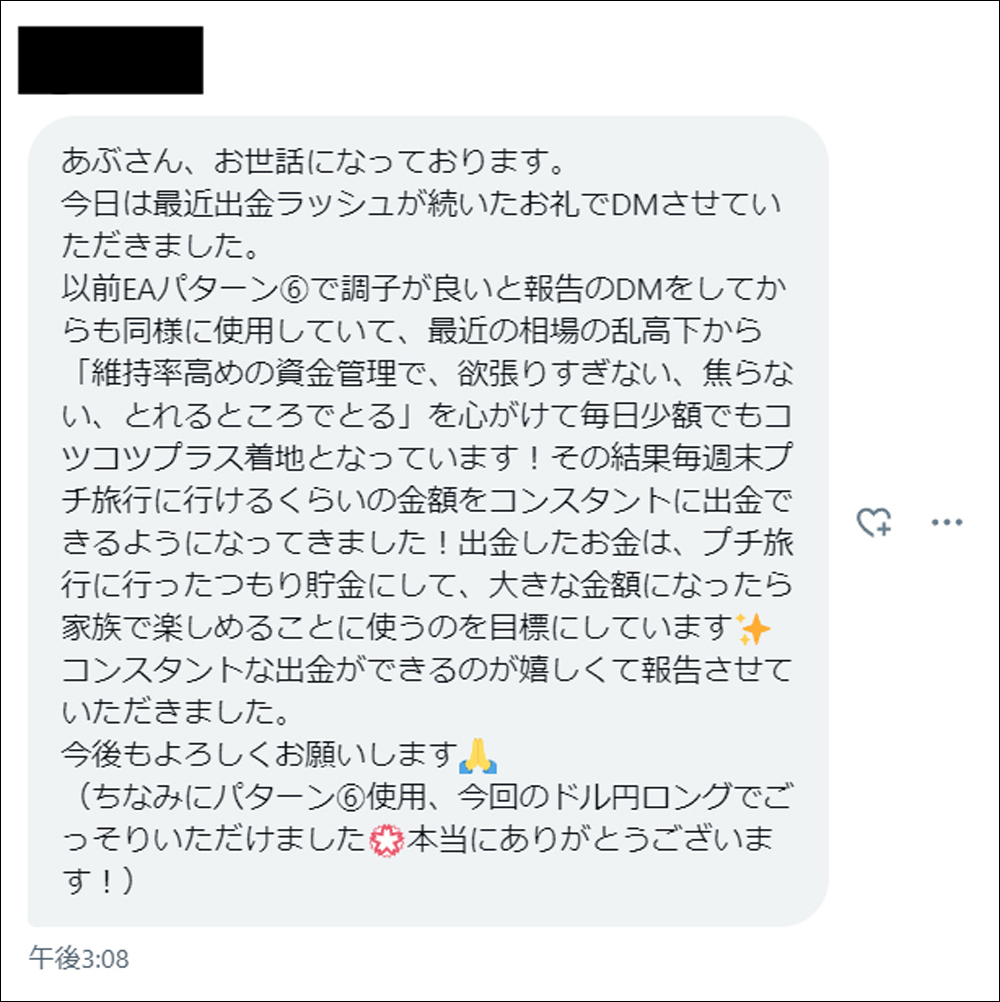
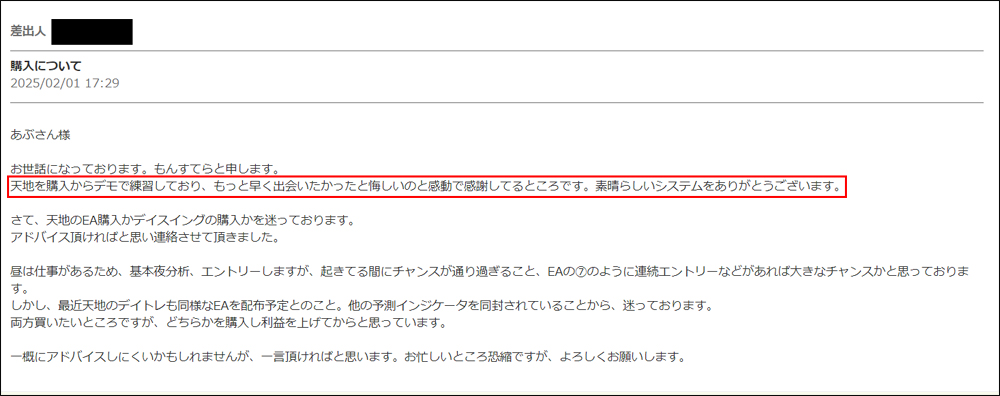
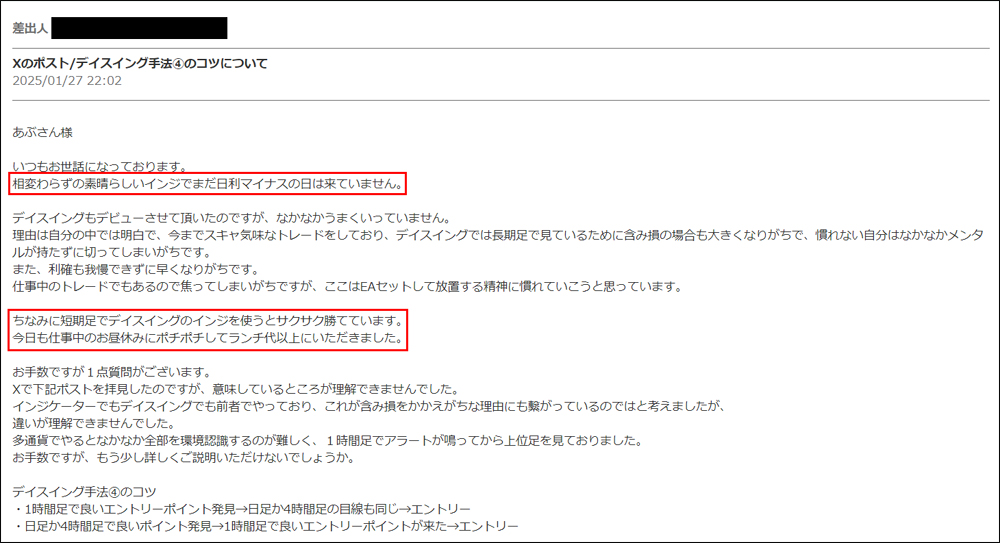
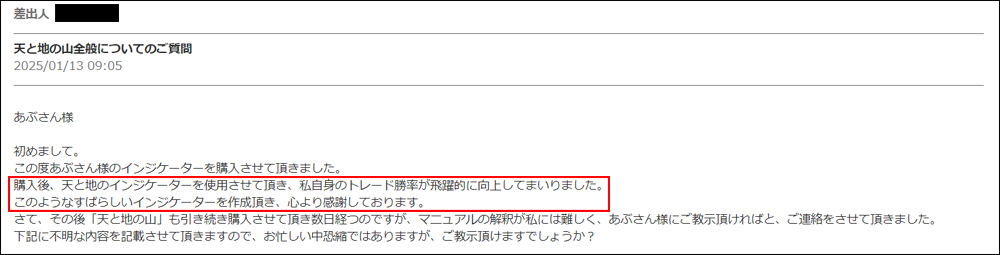
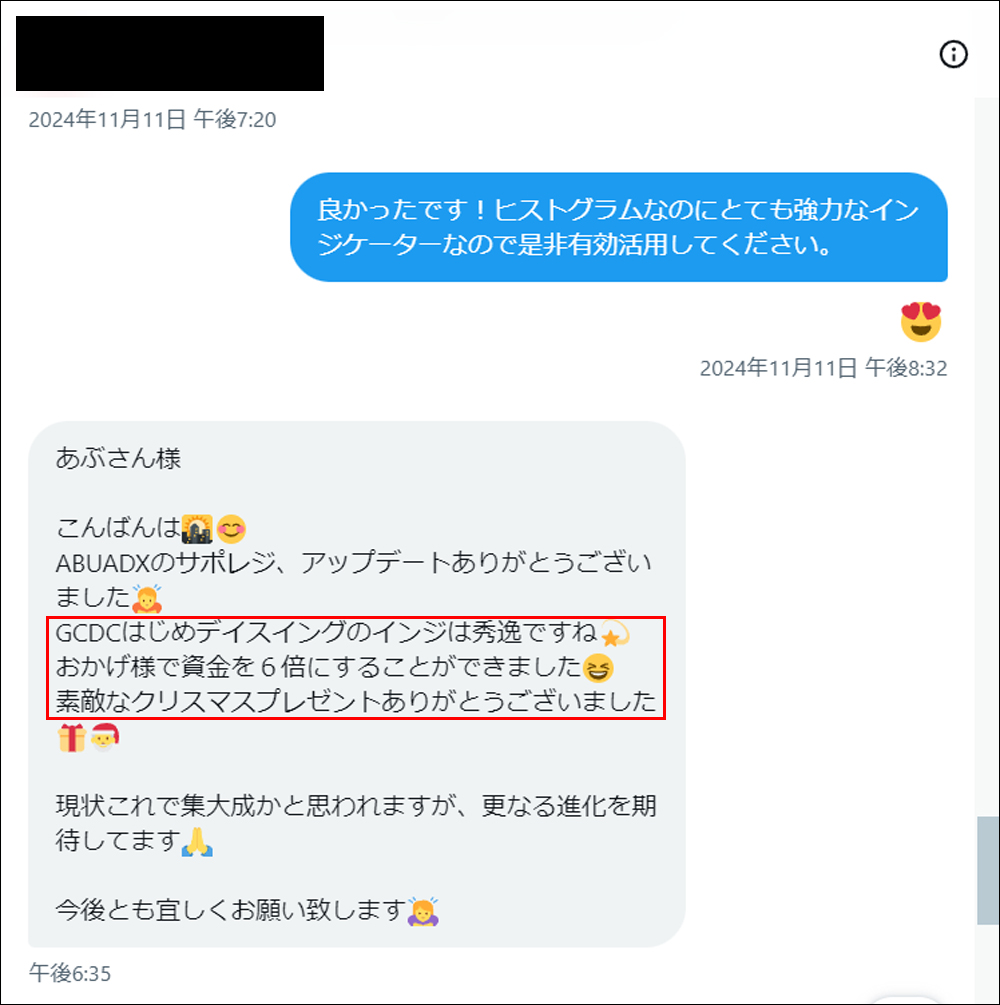
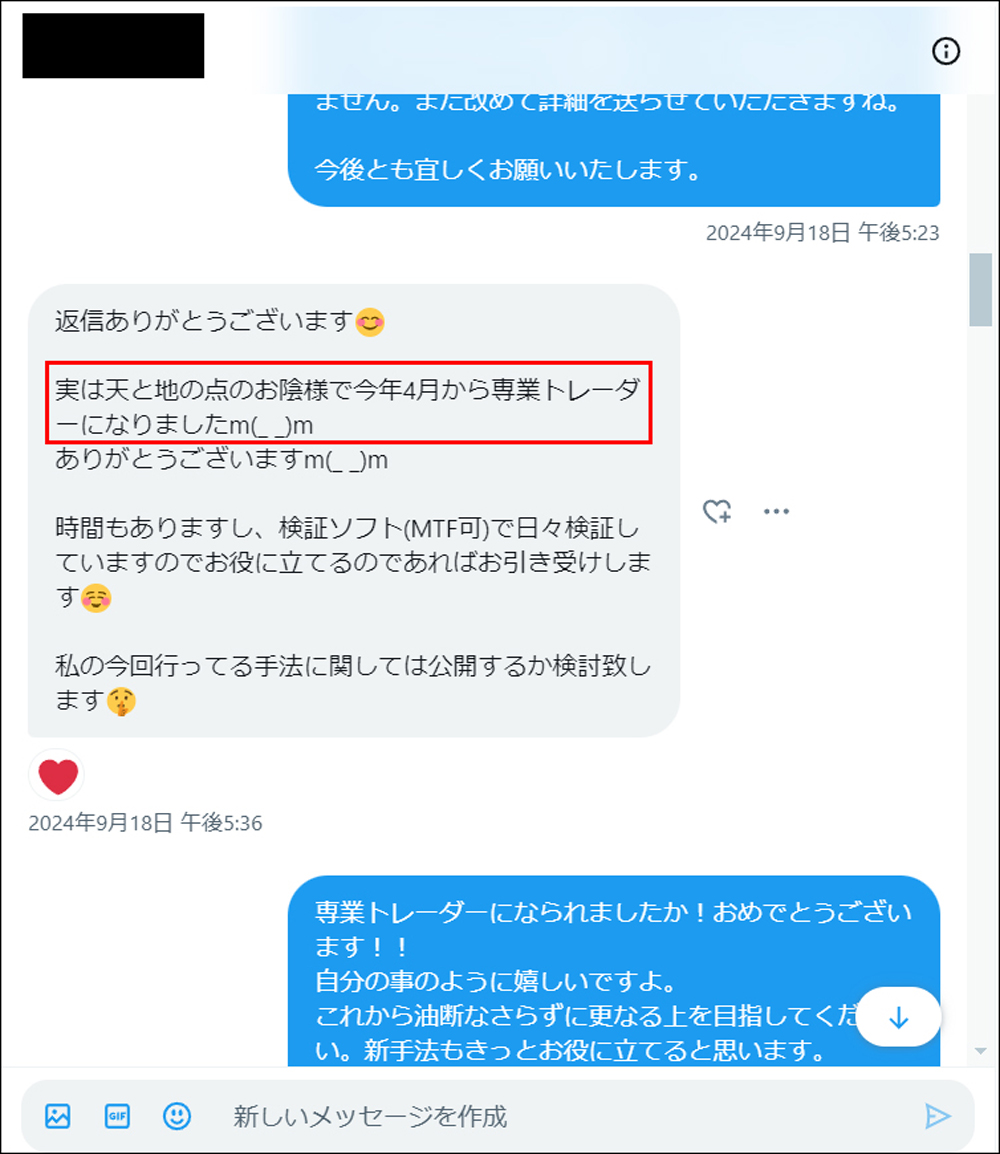
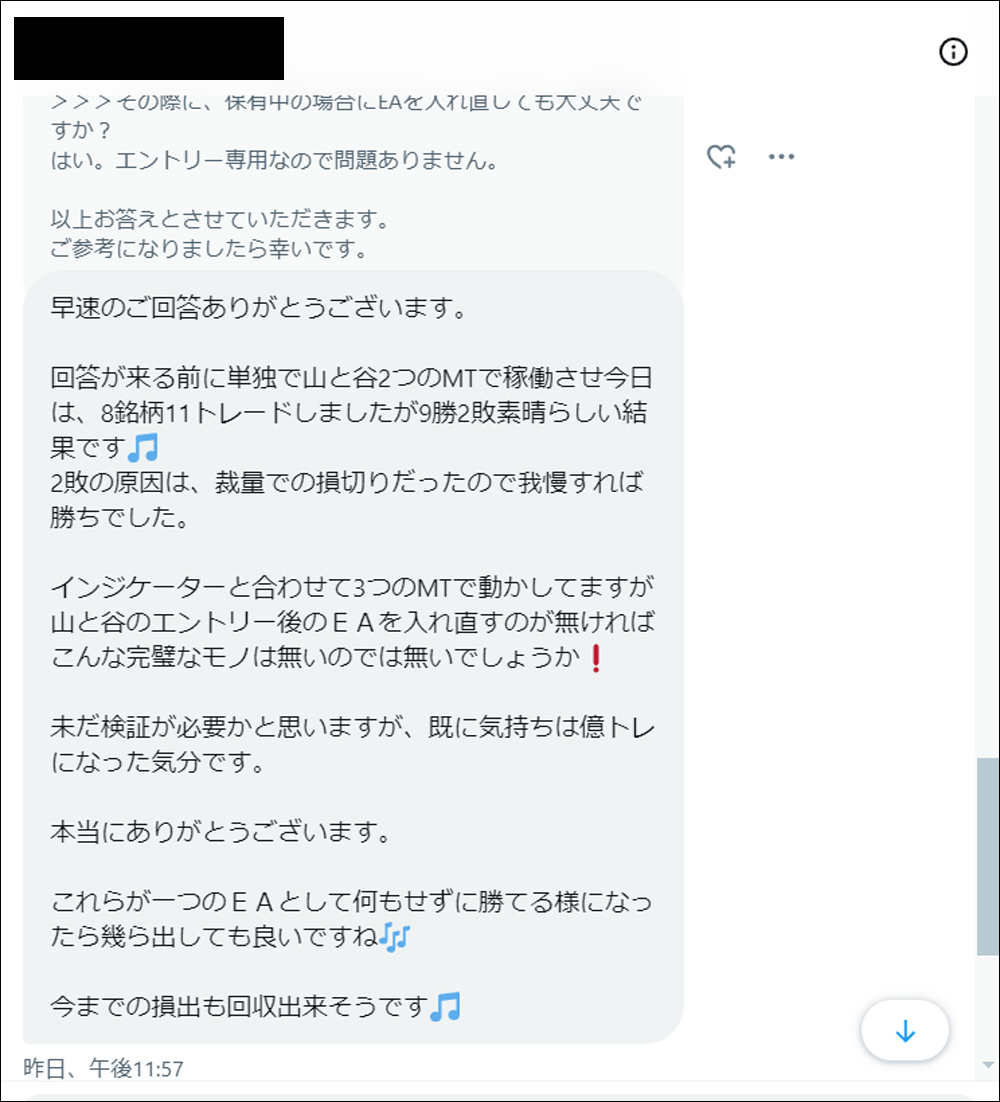
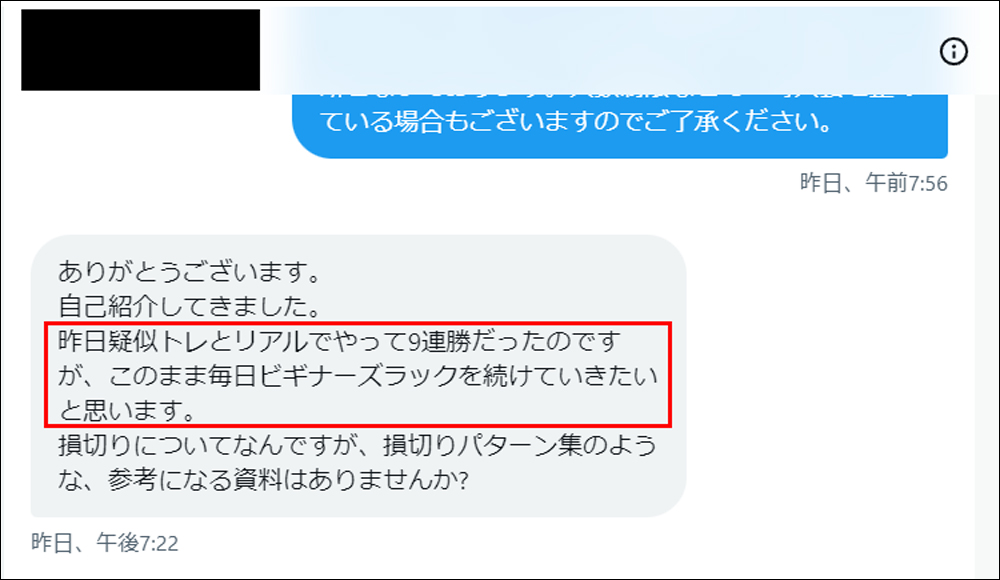
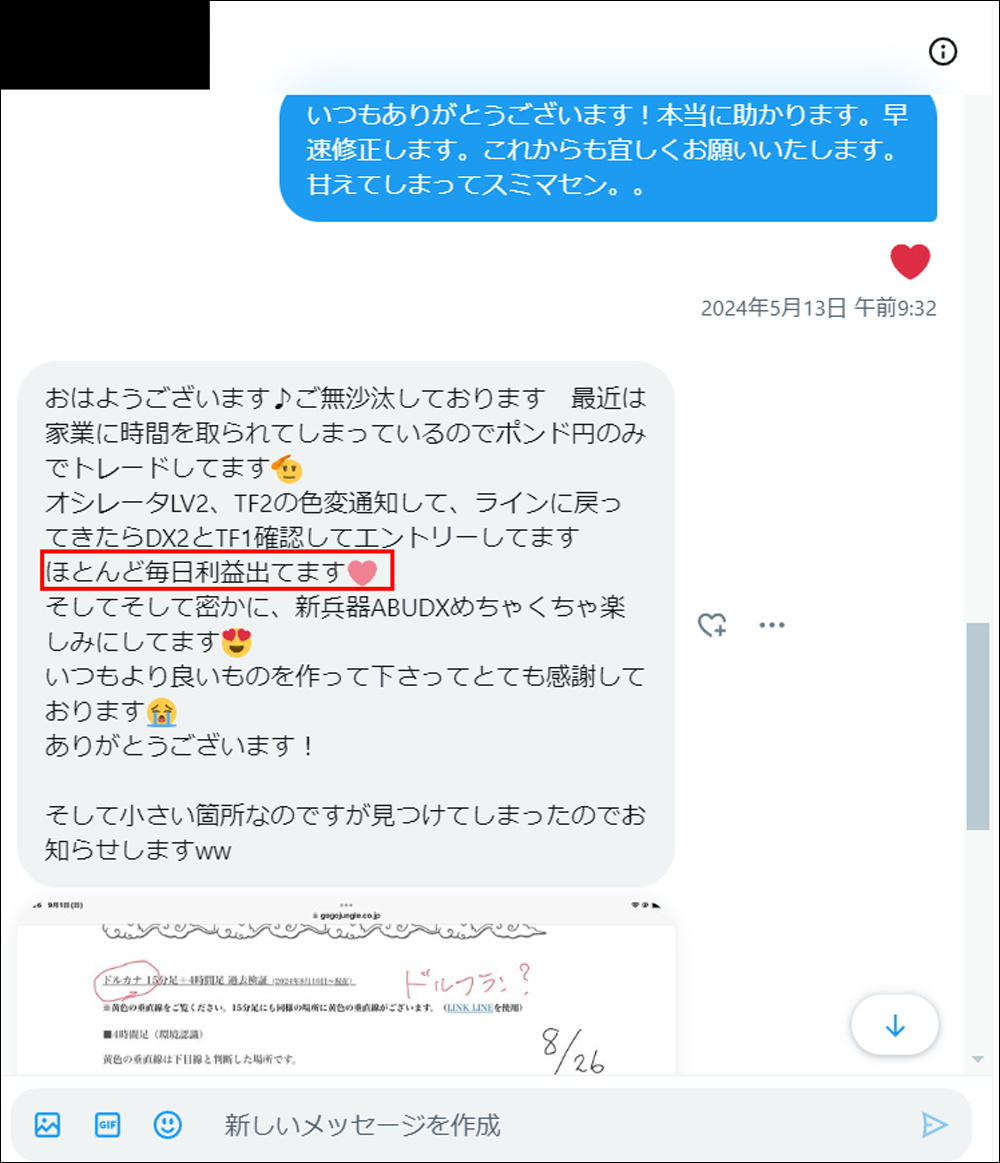
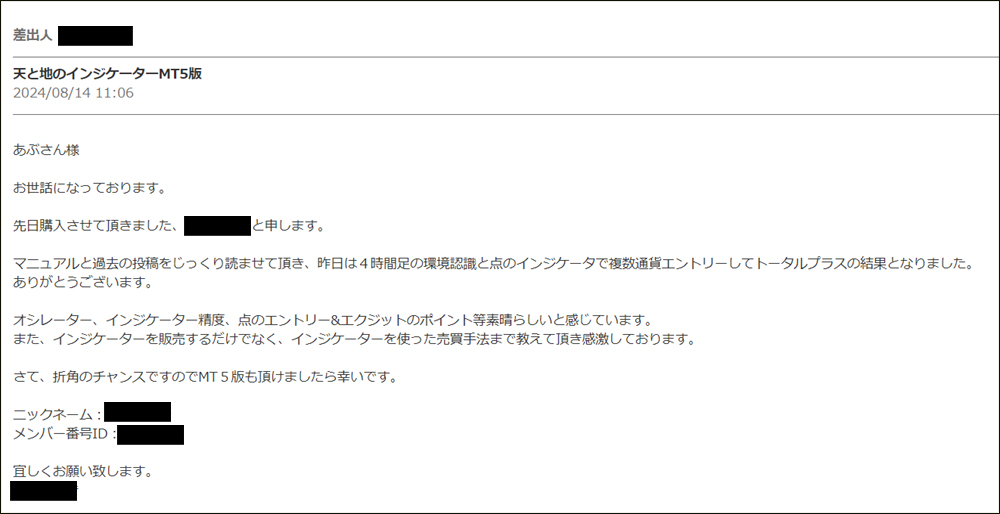
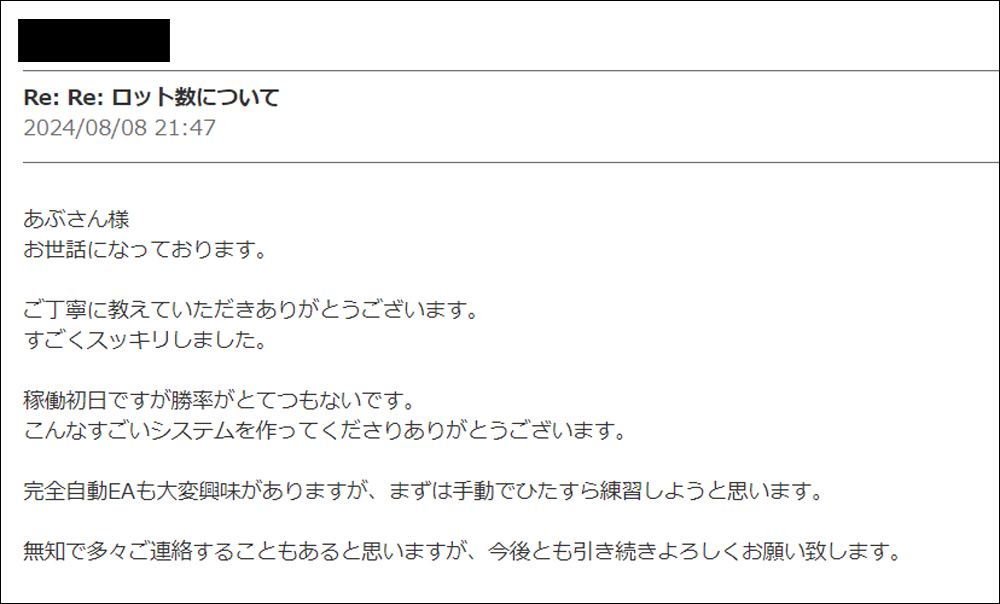
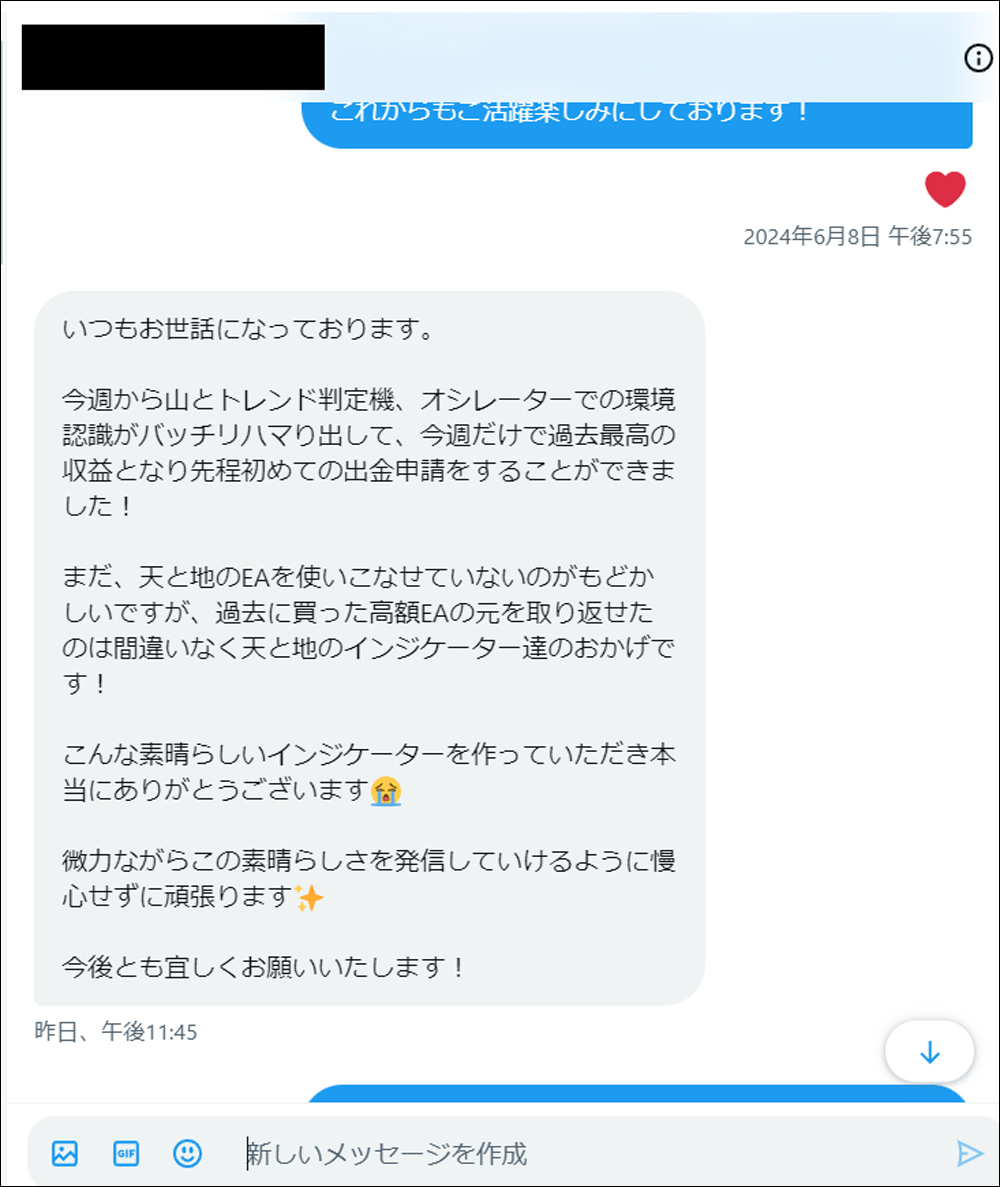
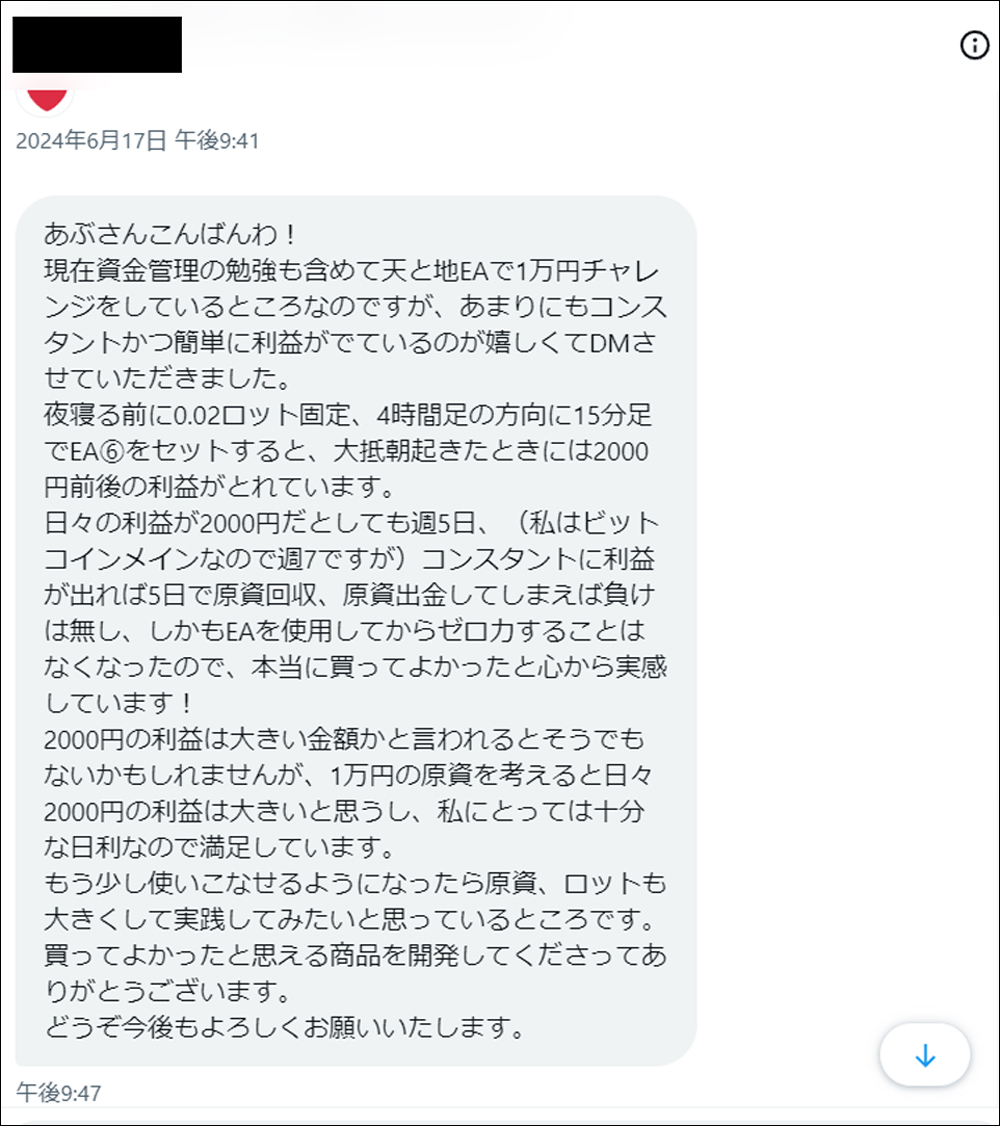
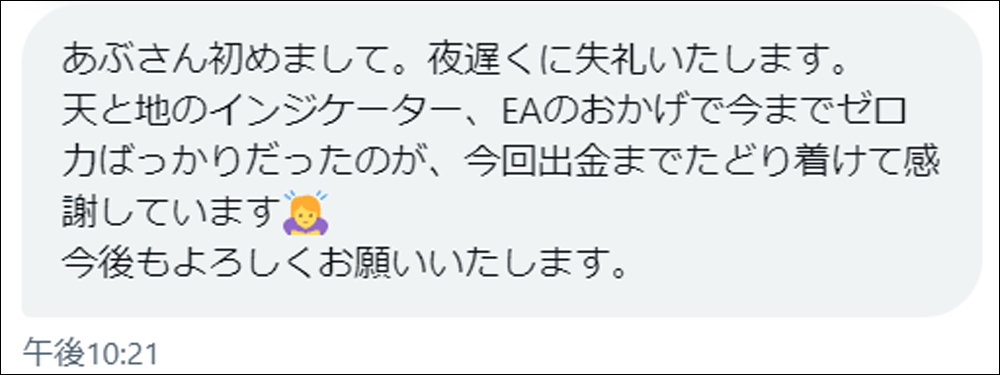
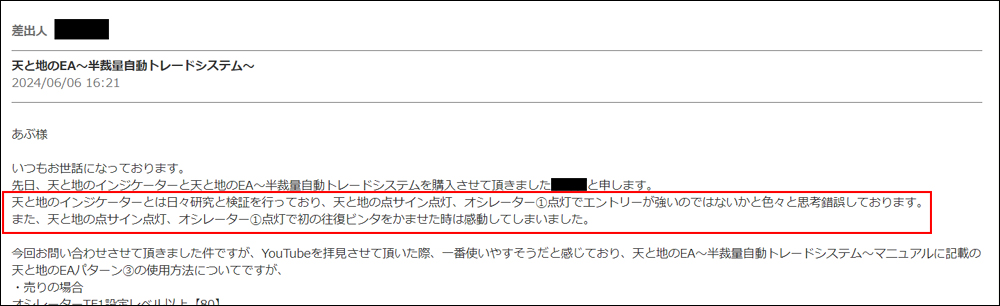
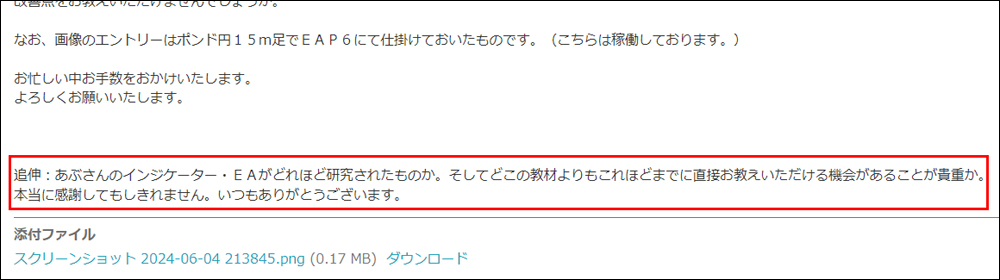
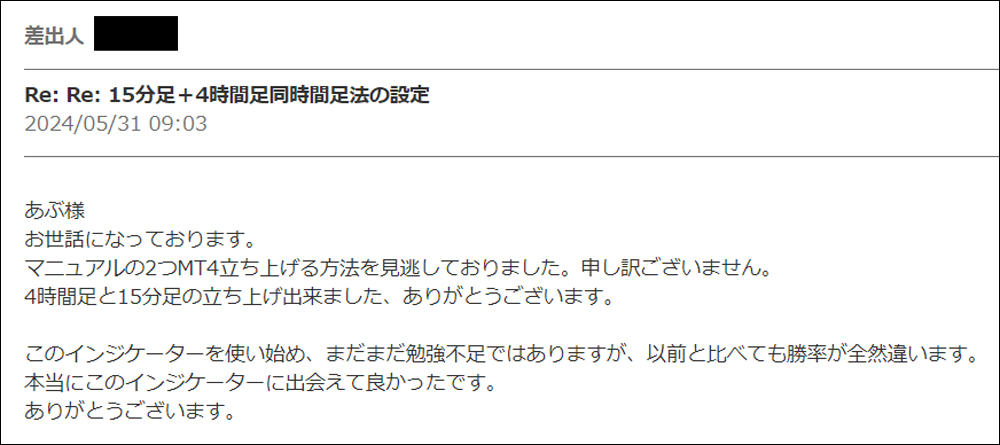
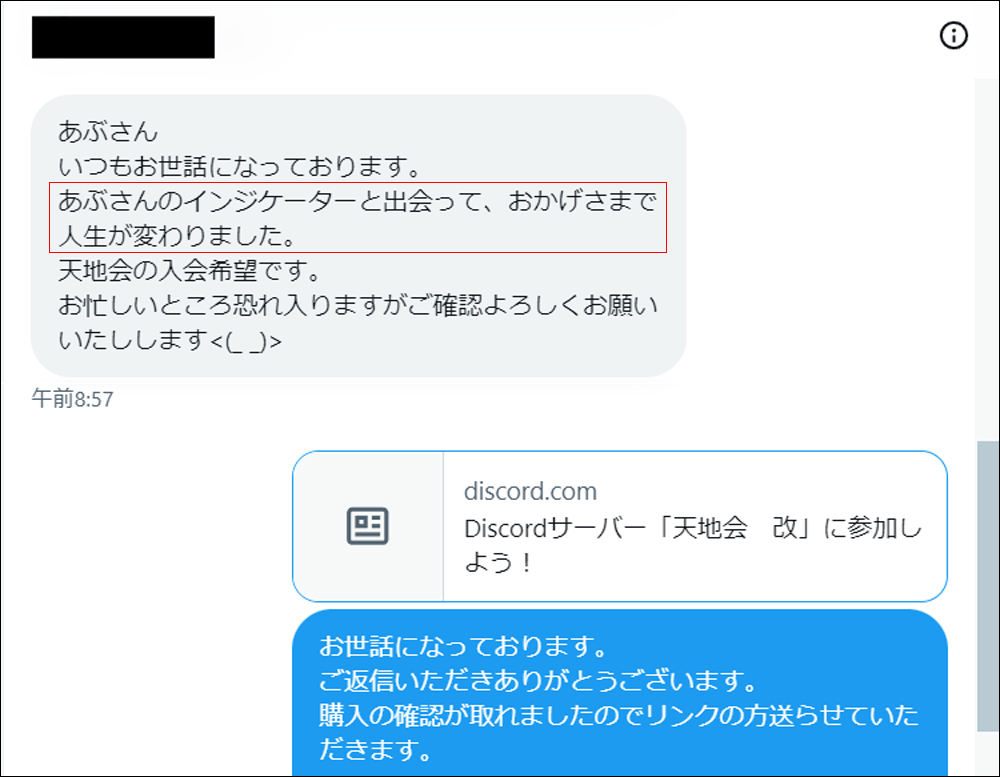
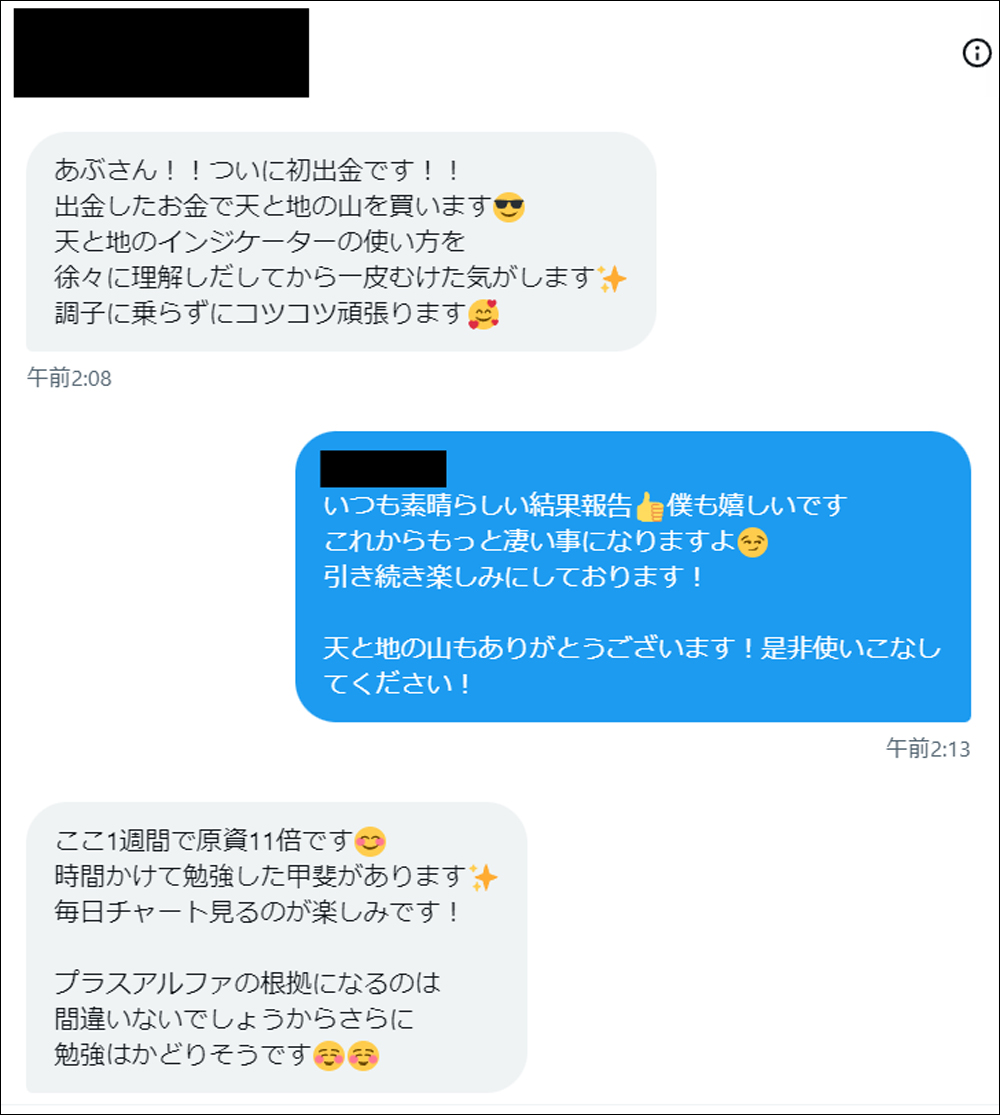
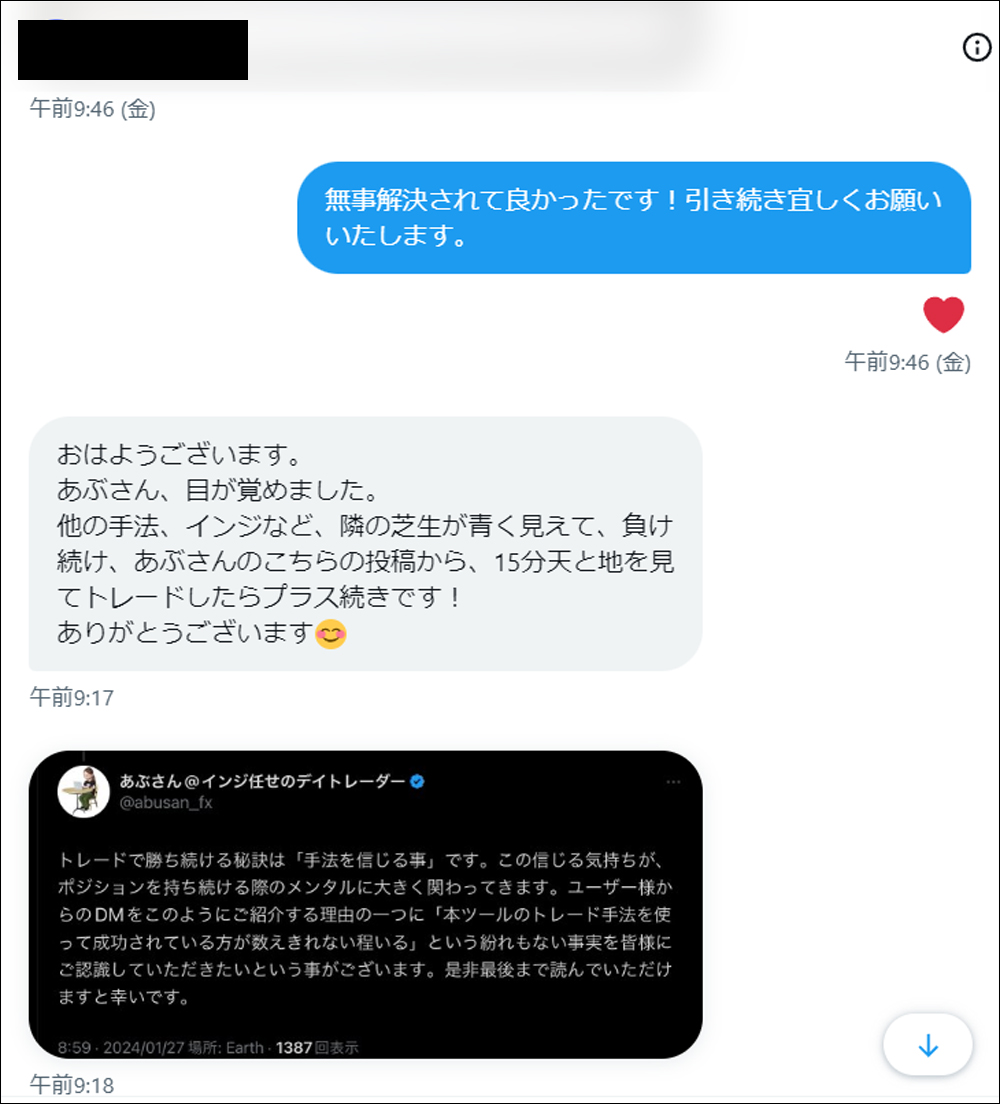
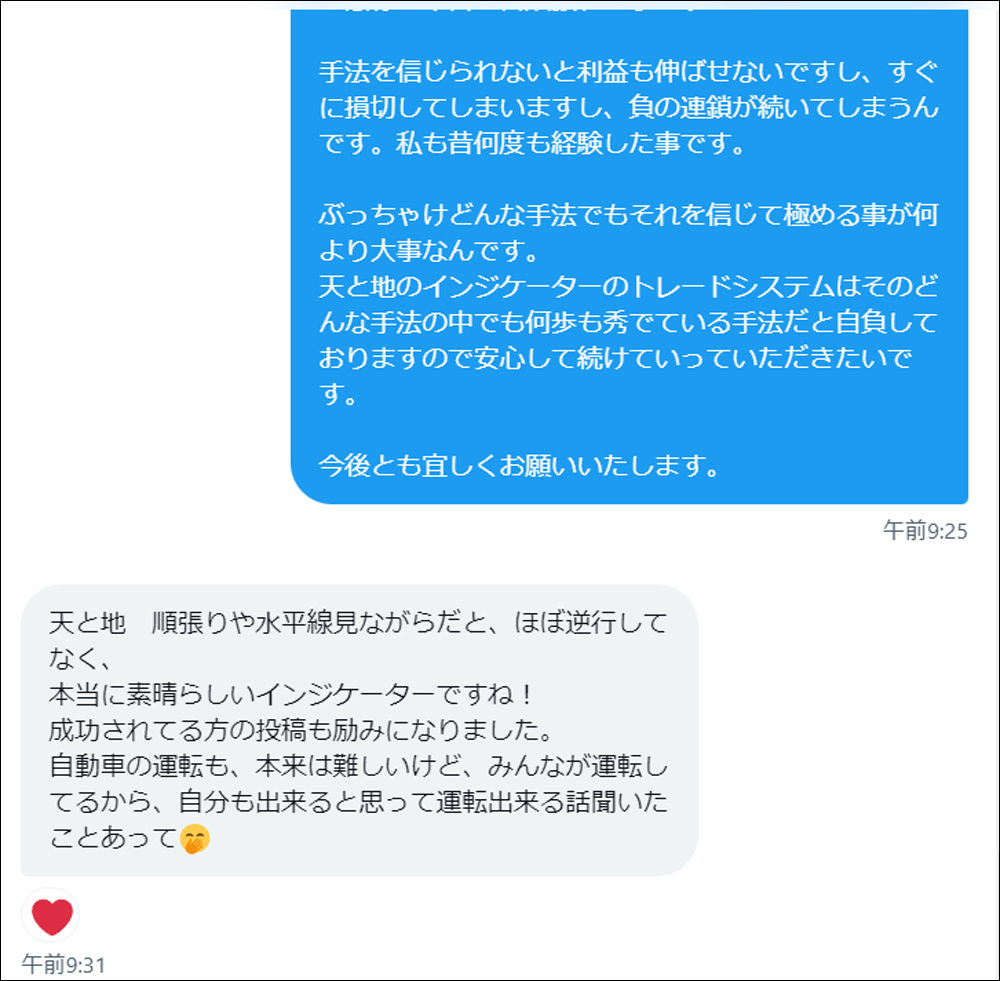
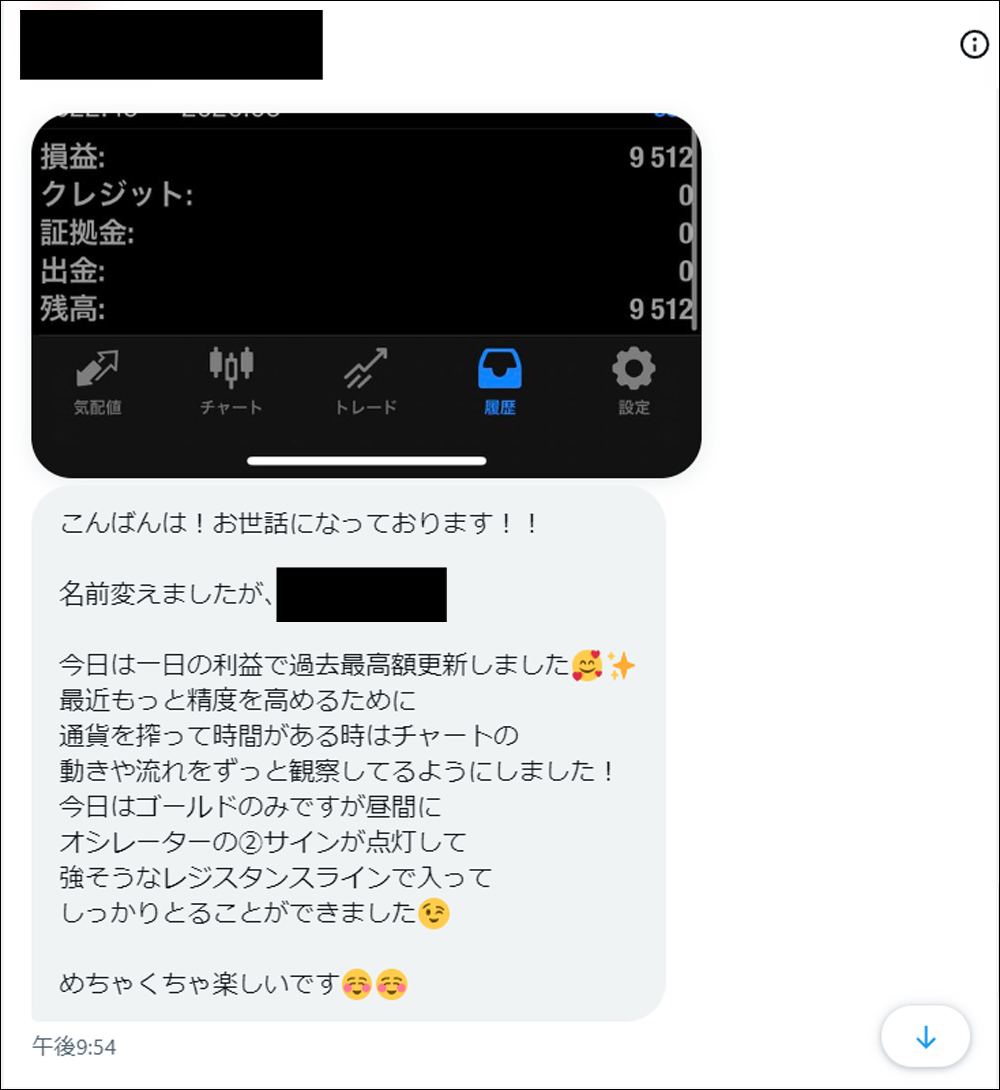
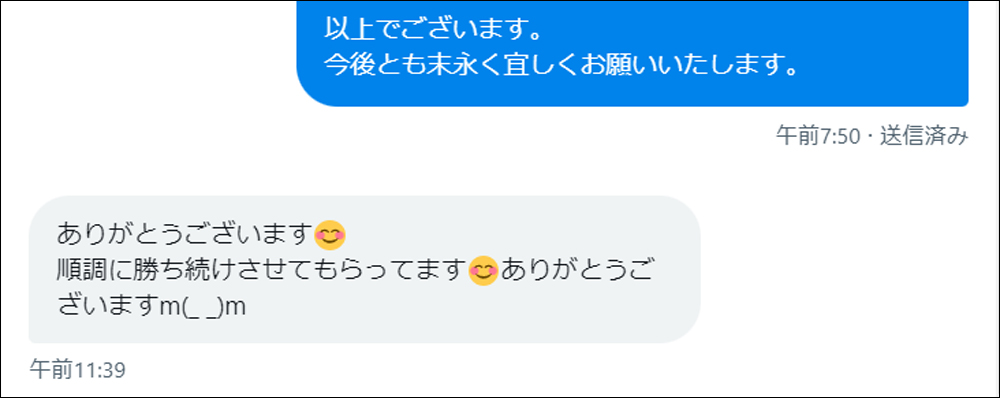
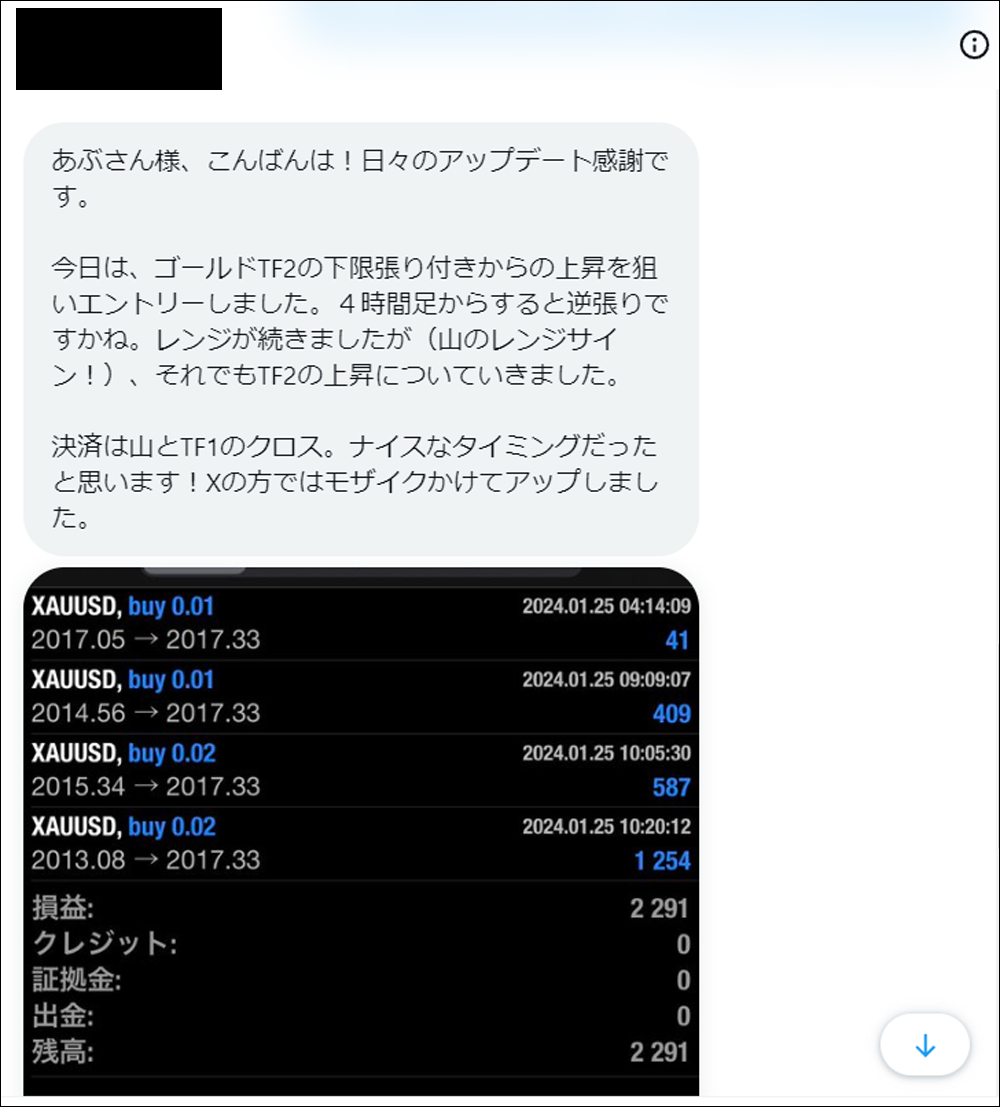
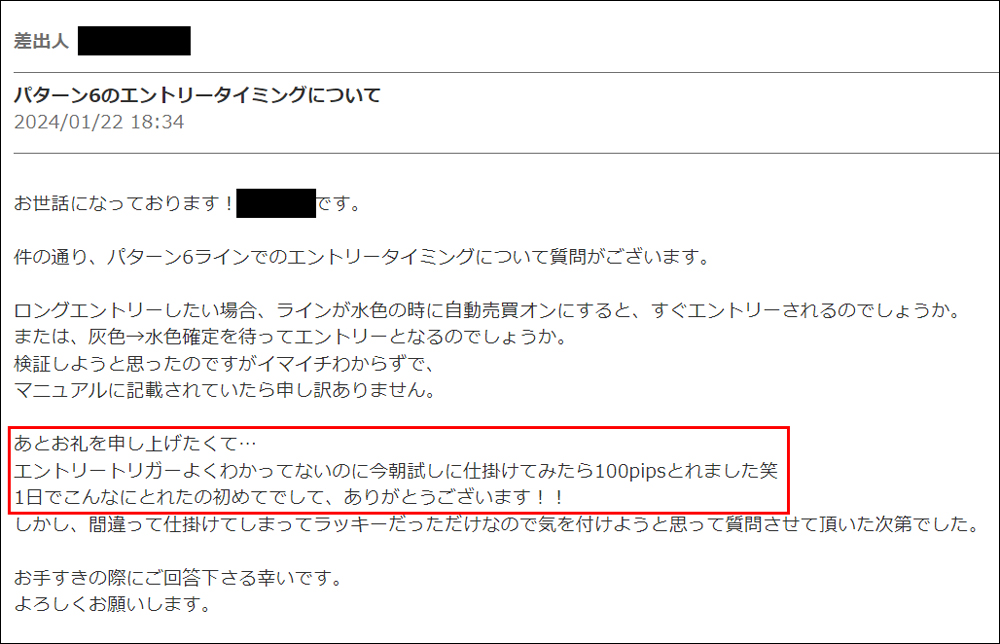
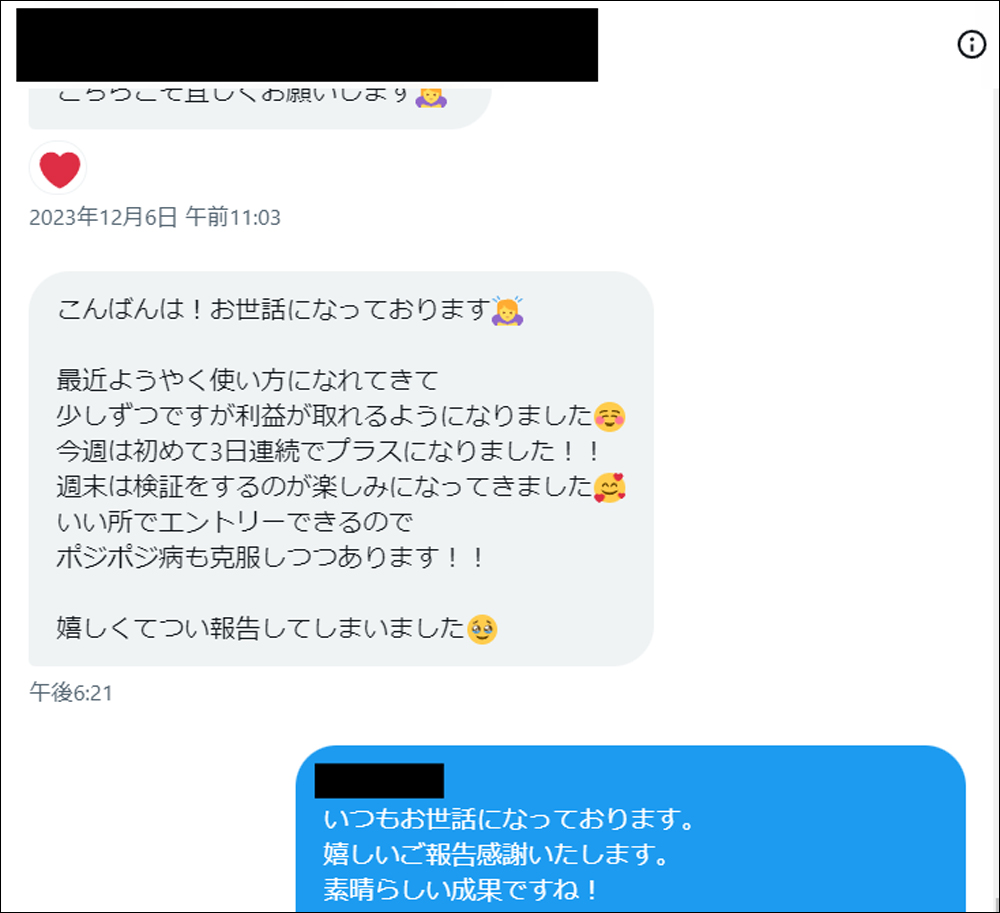
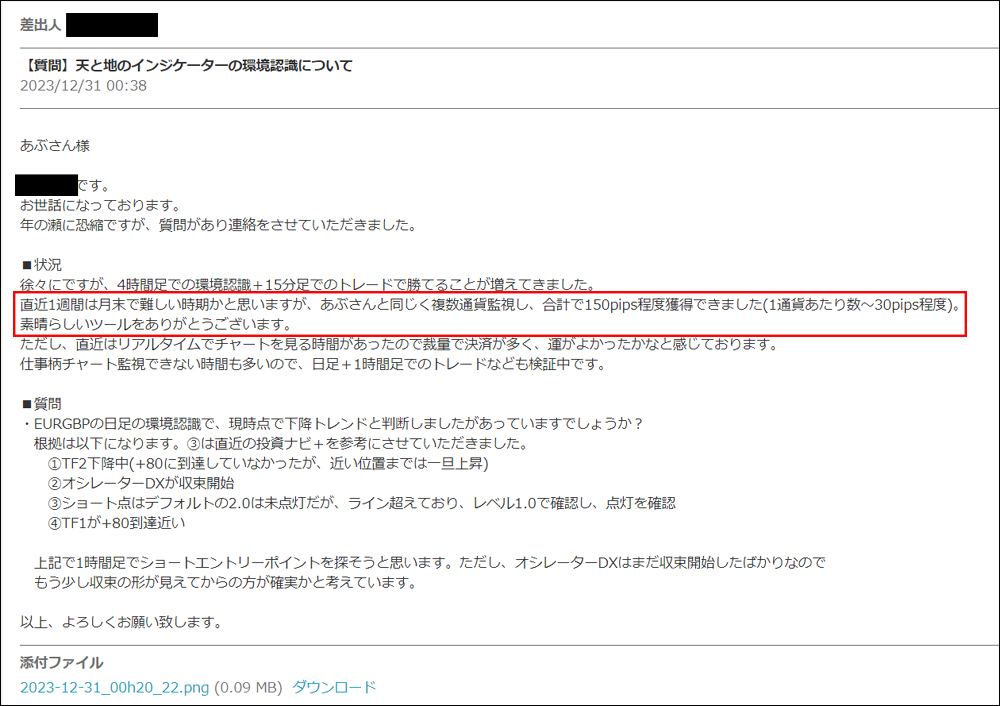
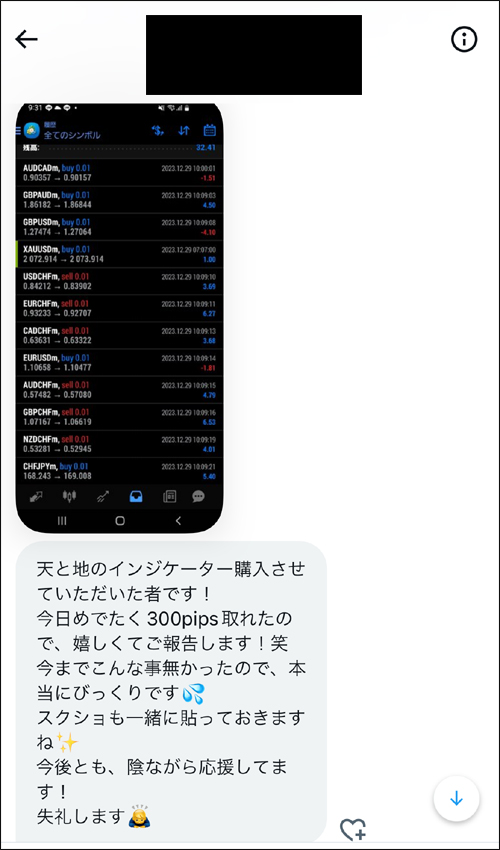
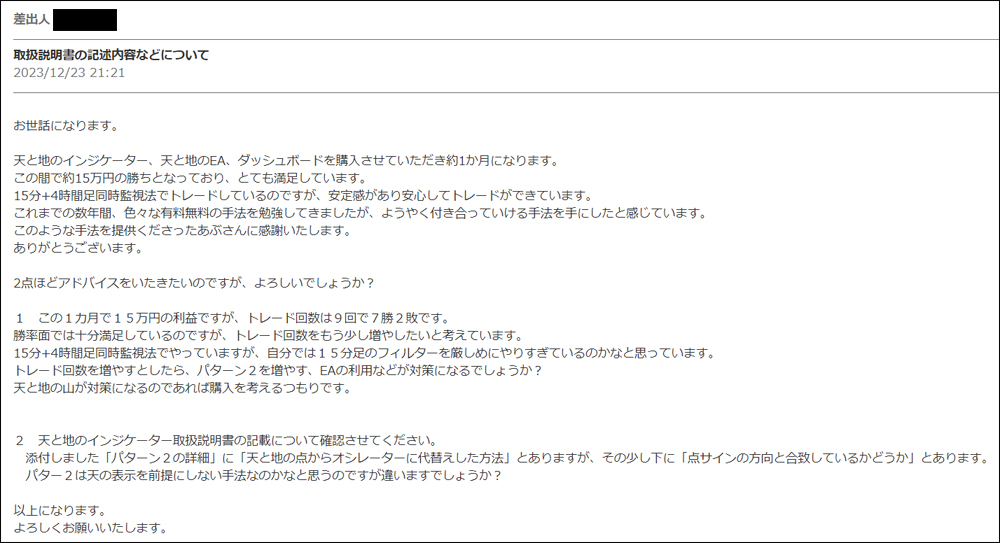
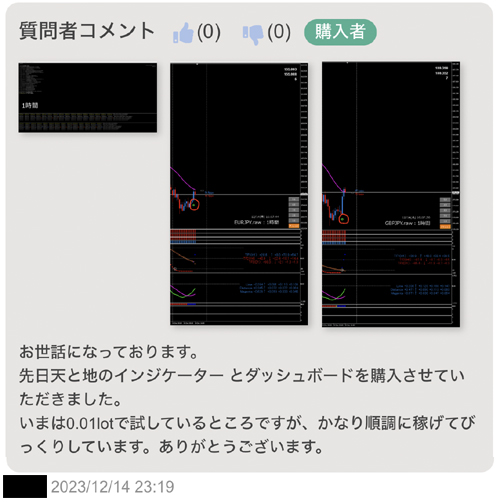
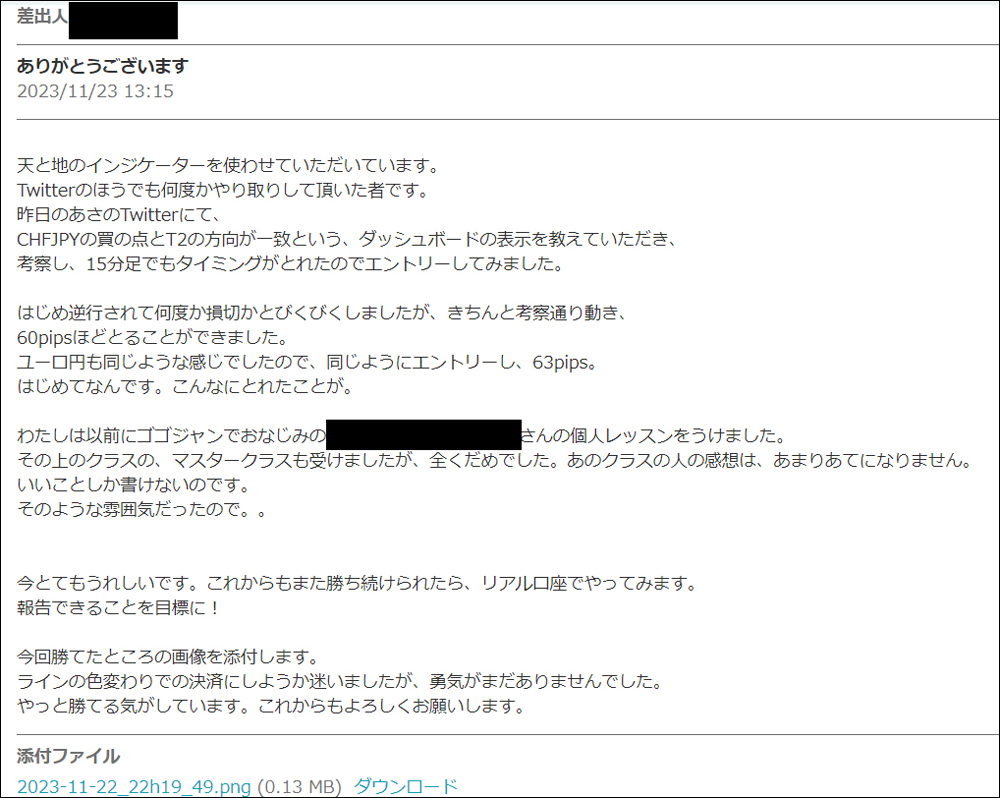
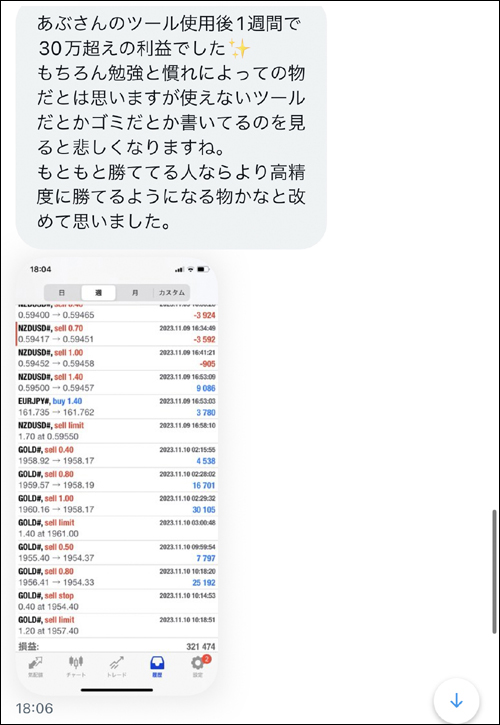
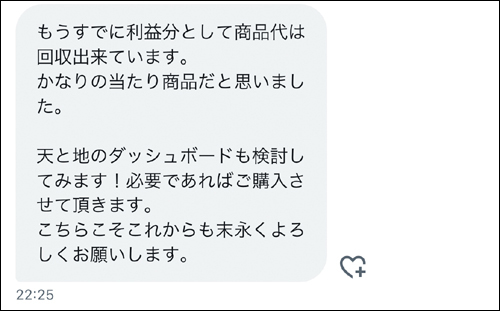
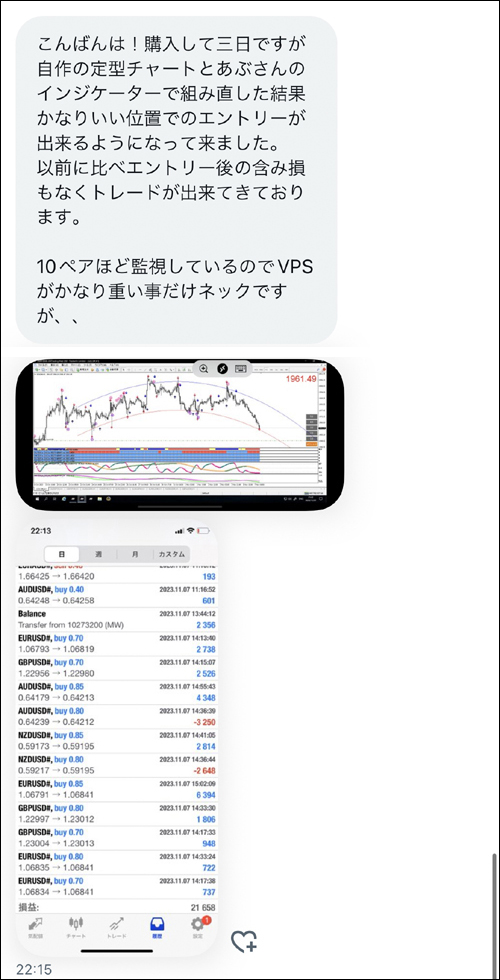
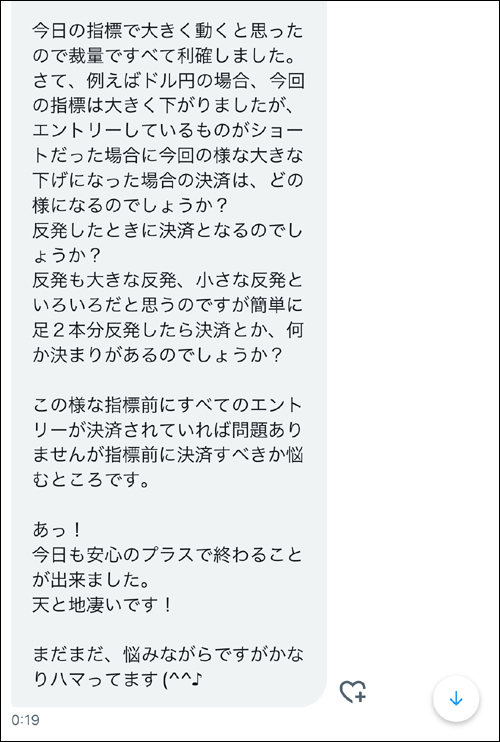
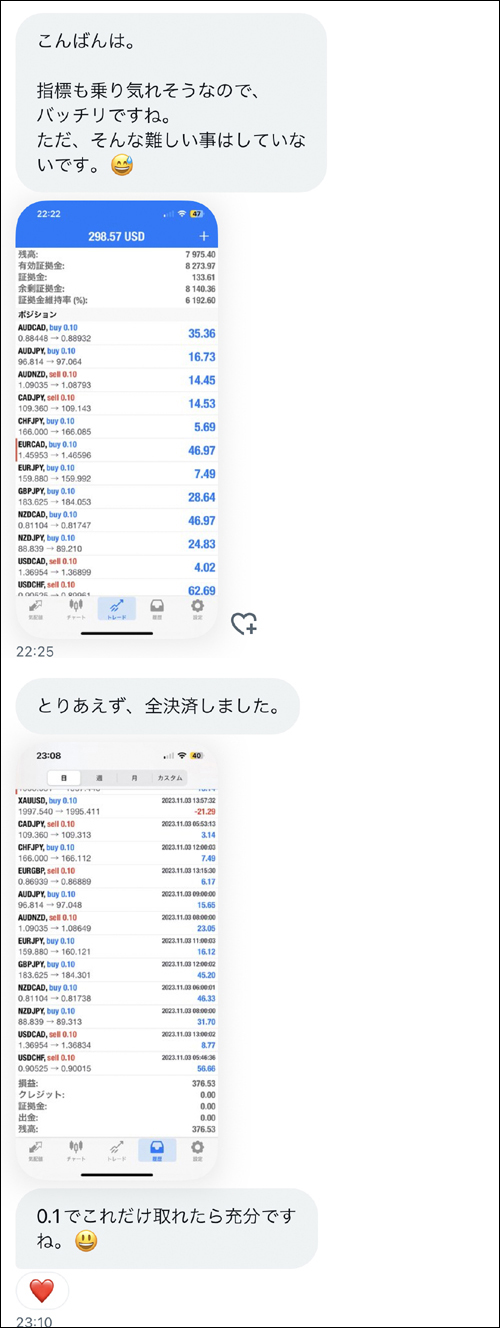
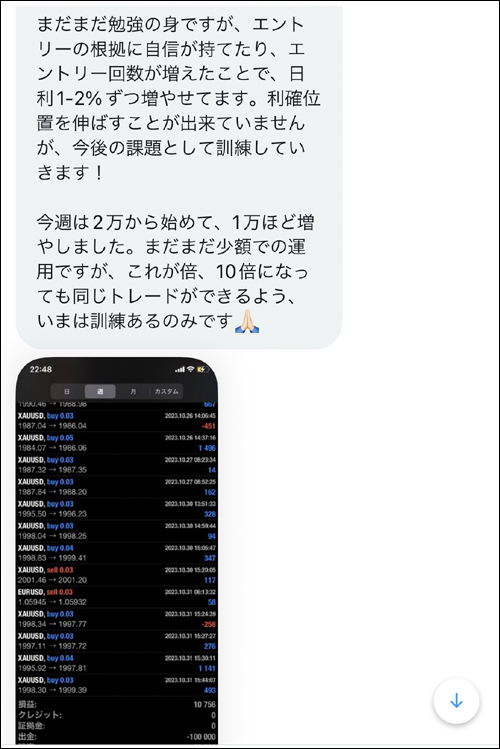
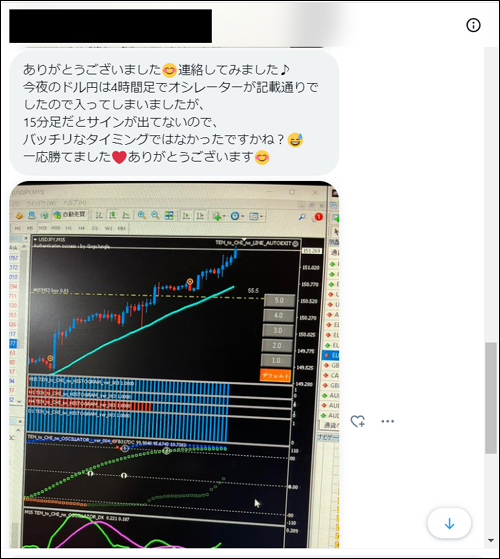
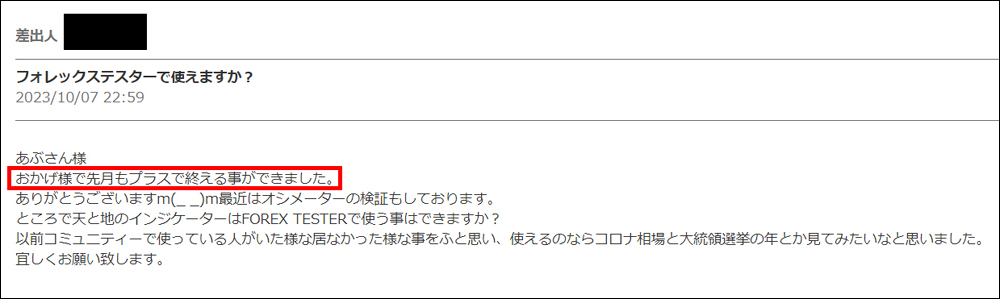
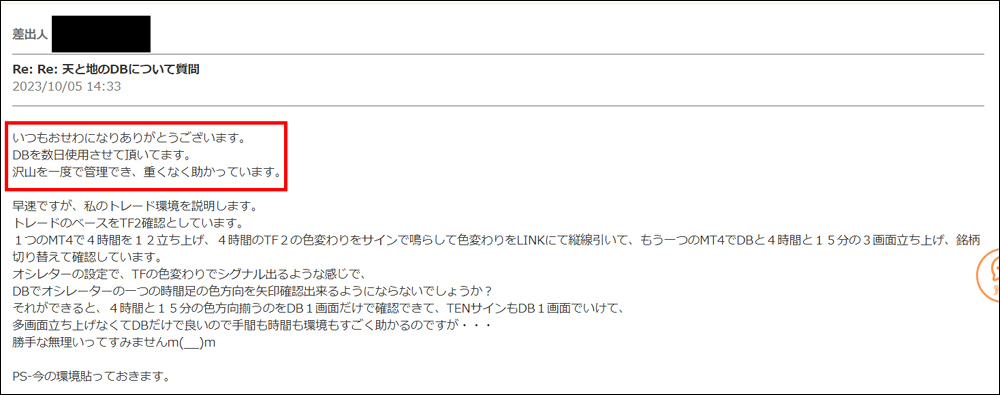
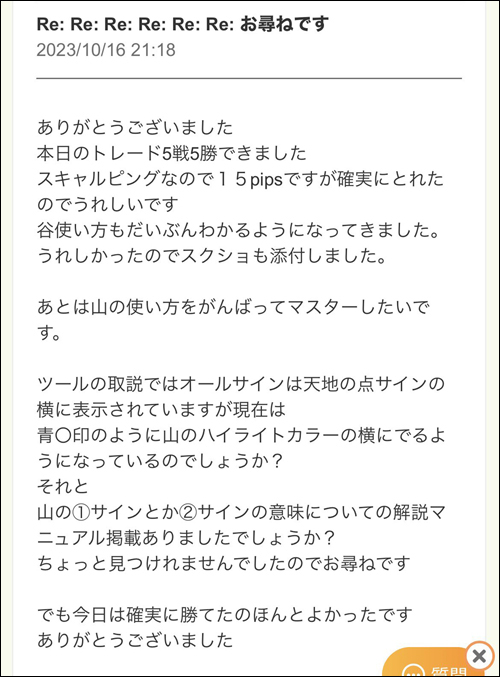
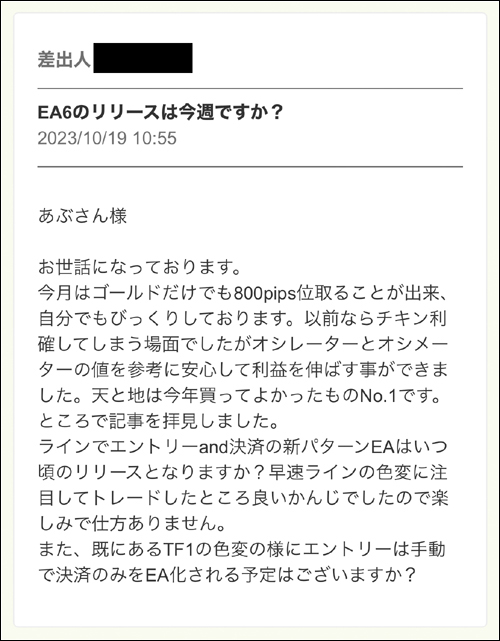
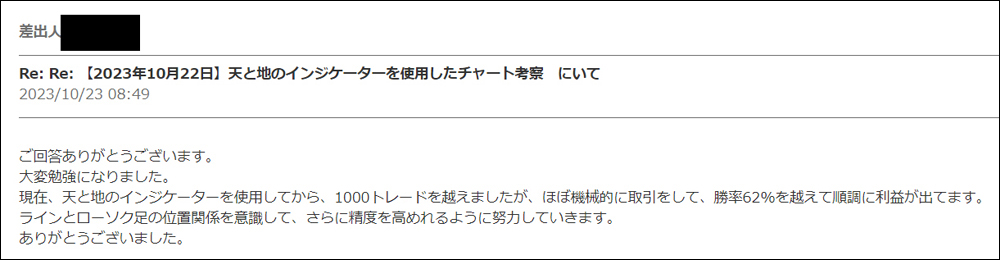
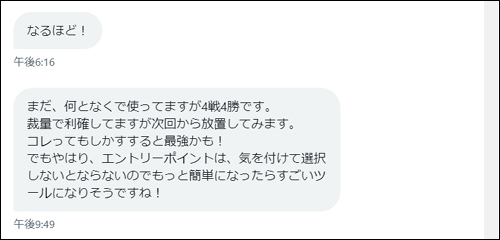
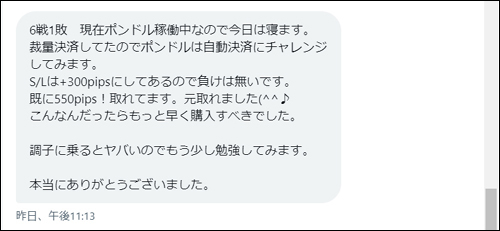
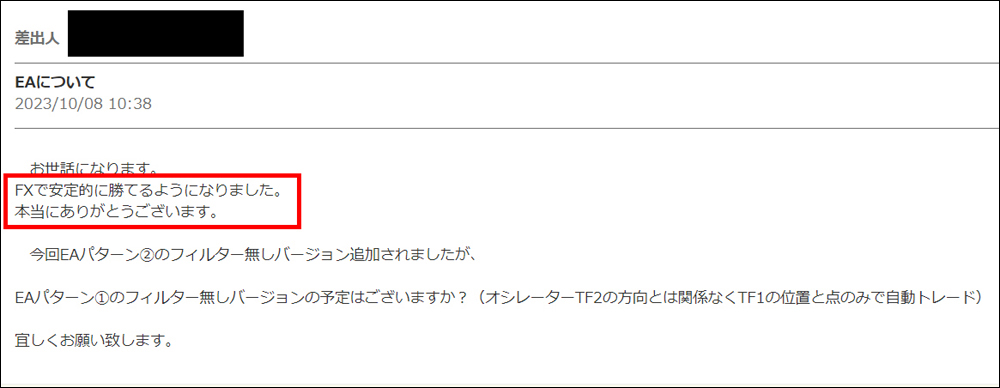
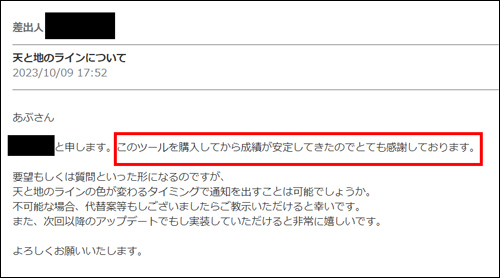
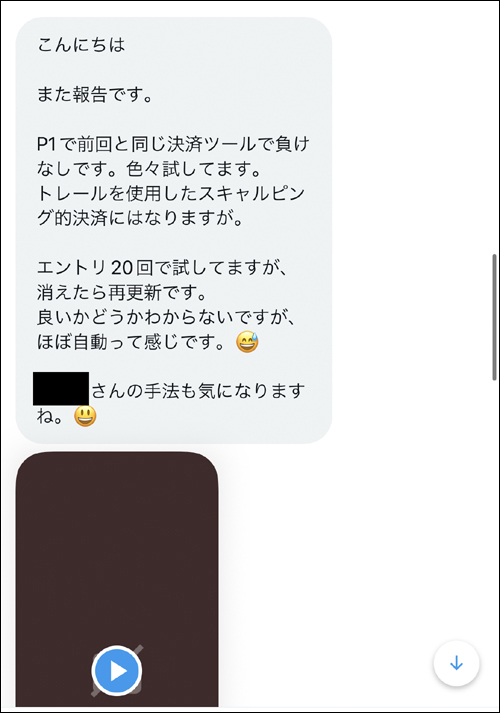
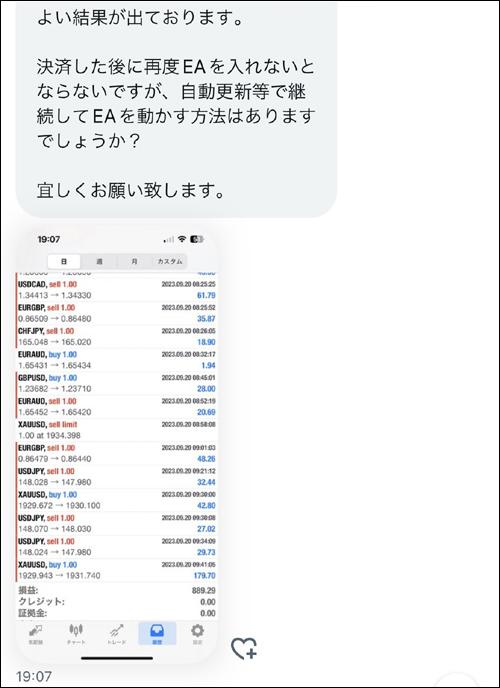
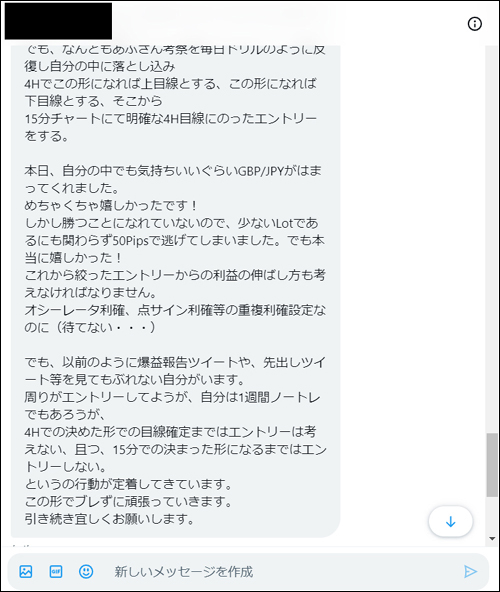
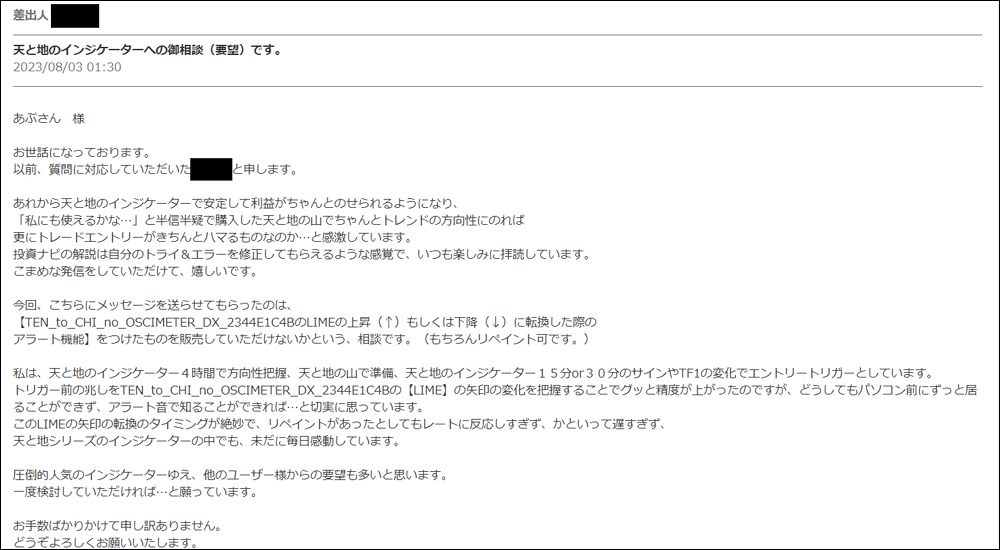
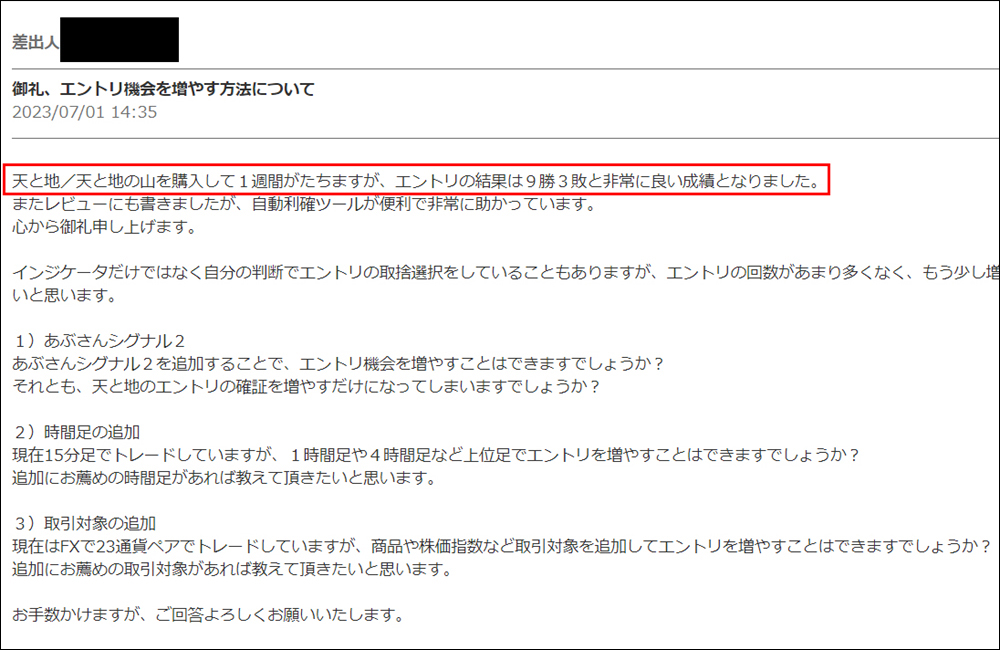
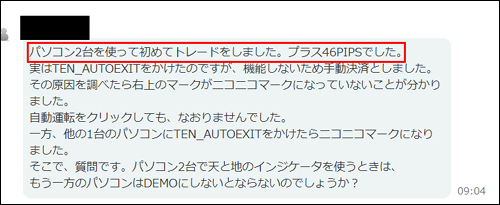
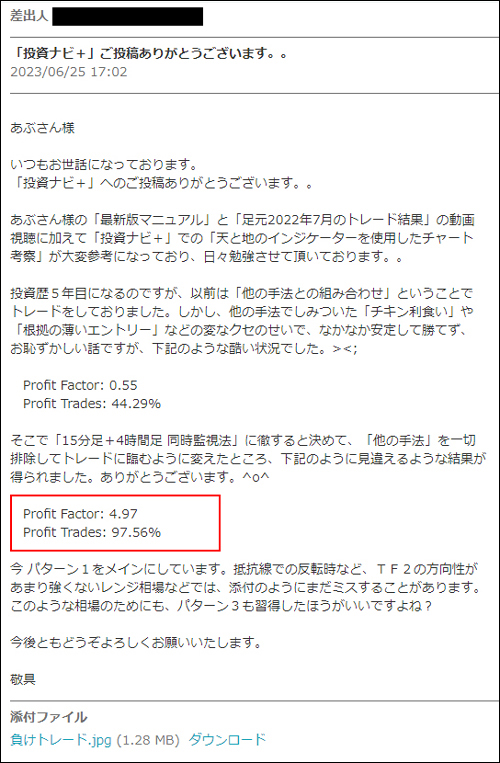
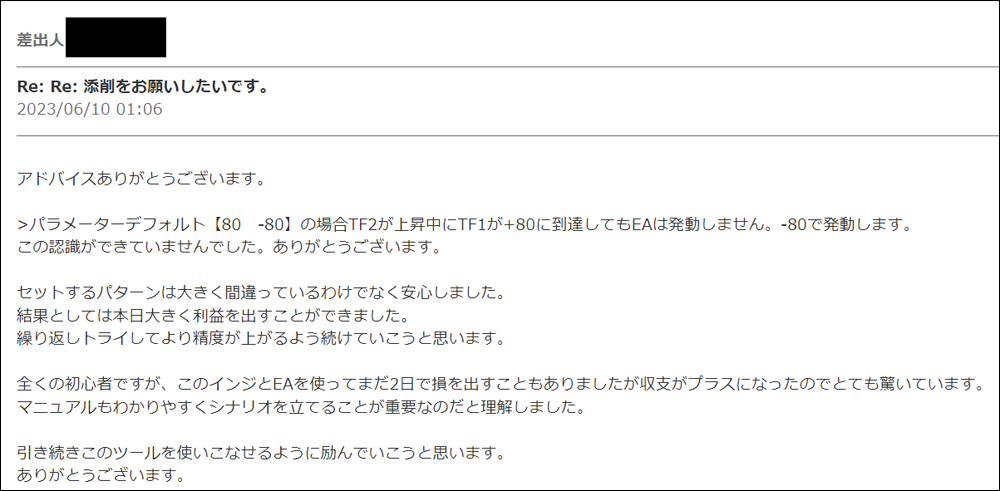
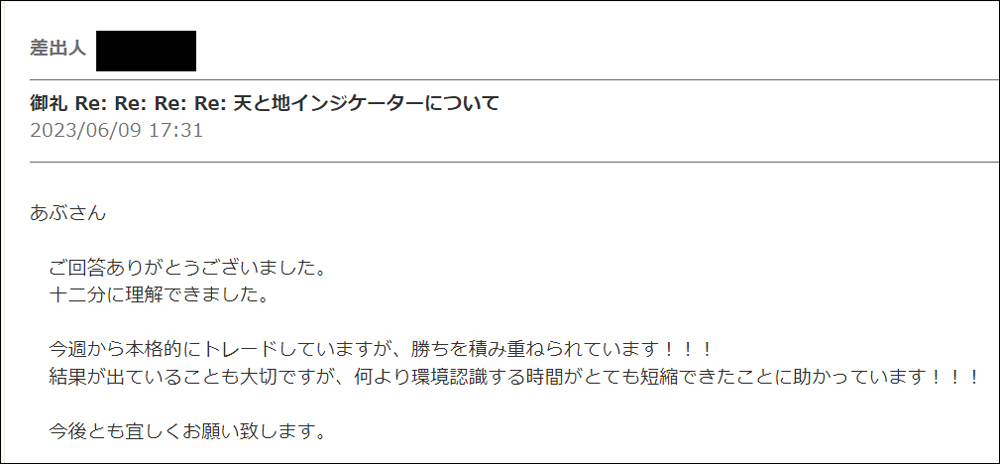
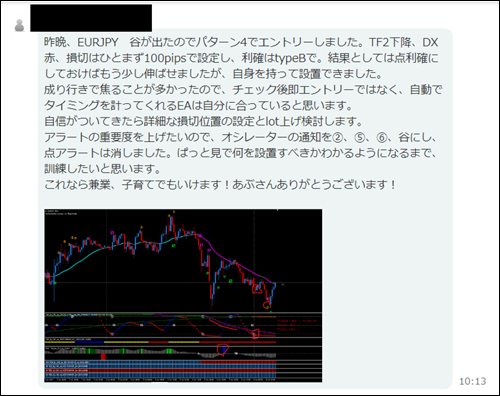
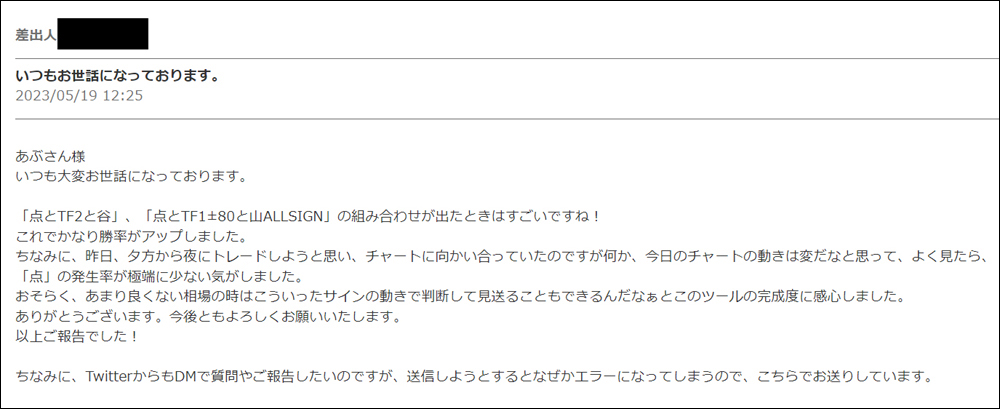
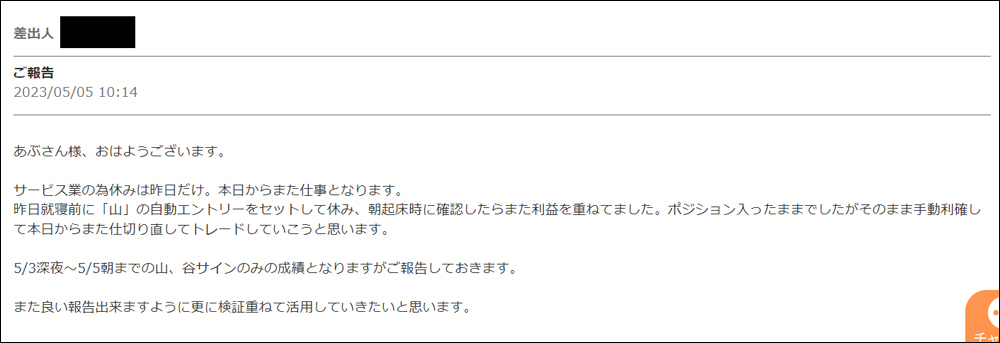
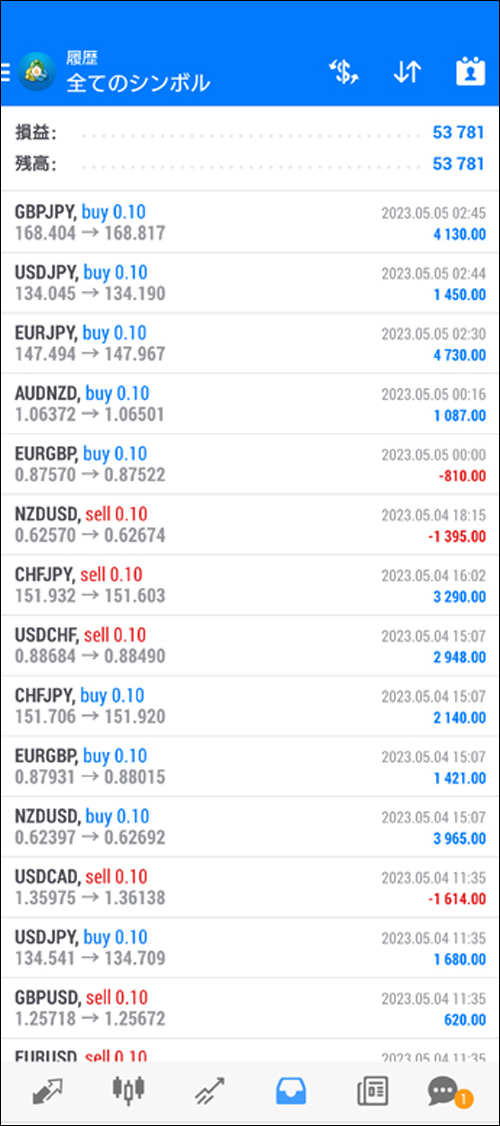
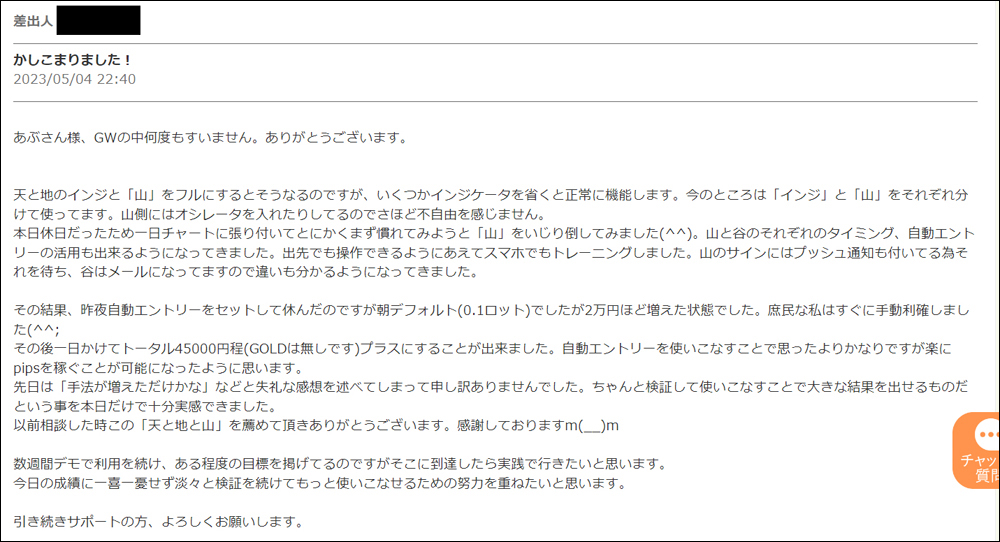
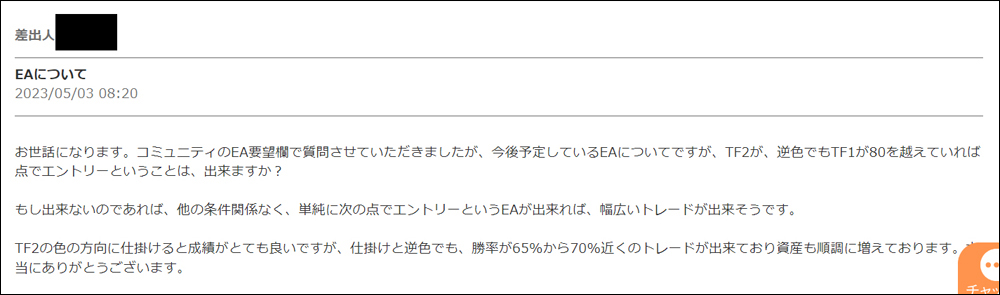
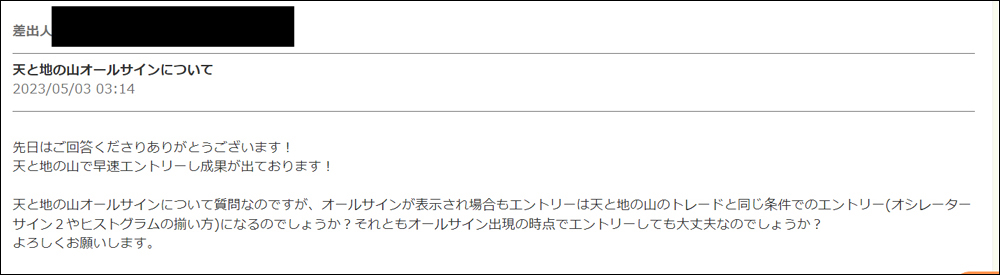
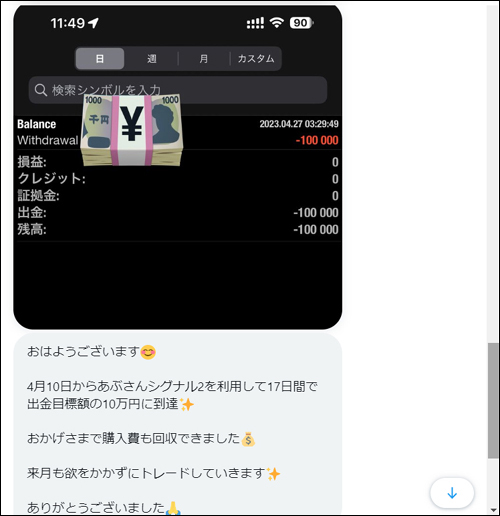
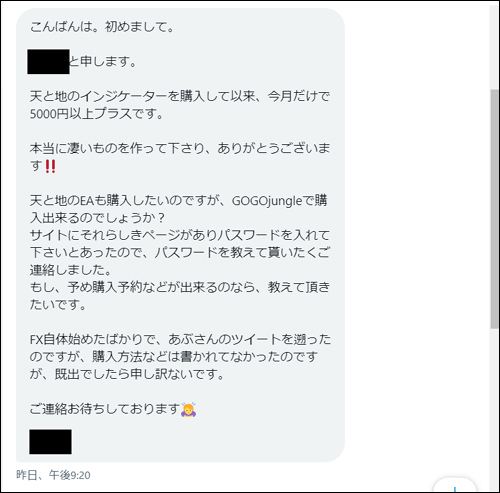
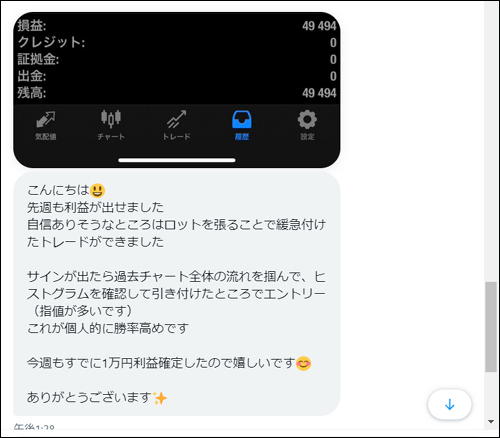
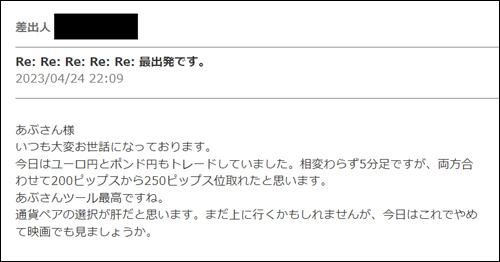
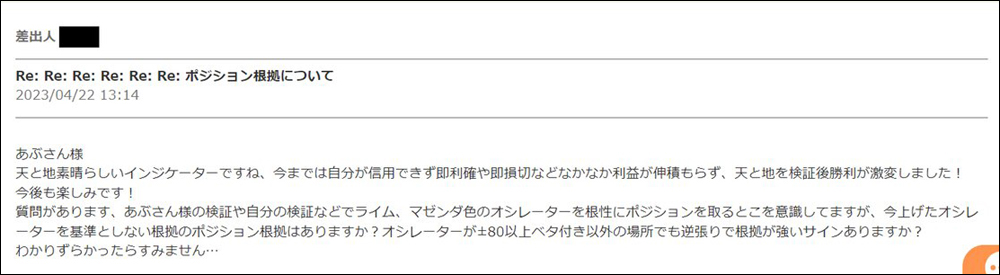
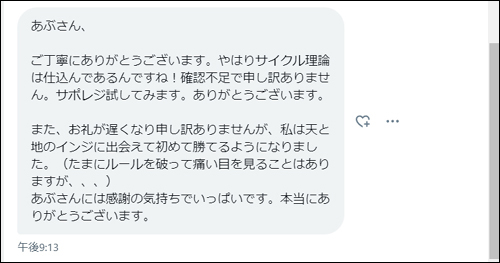
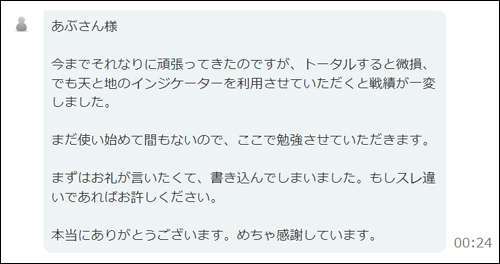
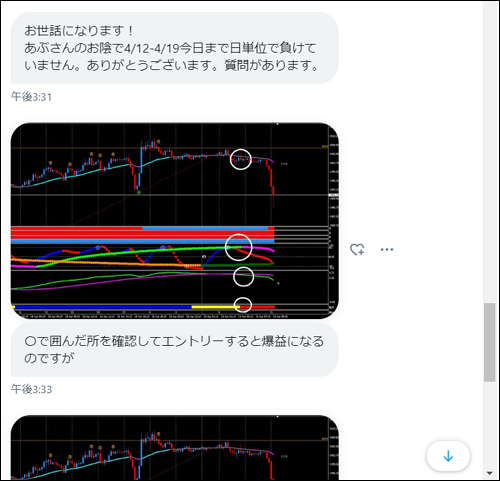
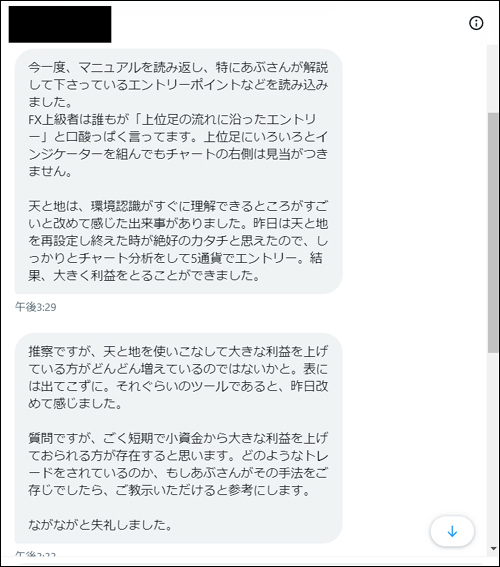
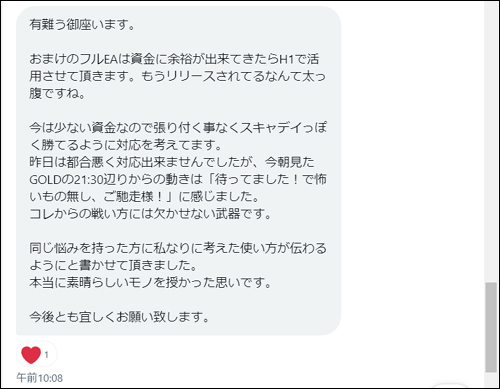
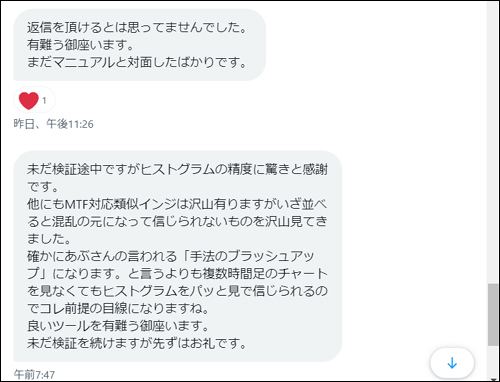
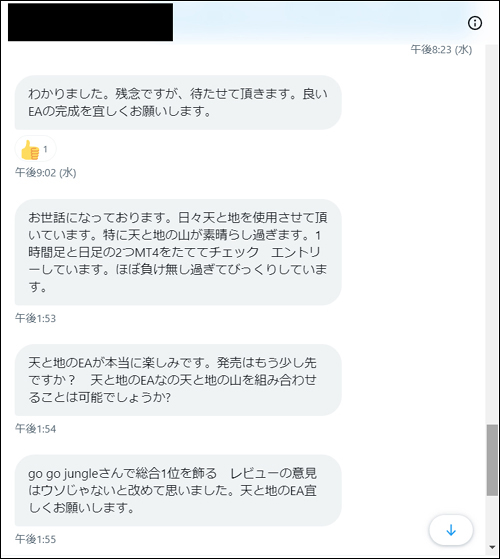


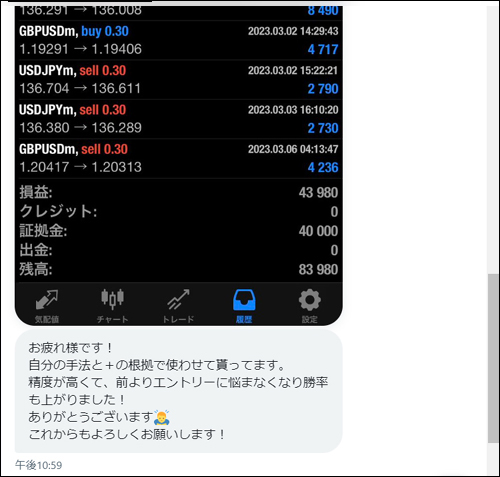
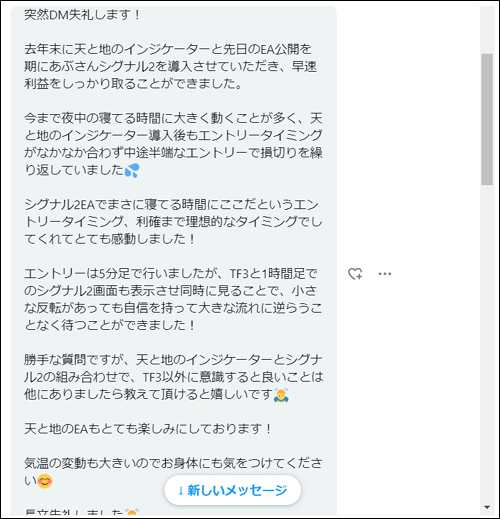
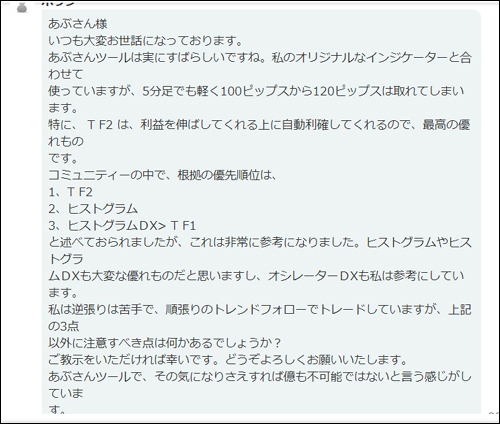
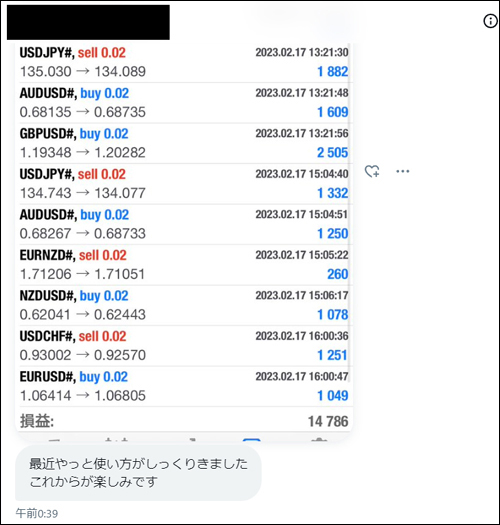
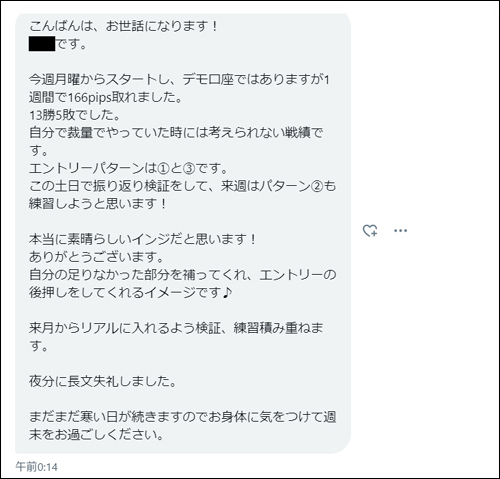
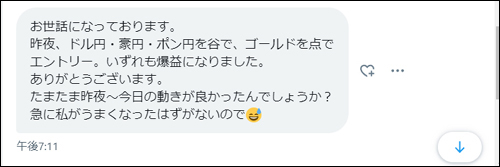
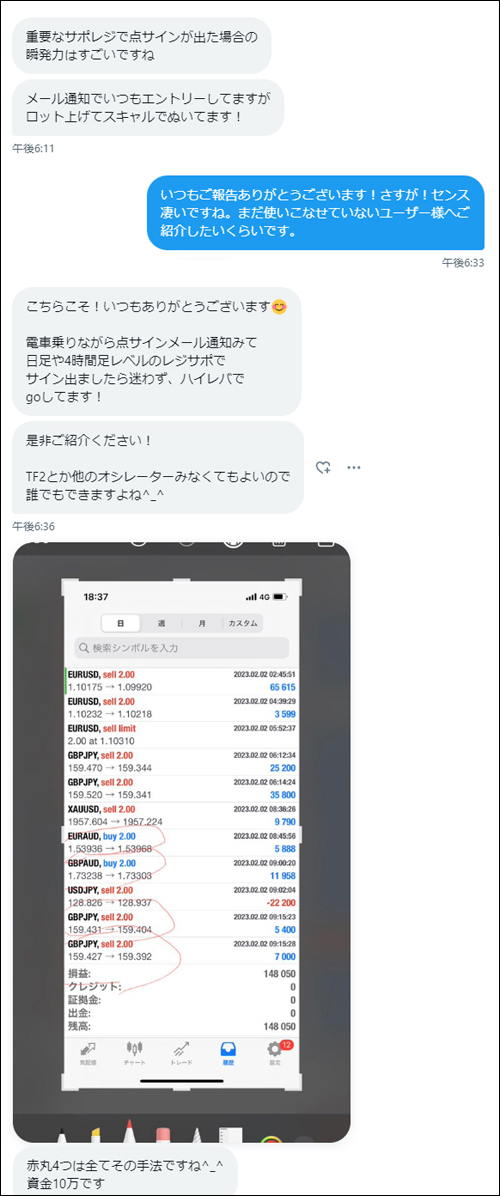
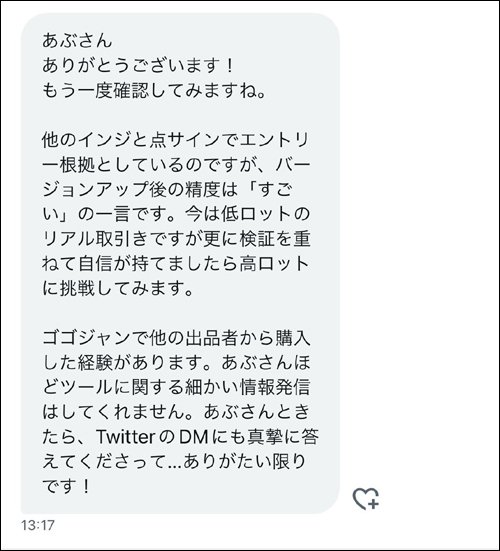
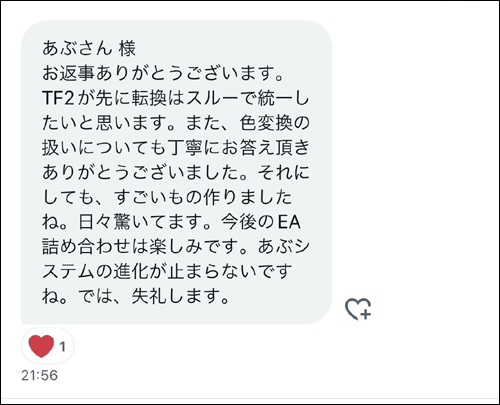
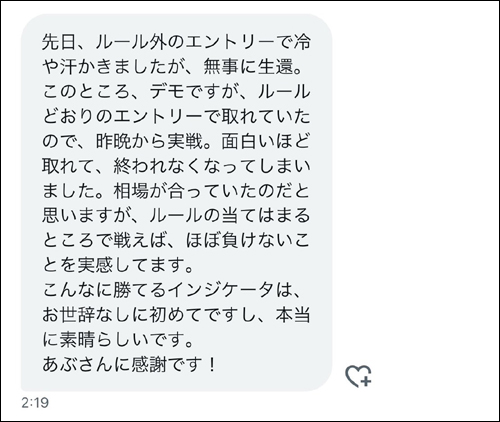
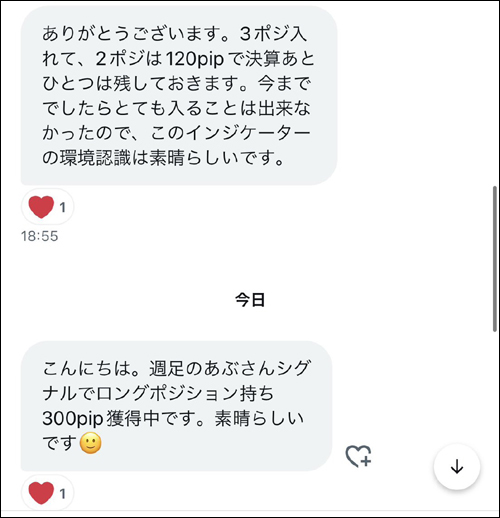
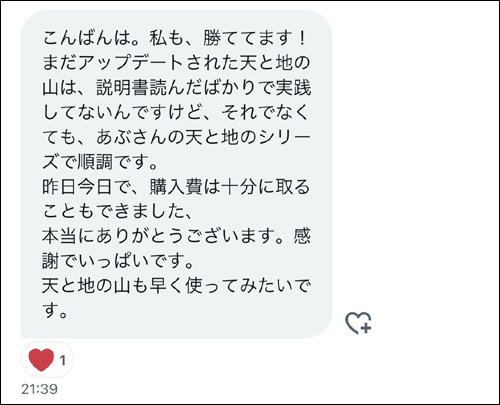
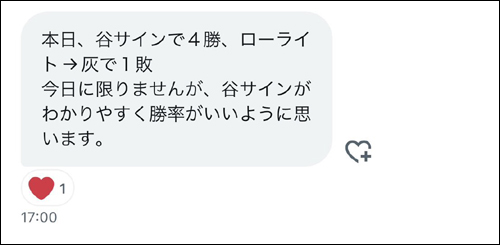
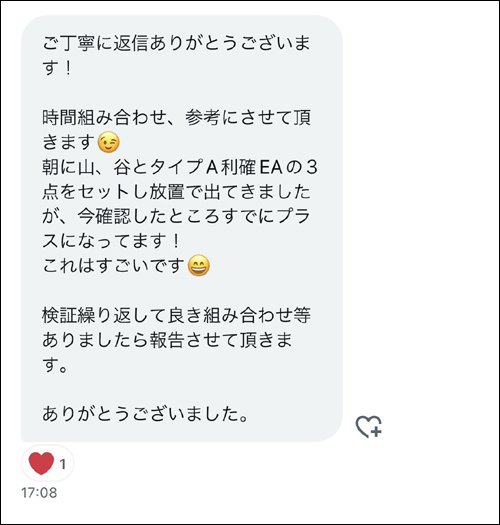
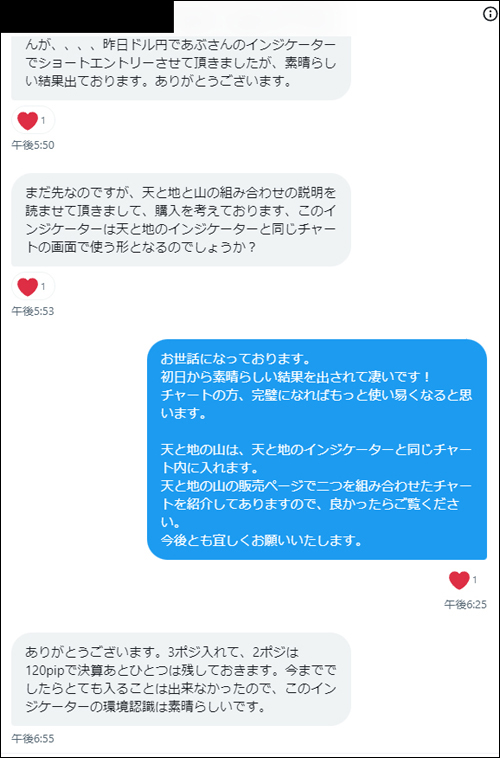
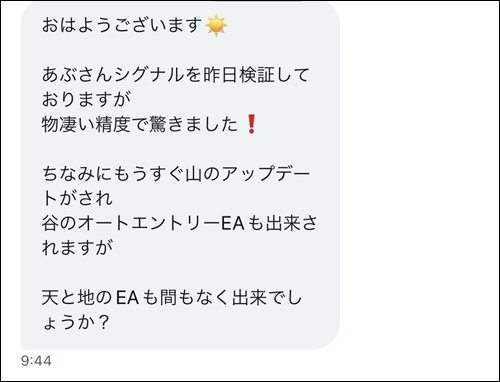
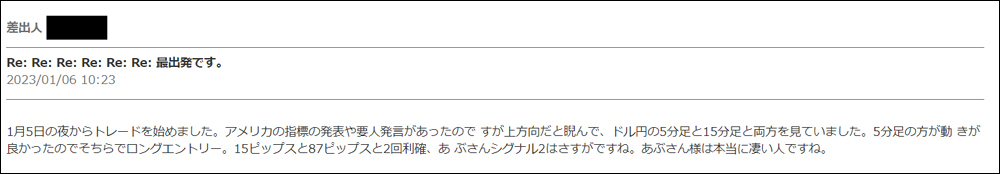
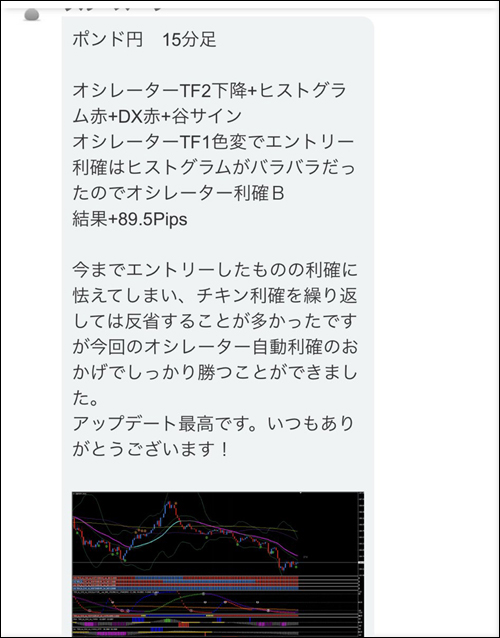
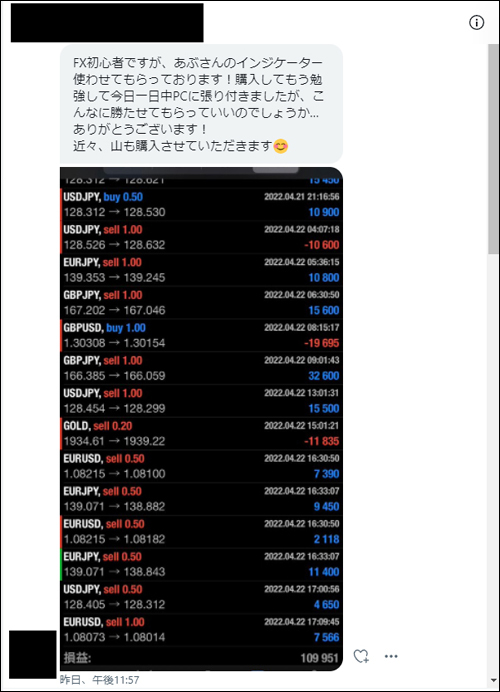
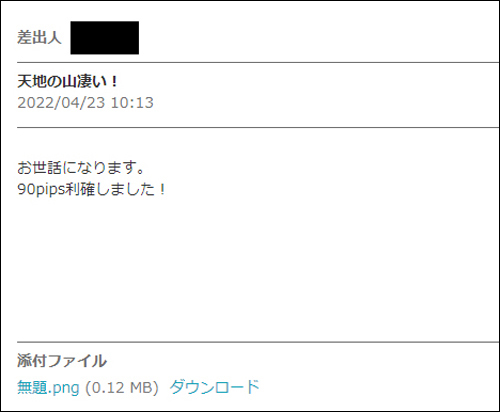
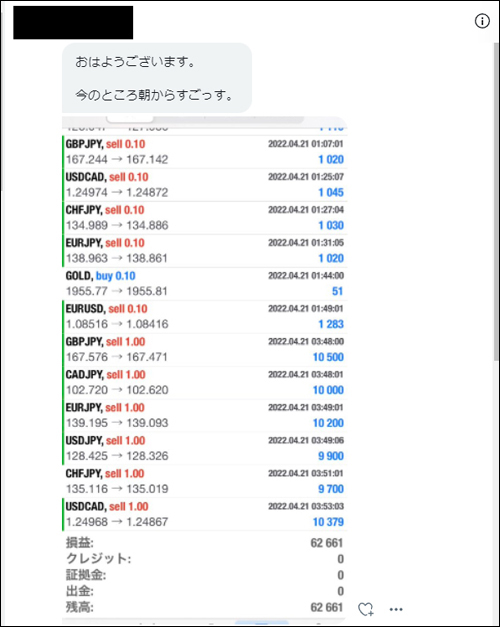
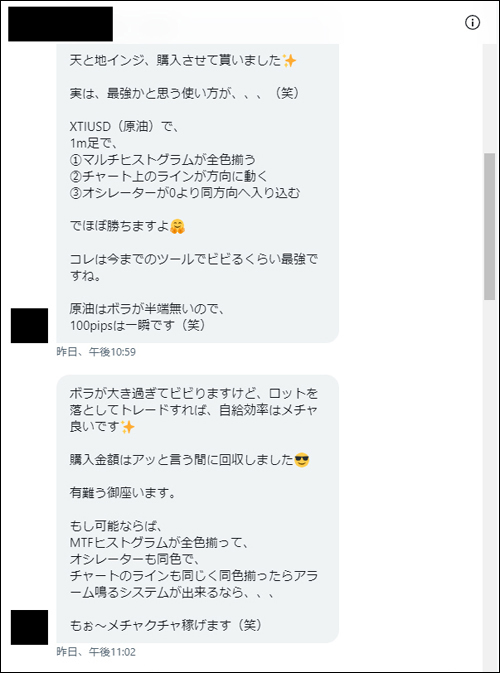
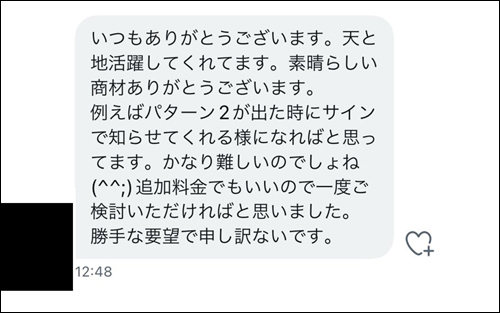
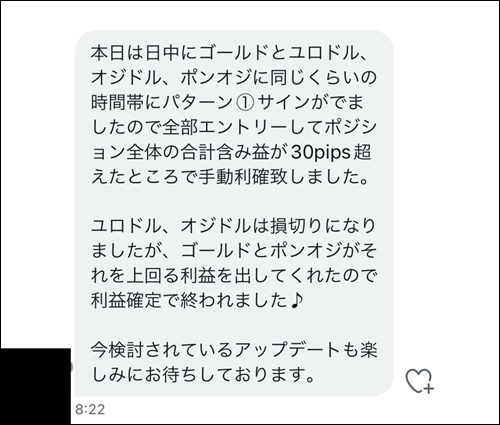
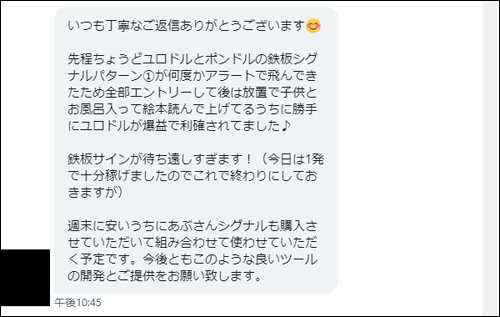
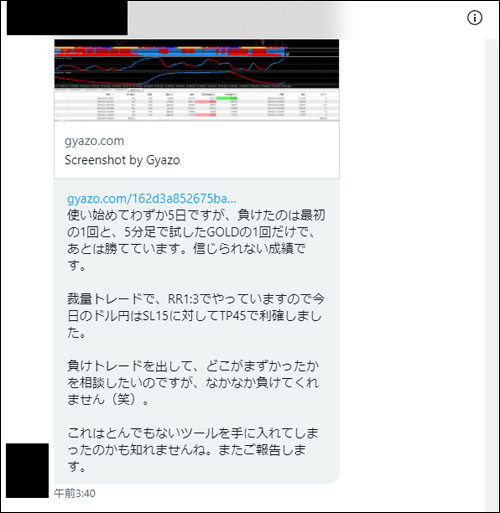
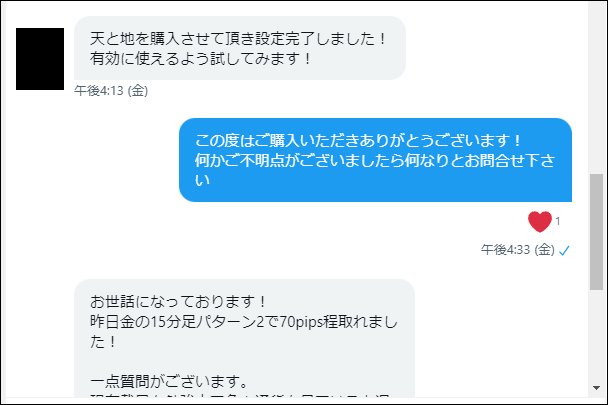
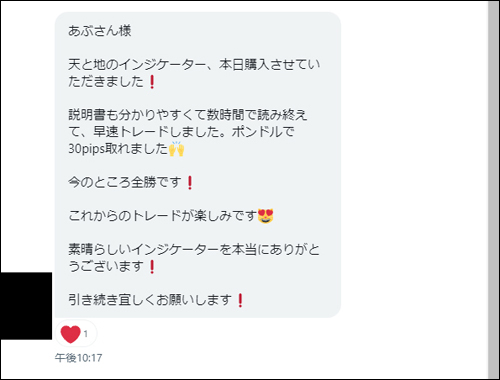
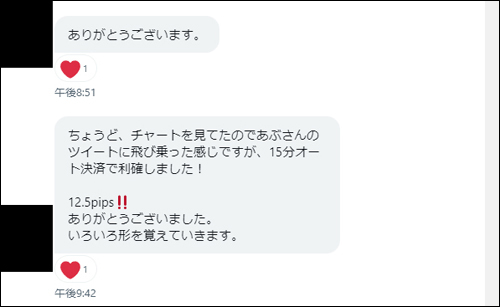
・In articles below, we introduce valuable DMs, reviews, posts from users and monitors. We select winning reports and other useful DMs, so we believe they will be参考になります for everyone. We update this regularly, so please read when you have time.
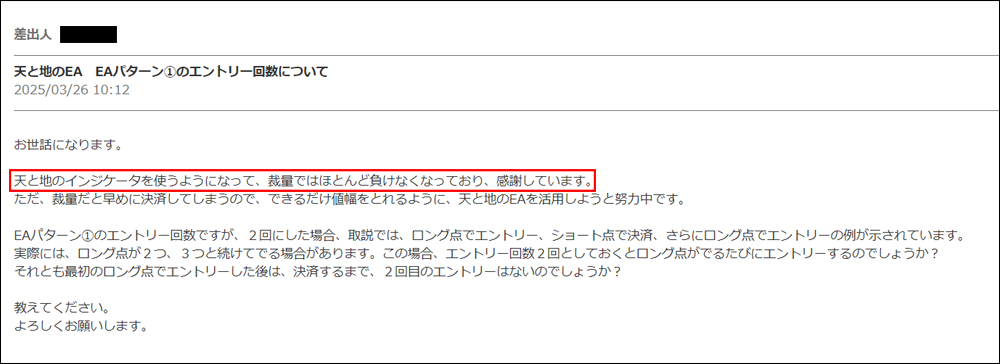
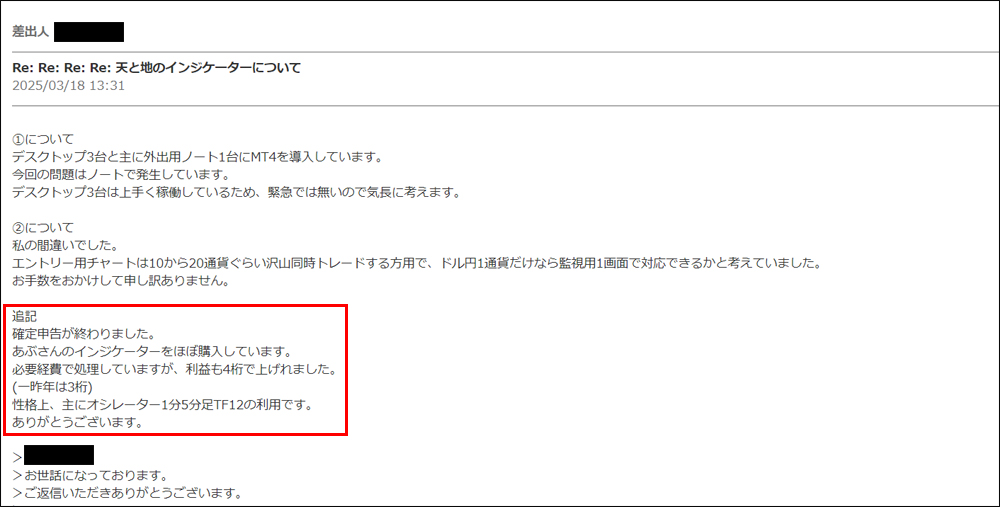
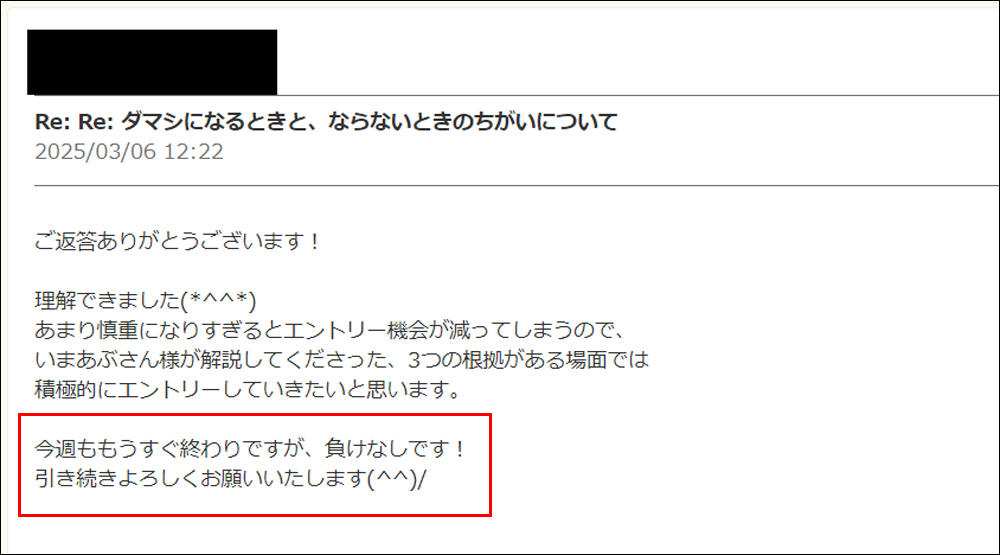
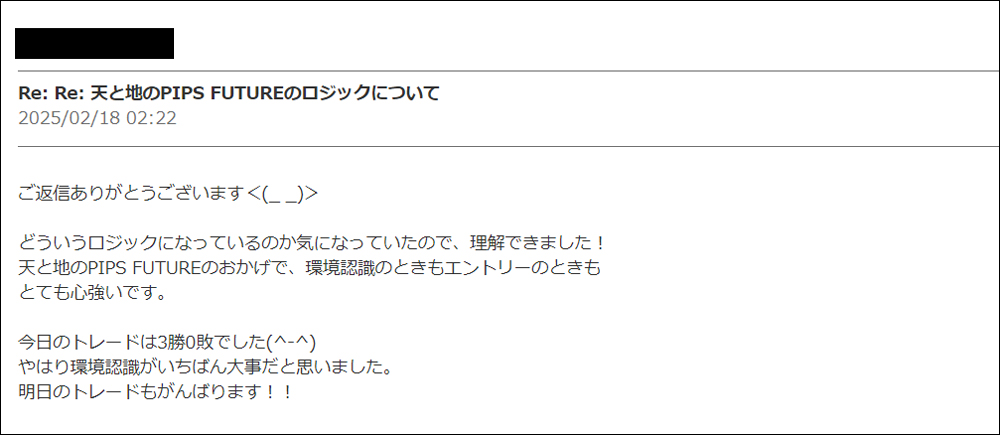
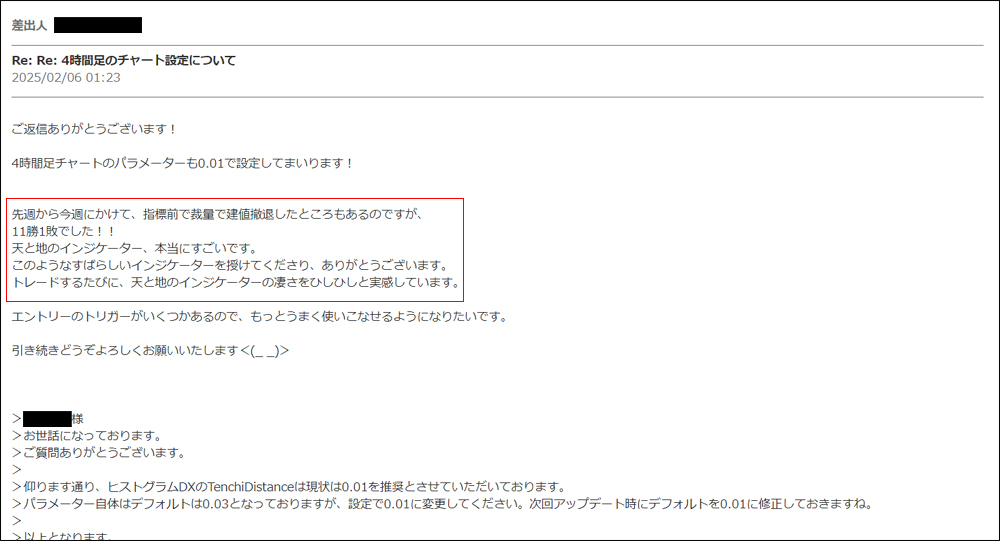
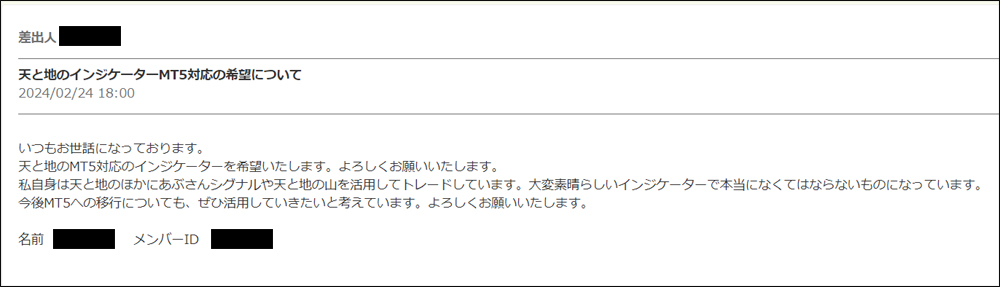
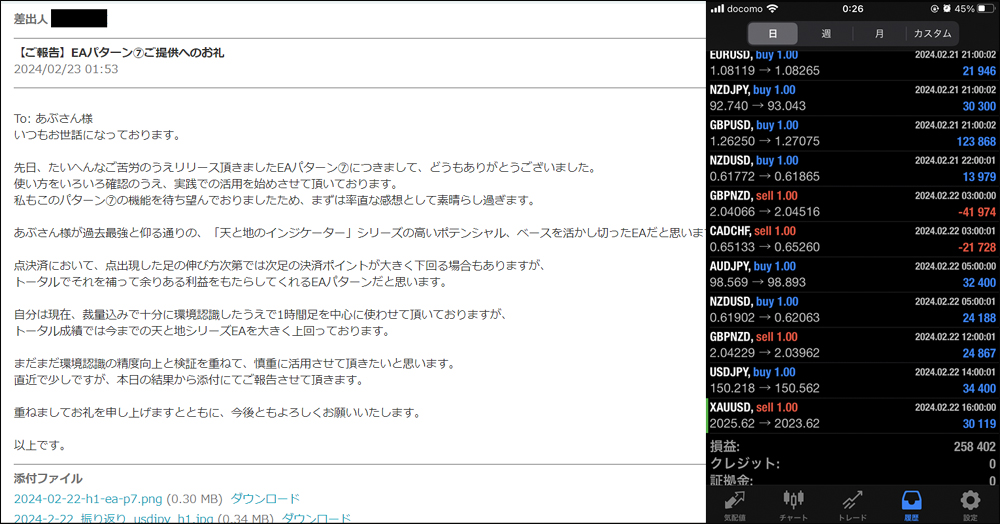
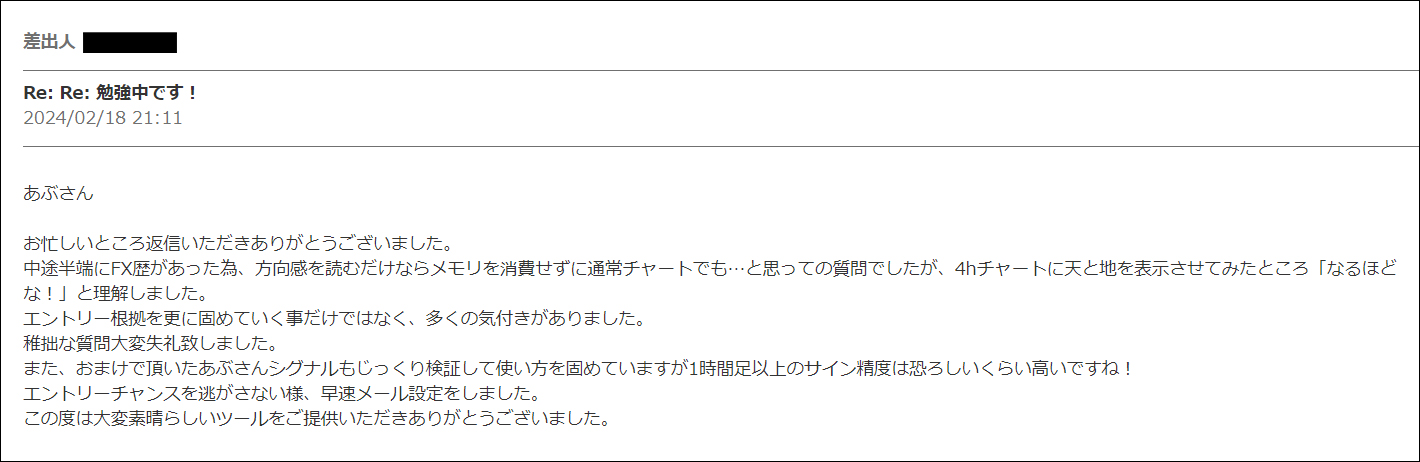
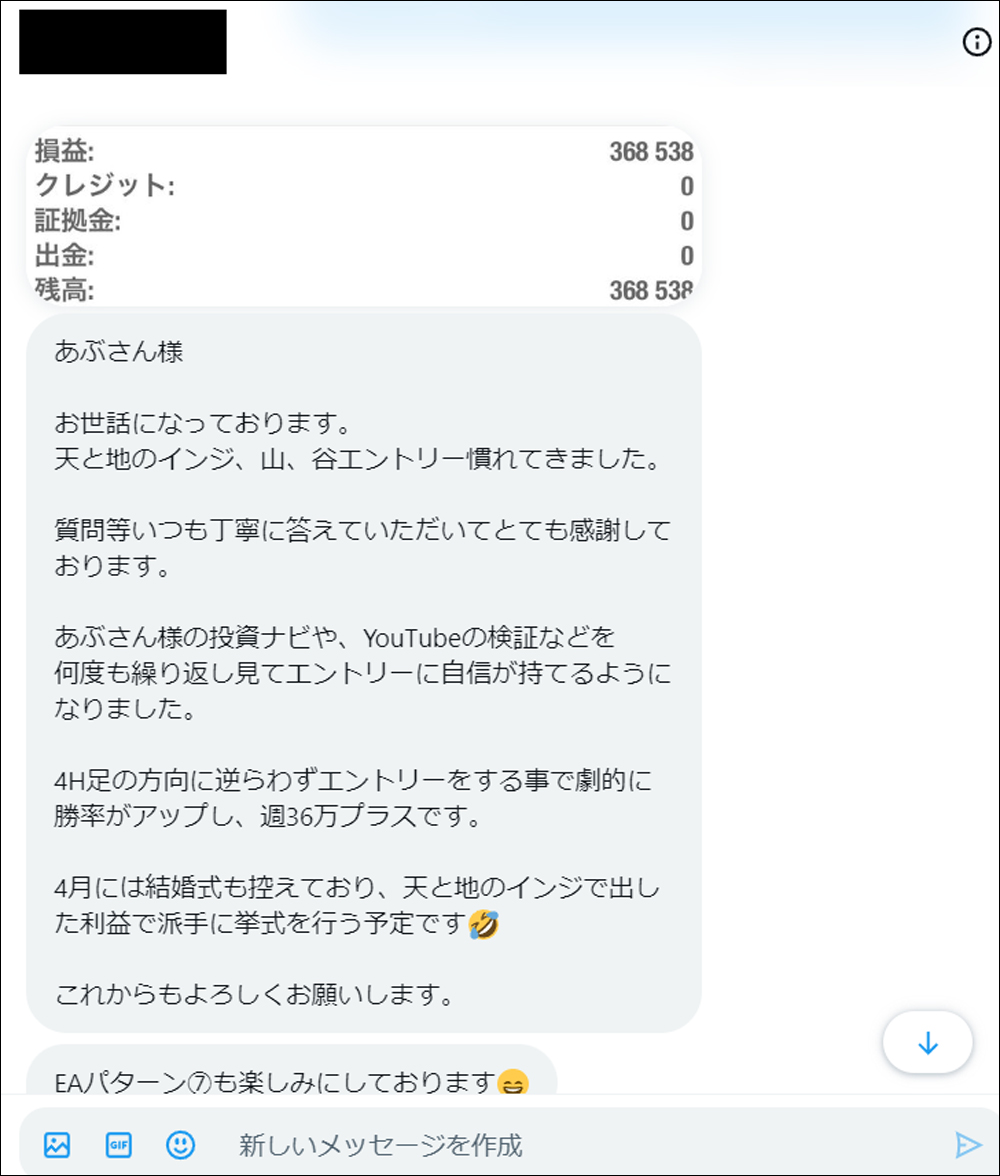
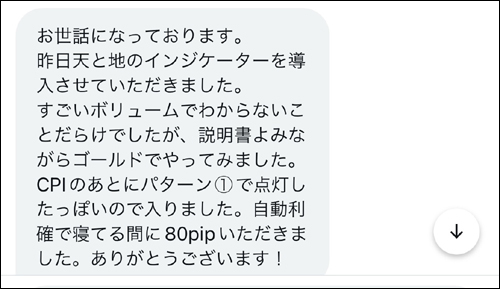
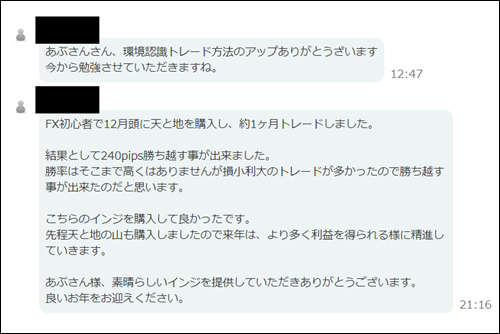
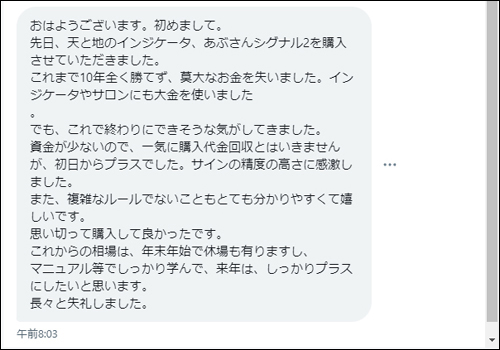
・Feedback from users who actually used the Tenshi-to-Chi indicators (Review version)
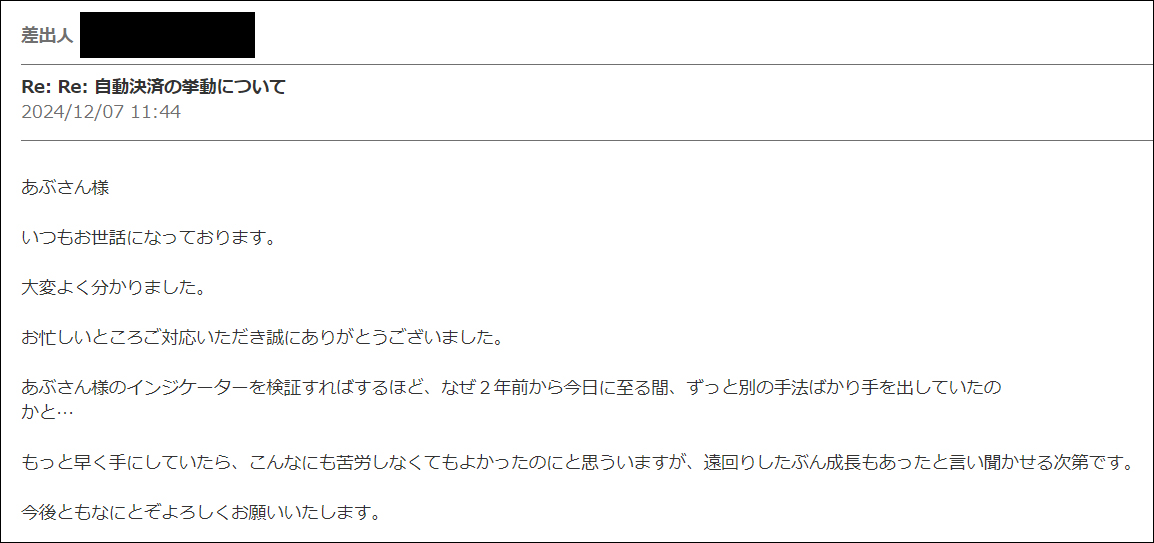
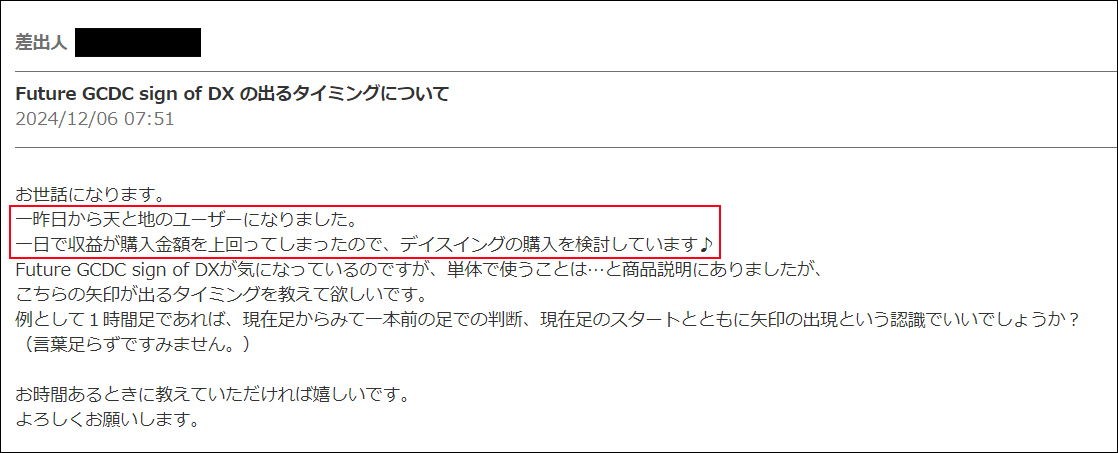
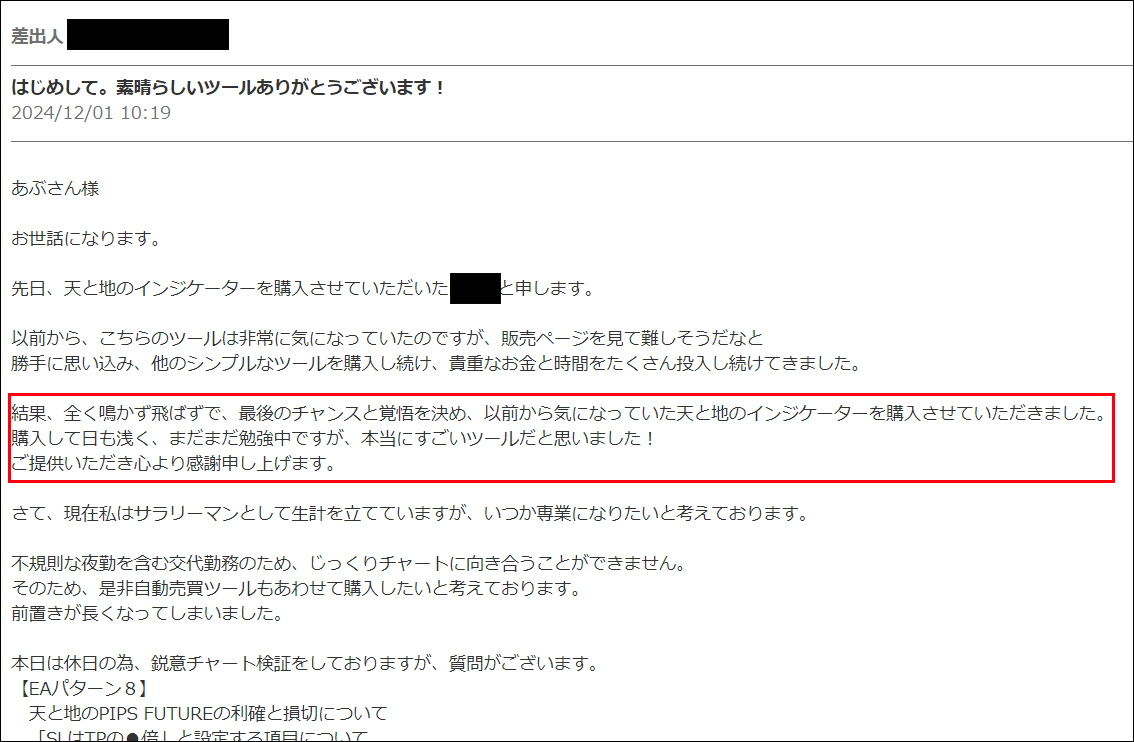
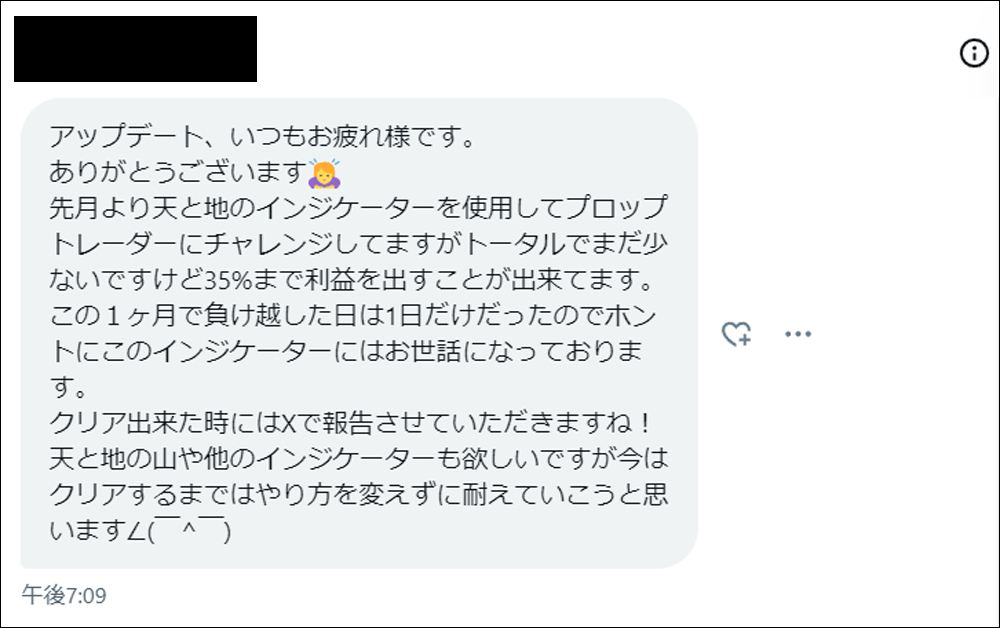
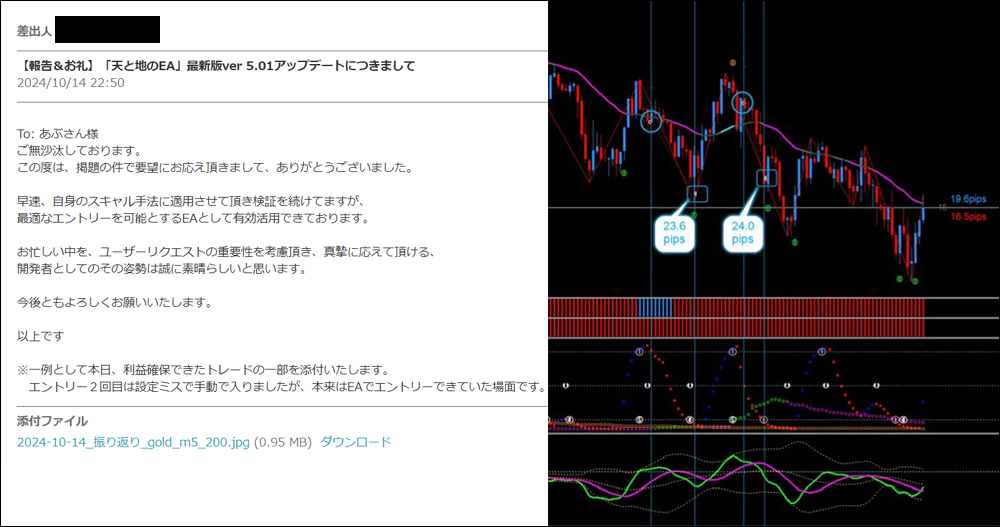
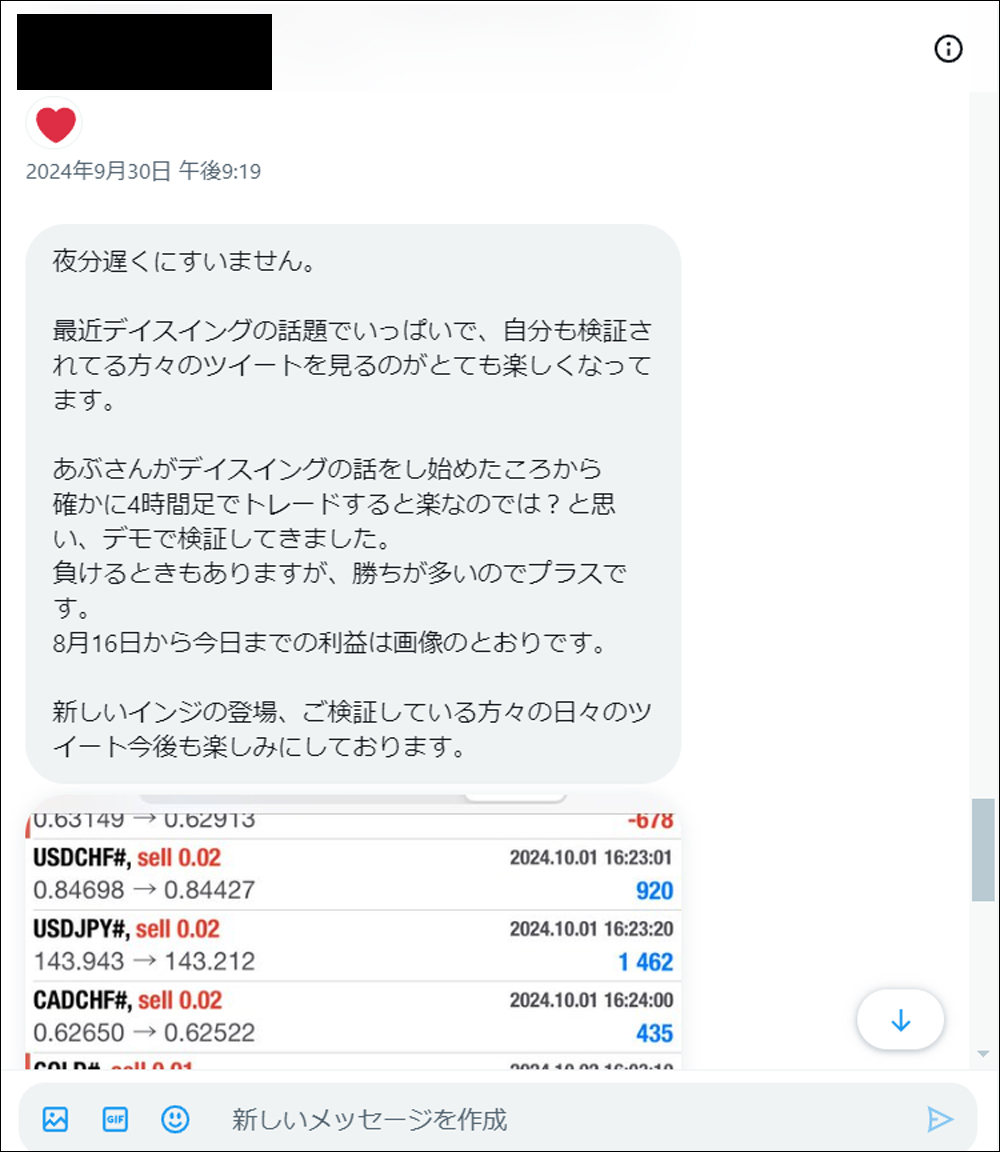
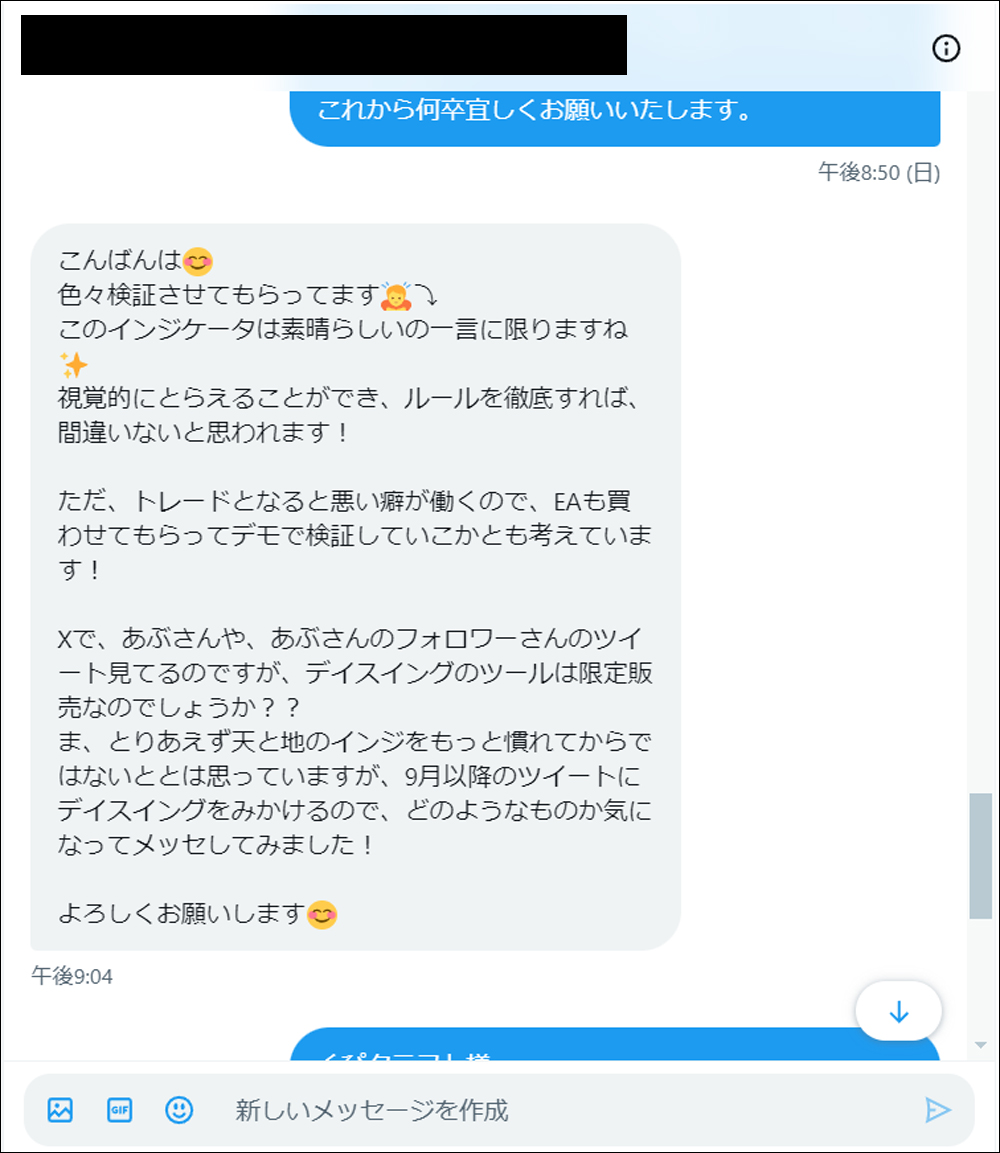
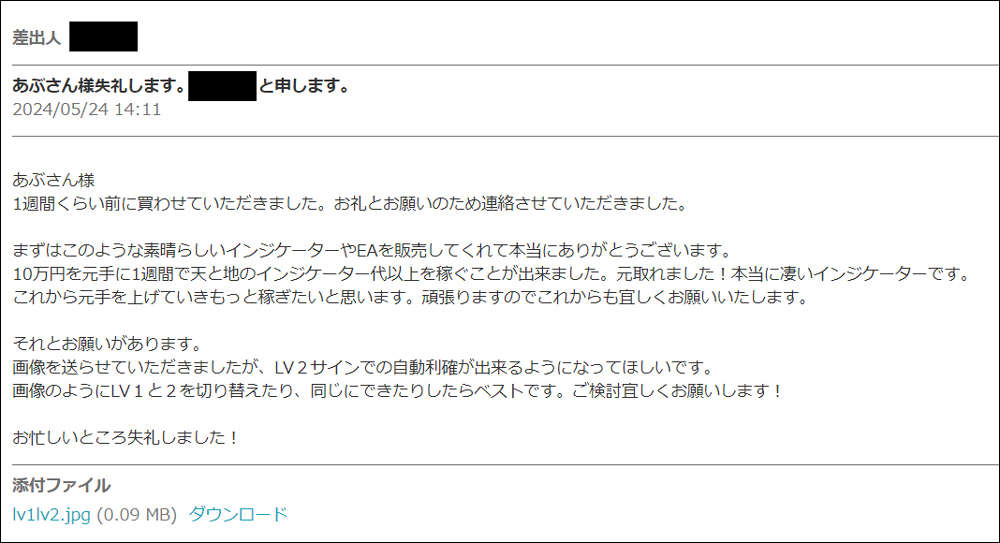
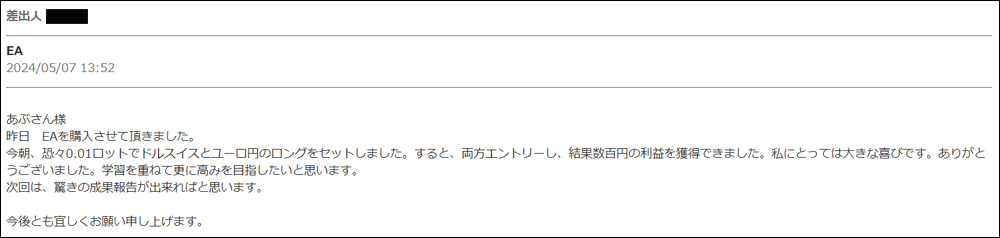
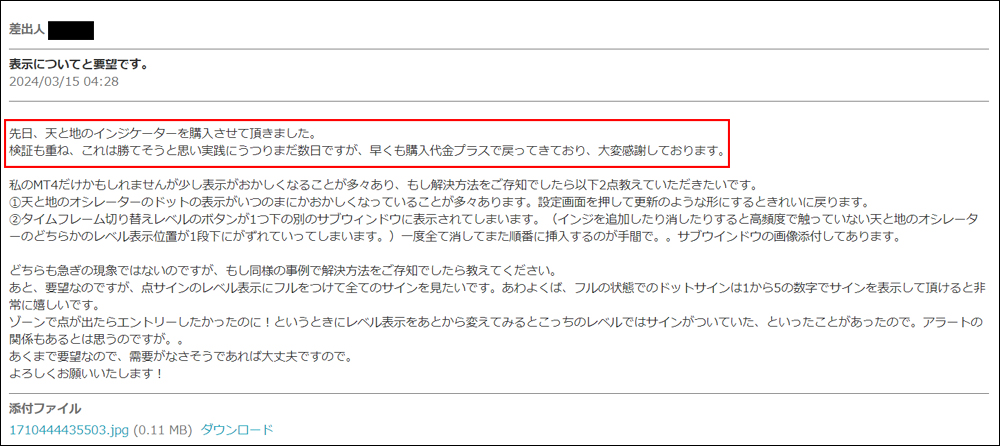
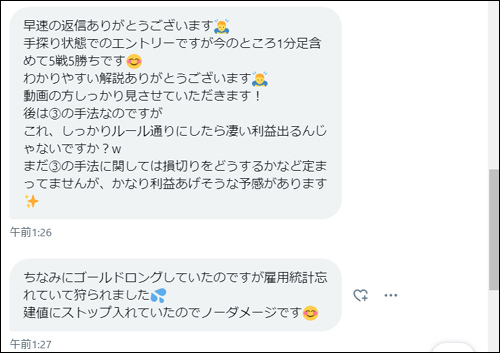
・Feedback from users who actually used the Tenshi-to-Chi indicators (DM version)
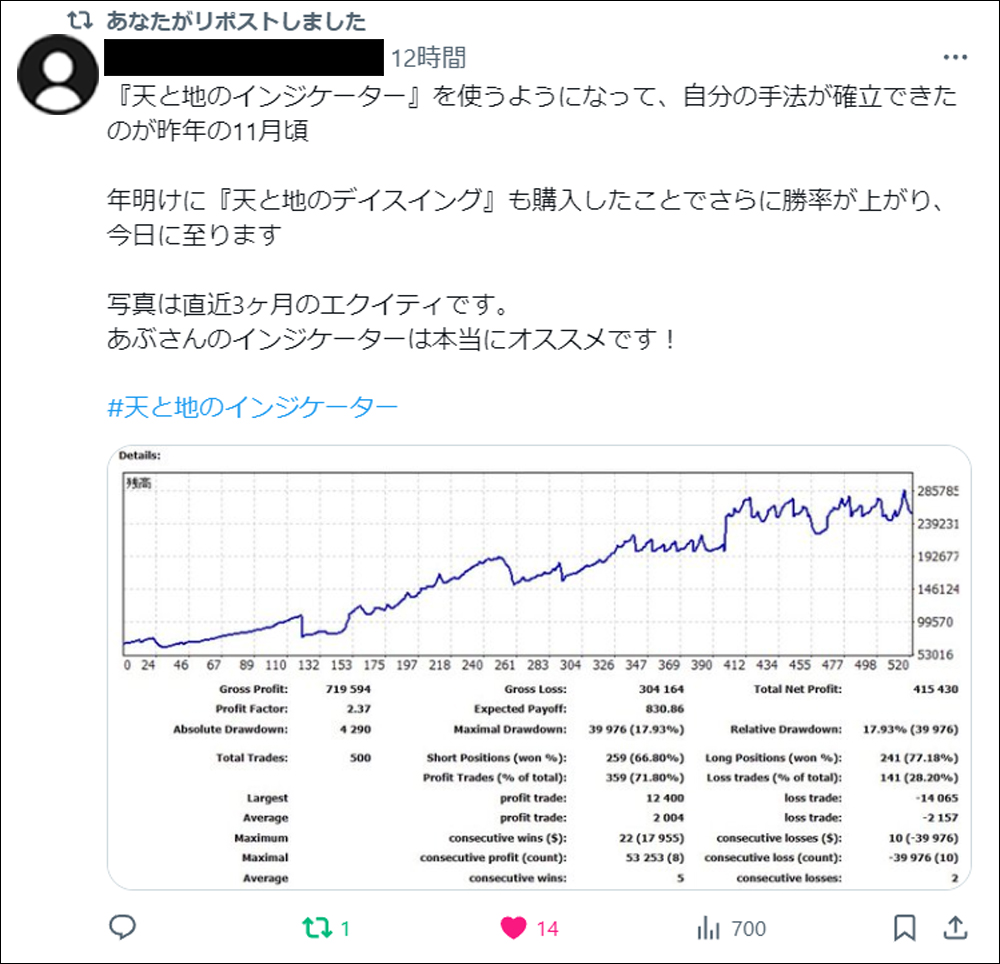
・“I searched for ‘Tenshi-to-Chi Indicator’”
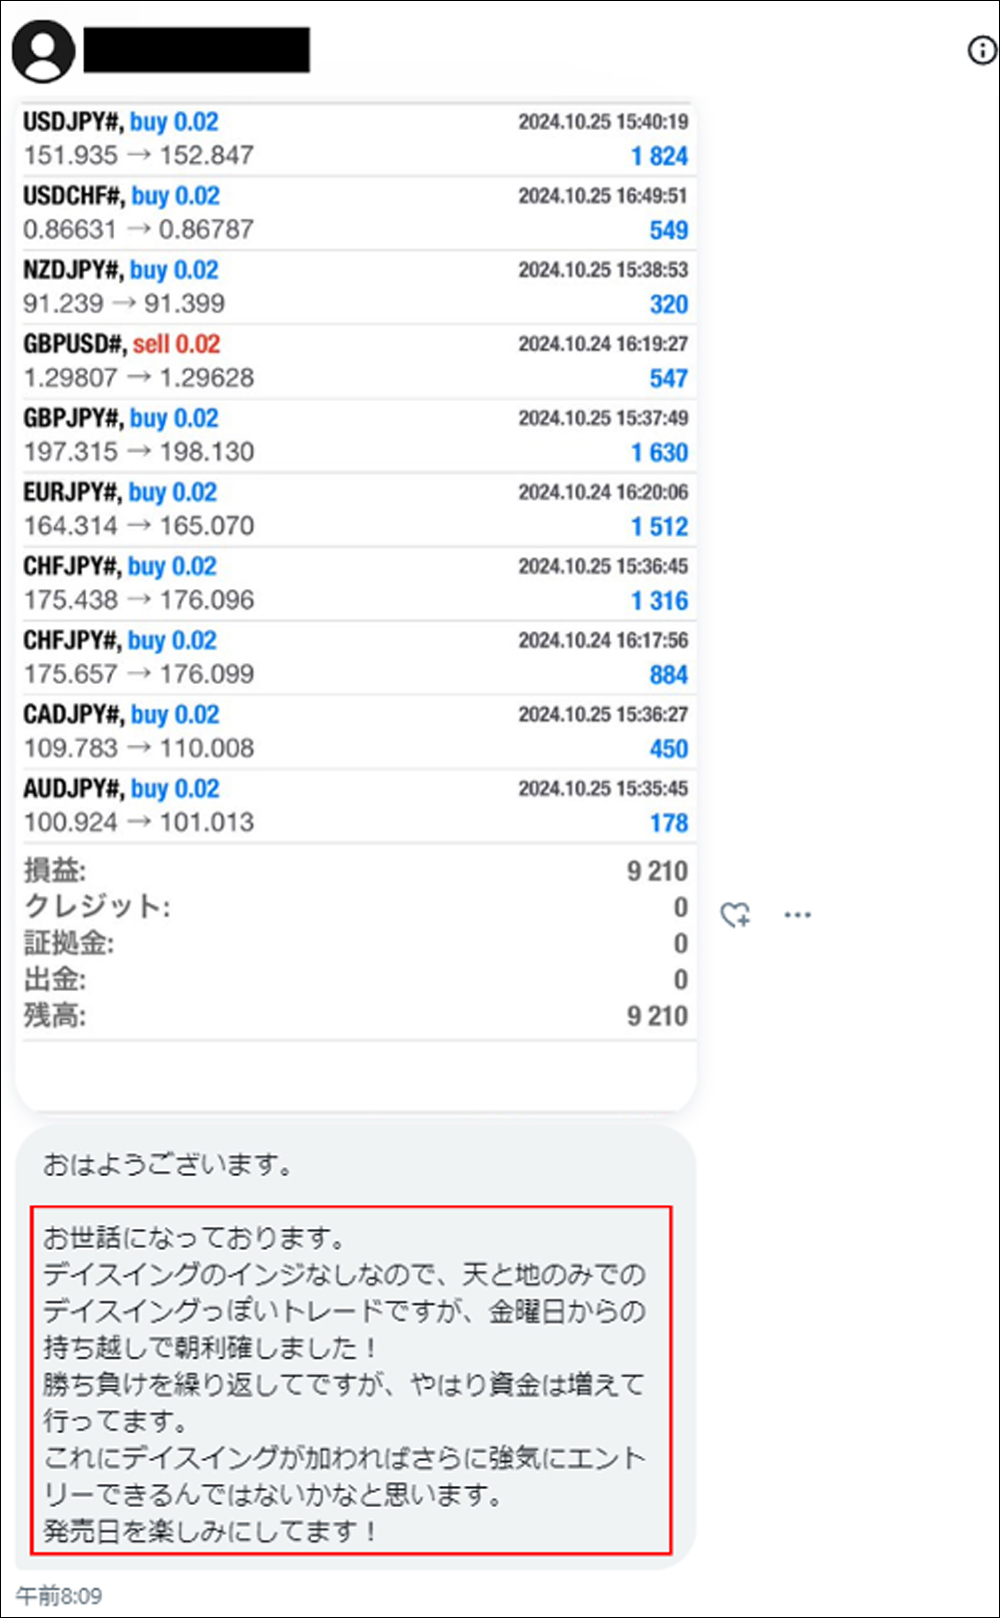
・We introduce posts from monitors who actually used Day-Signing

・The Tenshi-to-Chi Indicator is a trading method that uses an original indicator developed by me, Abusan, released in February 2022.With everyone's support,「GogoJungle Award 2022, 2023, 2024」
・In this article,「Tenshi-to-Chi Indicator」 is used to verify and discussthe method ofDay-Signing, and we will also explain thePrime Combo Signalas the entry trigger.
For the basic trading method of the Tenshi-to-Chi Indicator, please refer toarticles before August 2024.
【Abusan / Special Video Vol.1】Over 3,200 loyal users! Are you trading FX without “Tenshi-to-Chi”? Why not earn while relaxing?
【Abusan / Special Video Vol.2】Skill gap? No, equipment gap. Those who don’t use this will be vastly left behind.

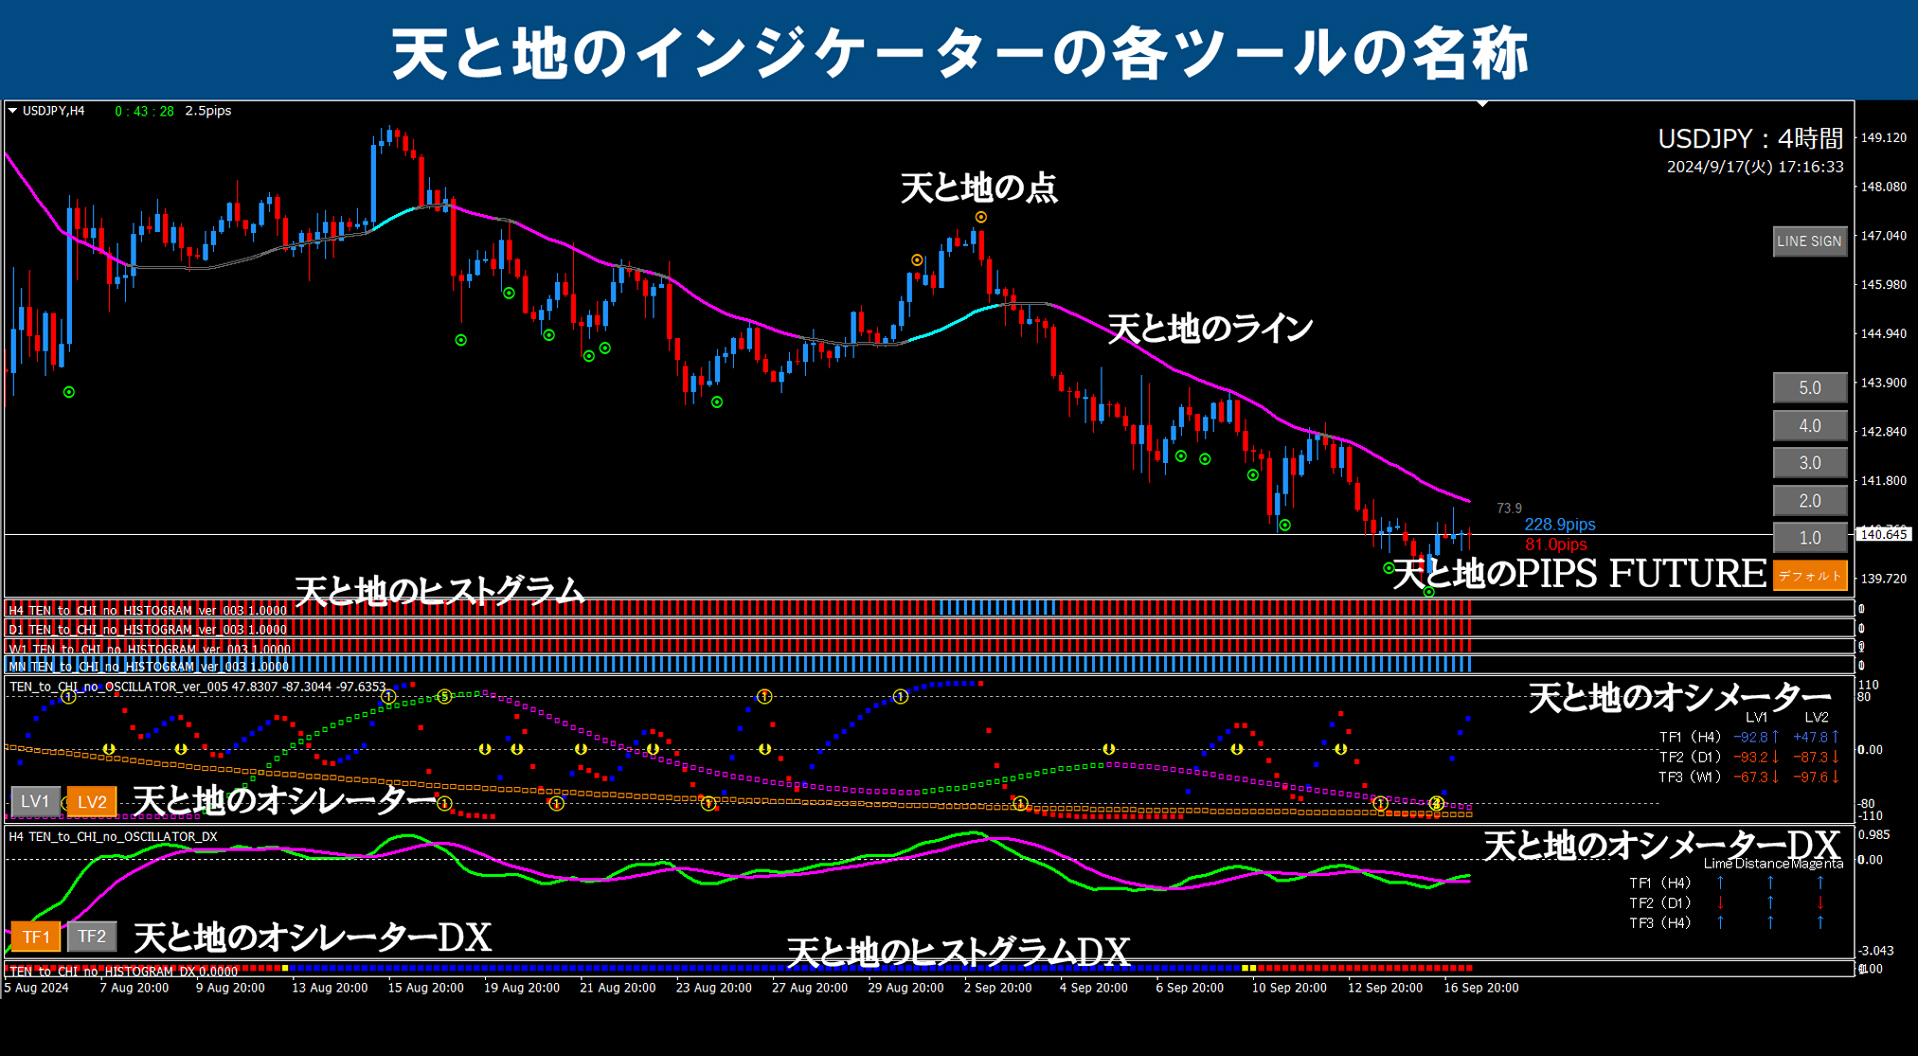
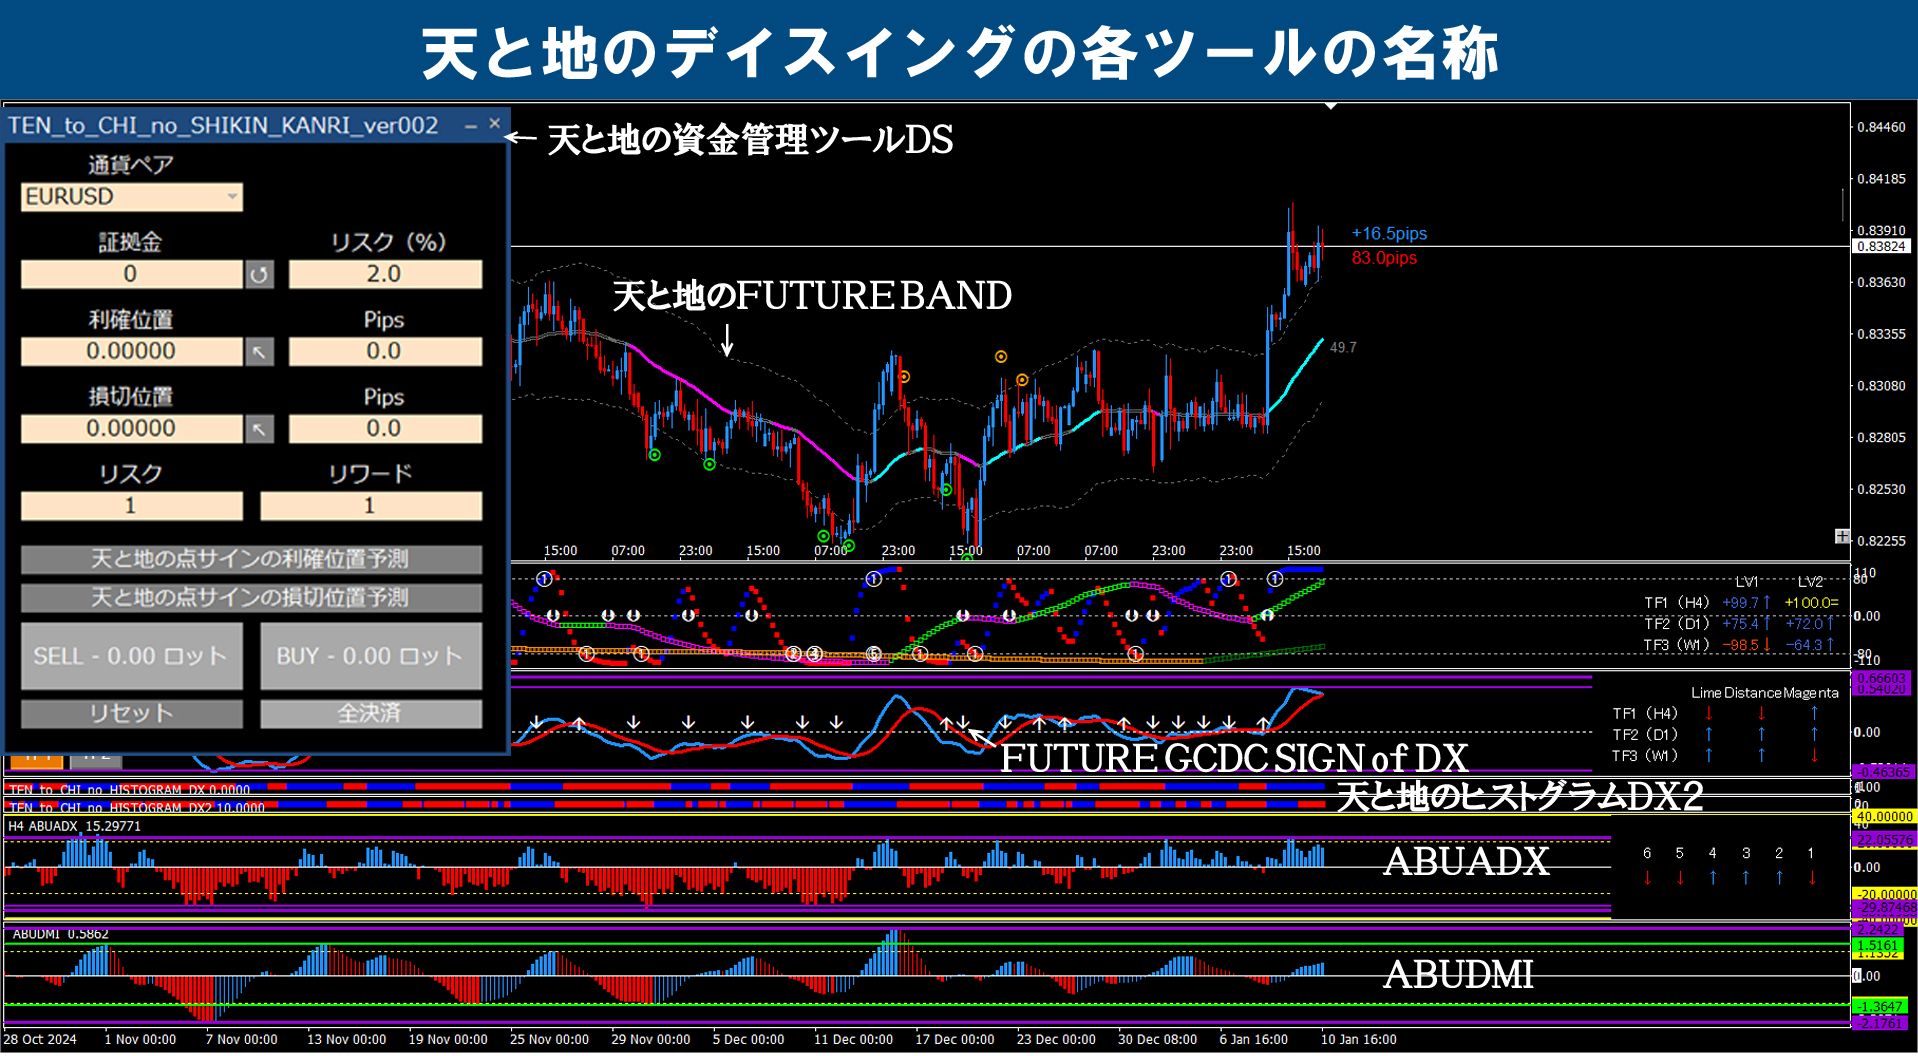
※For the specialized terms used on this blog, please refer to the images below. (All images can be enlarged by clicking.)


Gold (GOLD) / 1-hour chart + 4-hour chart + Daily historical verification
※ Yellow dotted lines are drawn on all timeframes in the same places.
※ Yellow circles indicate important points.
Clicking the chart will enlarge it.
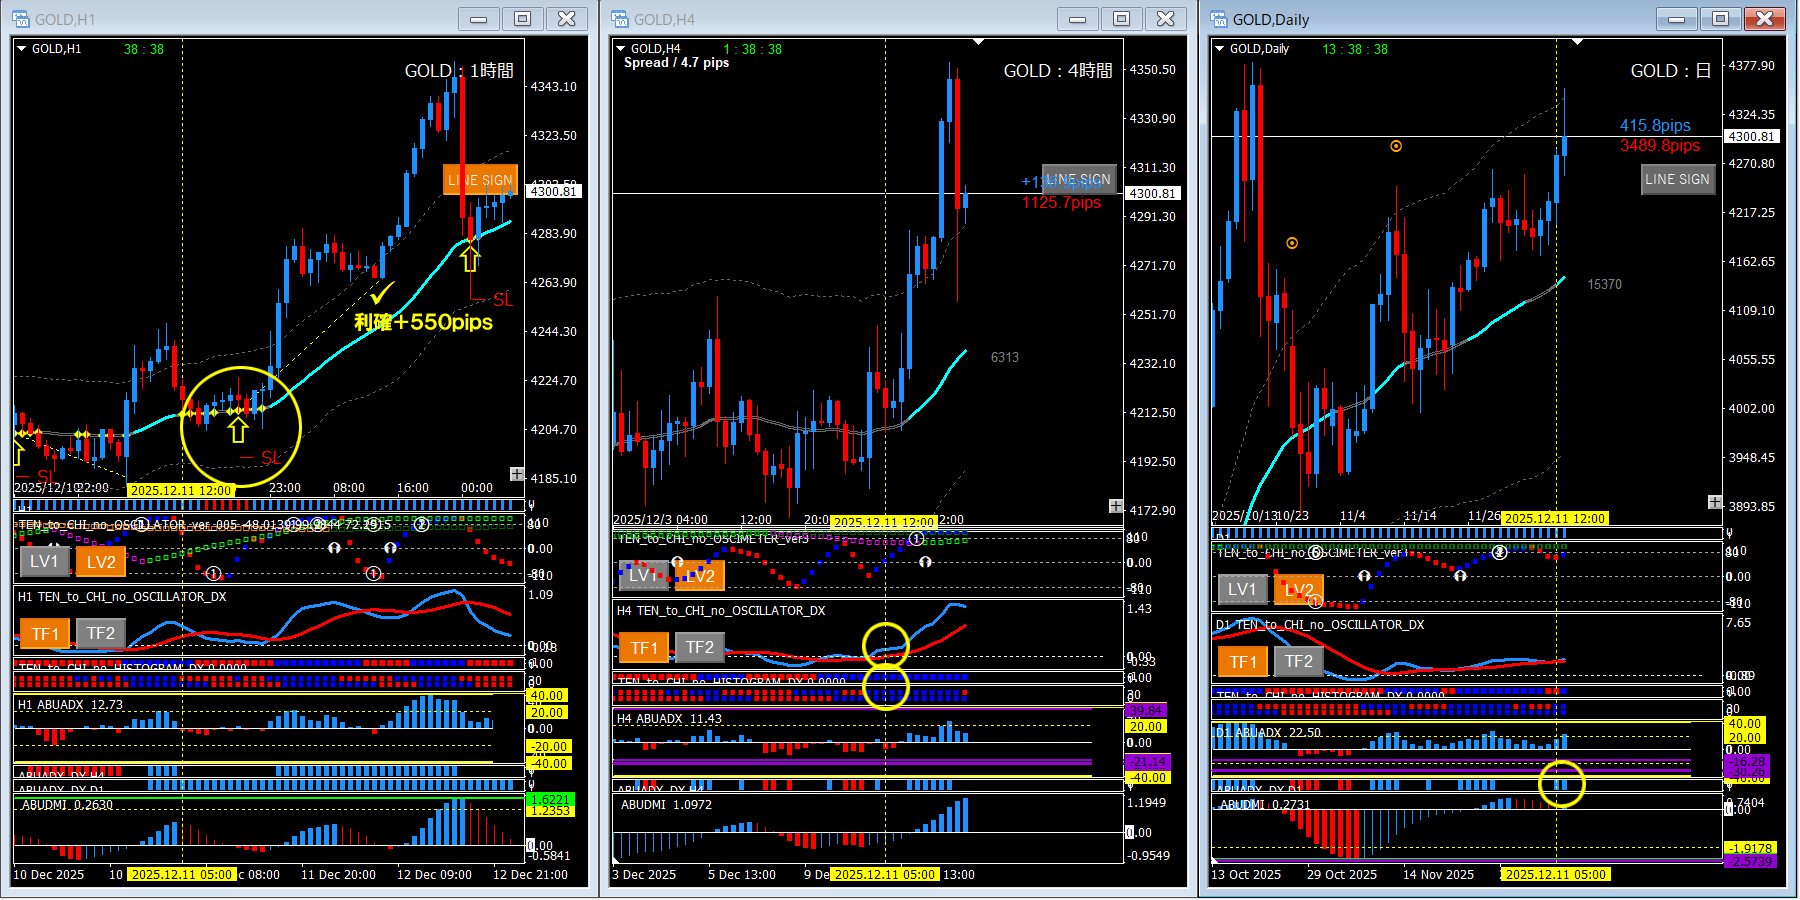
■ 1-hour chart (left: entry timeframe)
・ Prime Combo Signal
※ The parameter settings for this PuraCon are described below
■ 4-hour chart (center: environment recognition timeframe)
・ Histogram DX, DX2 (all blue)
■ Daily chart (right: environment recognition timeframe)
・ ABUADX_DX (lighting up; before confirmation)
■ Summary
This time, since the Prime Combo Signal has illuminated, we will judge whether that signal can actually be used by examining the daily and 4-hour charts. On the daily chart, ABUADX_DX is illuminated, but this is a pre-confirmation state. When checking the actual chart, it is highly likely that the PCS long signal occurs before ABUADX_DX fully appears (it may appear later as prices rise).
However, considering the other indicators on the daily and 4-hour charts collectively, the bullish view remains strong. Thus, by performing environment recognition on higher timeframes and using Prime Combo Signals, you can greatly improve the signal accuracy and conviction.
■ If using DSATEA
Since the bullish view was determined by the yellow dotted line, this is the point at which we set a long-only configuration for DSATEA on the 1-hour chart.
■ “Prime Combo Signals – Tenshi-to-Chi Comprehensive Signals – Parameter Settings” used in this chart verification.
・Entry
Line touch (instantaneous)
・Filter
Oscillator TF2 (4 hours)
ABUADX (current)
・Profit target
Point signals (point level 2.0)
・Stop loss
ABUATR (2.0)

We hope this is of some help to everyone.
If you could press the GOOD mark, it would give us energy for future work. We would appreciate your continued support and cooperation to further improve our motivation.
