

The Use of “Visualization Indicator” (Part 229)
“Visualization Indicator” Usage (Part229)
1. Further evolve the “28 Currency Pairs List Indicator” into an indicator
“8CPVisualization Indicator”to draw AUDJPY
The “8CPVisualization Indicator” includesOceaniaLondonversion,NewYorkversion,AnyCPversion. This time, I used theOceaniaversion,version.
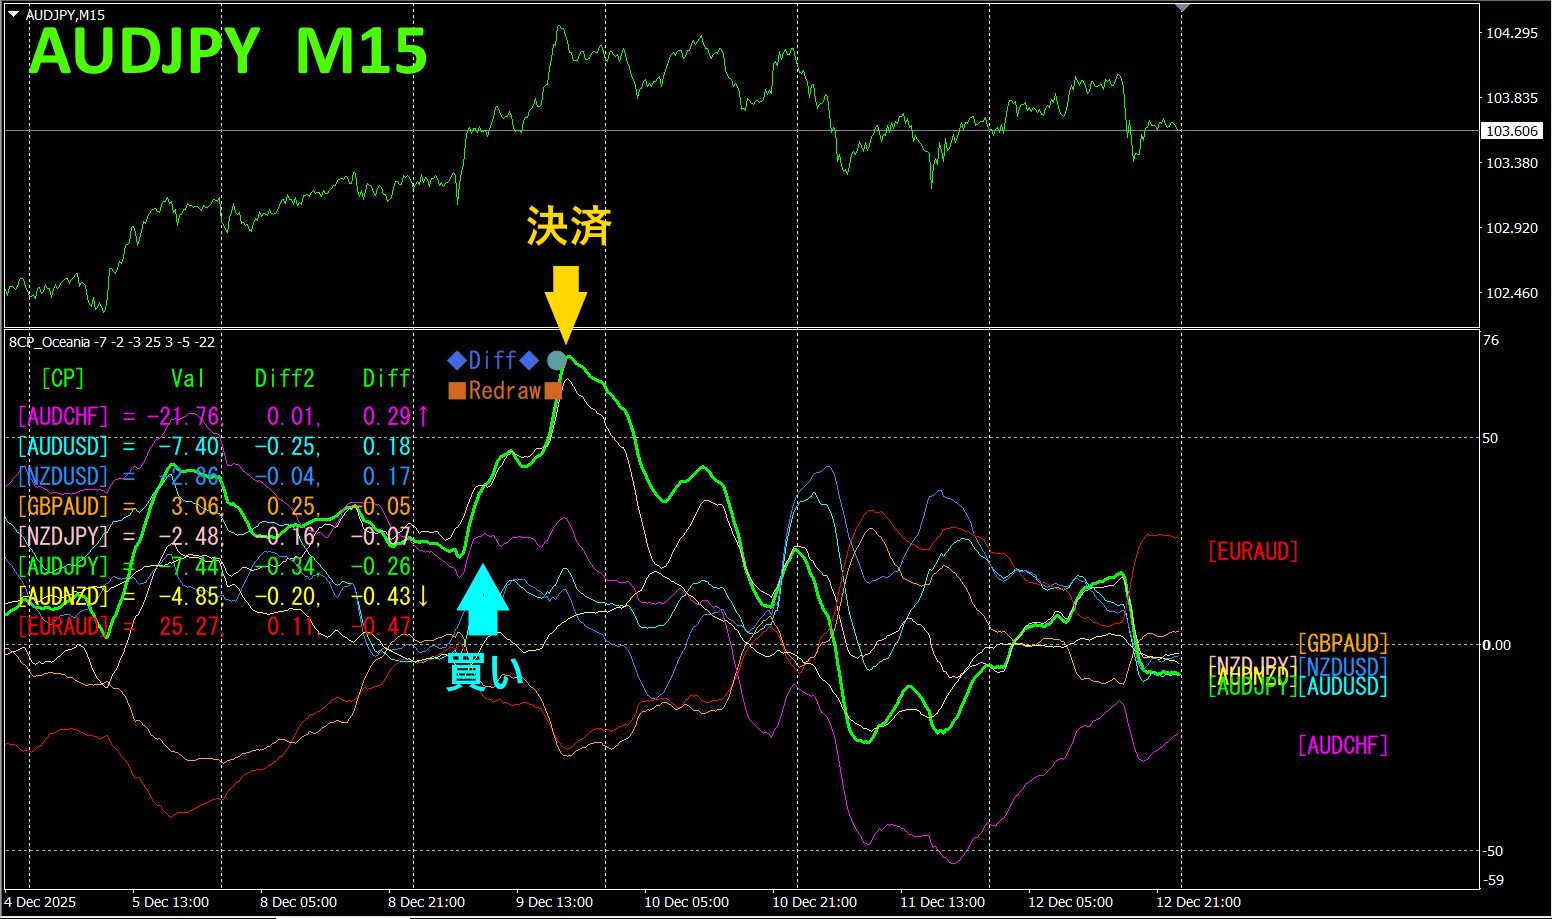
The upper half is theAUDJPY15-minute chart. The lower half is from the “8CPVisualization Indicator”; the green bold line graph corresponds toAUDJPY.
On Tuesday, the graph forAUDJPYrose above the others, so I traded long. It peaked later that night and I closed the position. Profit was about80pips.
Currency Strength Differential Graph
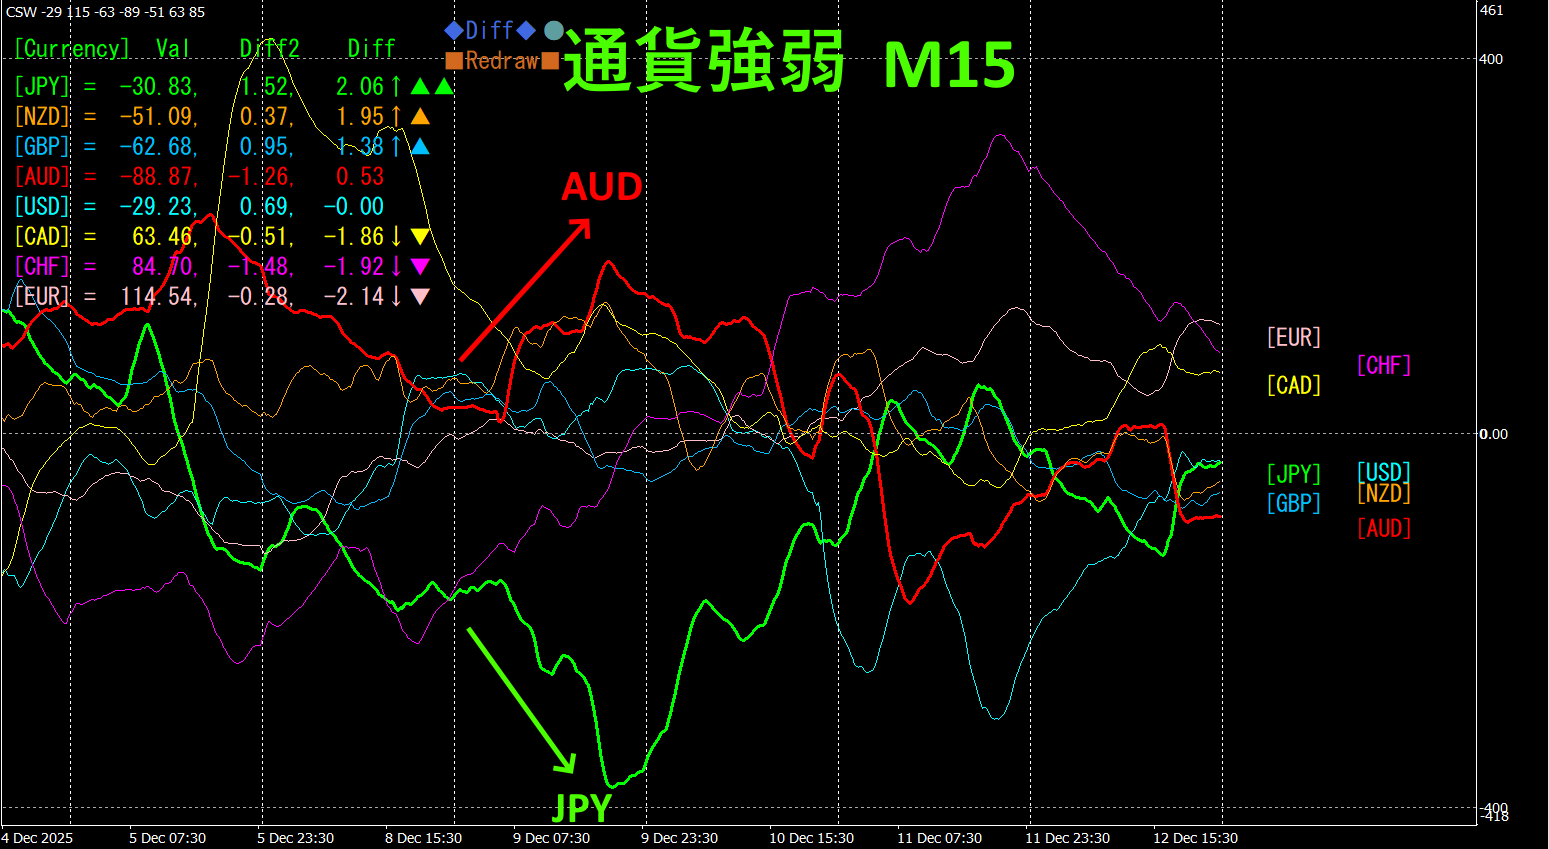
Looking at the 15-minute currency strength graph, andJPY show a clear inverse relationship.AUD andJPYAUD andJPY relationship indicates that, when, focus onAUD > JPY disperses; buy AUDJPY. It forms a very clean inverse correlation chart, so as long as the vectors of AUD and JPY diverge, hold the position.
FX trading the strongest moving currency pair with inverse correlation yields results naturally.
“Aim for Currency Strength Inversion!” isFX’s iron rule.
If you useTrendLine-EX, you can automate entries and exits on a trend line breakout. You can leave it as is for easy trading. “TrendLine-EX is a semi-automated EA that sells on a break below the trend line and closes on a break above.
2. Best SelectIndicator to try
The figure below shows the screenshot taken on2025 year month10 day01:27 (JST).
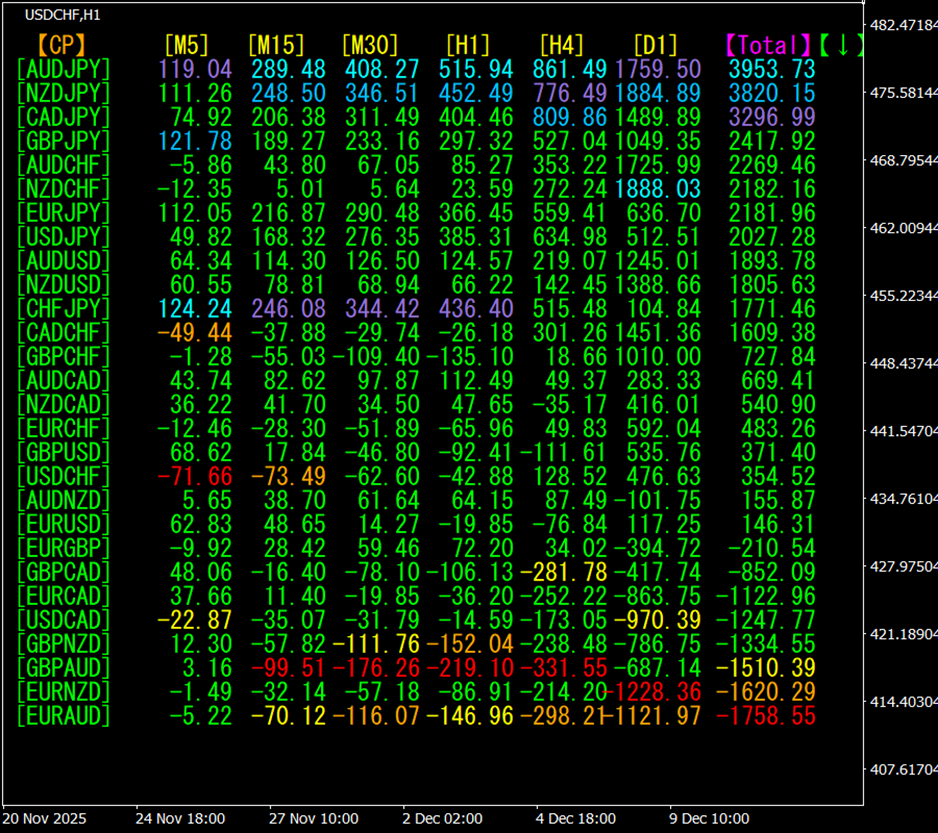
[Total]Values are arranged in descending order. The top one,AUDJPY shows blue color on all time frames.Total value is3953.73, a large positive number. This suggests an uptrend inAUDJPY.
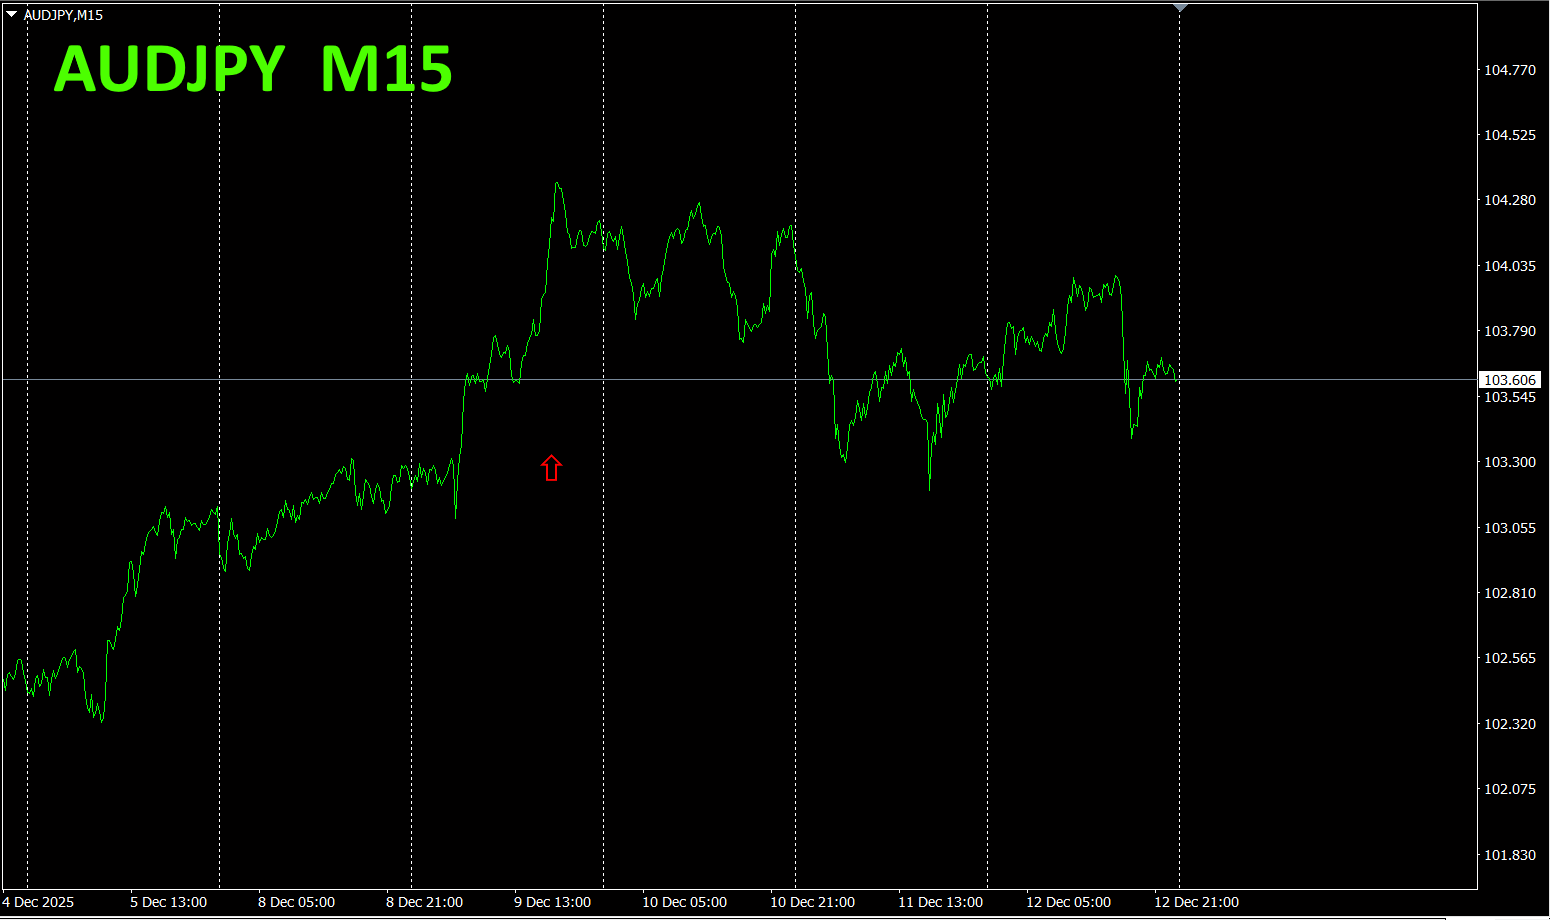
Now, let’s look at the chart forAUDJPY.
The red arrows indicate a screenshot capture location, capturing the rising portion.
The “28 Currency Pairs Best Select
The “28 Currency Pairs Best Select Indicator”.
https://www.gogojungle.co.jp/tools/indicators/35128
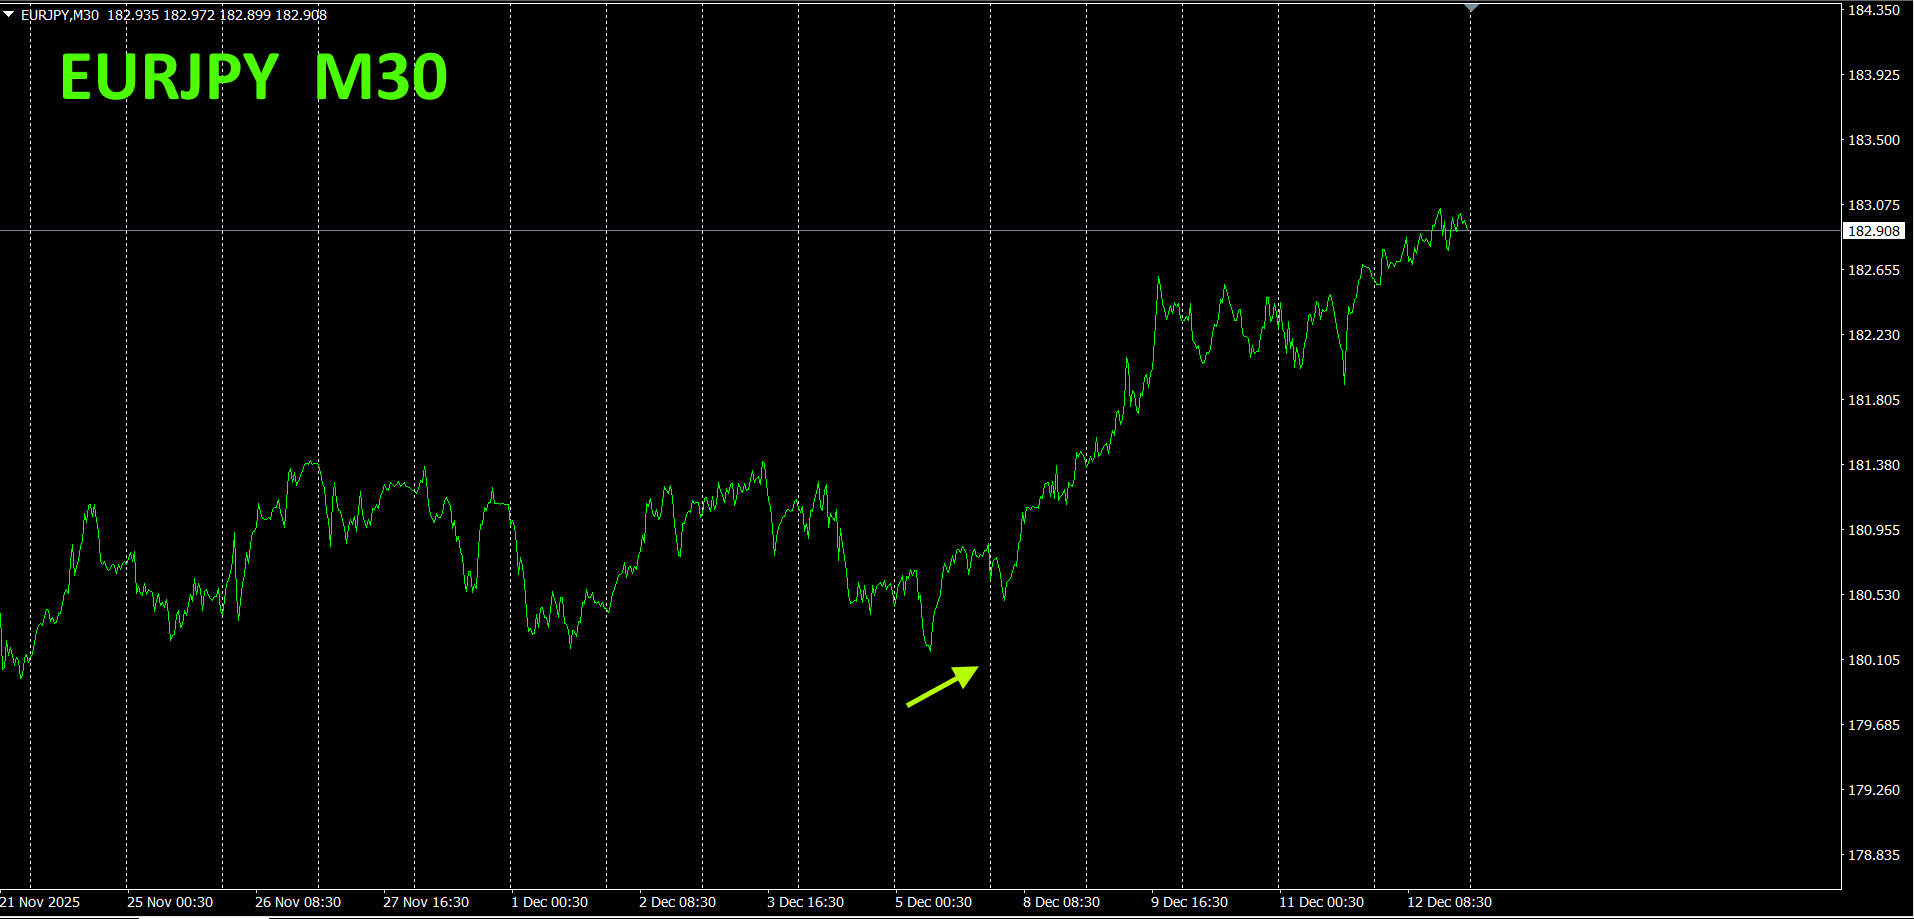
3. 2021 Year5 month onward, what happened withEURJPY? movement.
From year5 month onward, trackingEURJPY
To view overall trends, I’ve drawn about30 minutes of the most recent3 weeks.
Previously, I wrote the following.
Pink isEUR, green isJPY.EUR graph intertwines withJPY graph. The vectors show EUR is higher than JPY, so going forward it is likely to continue rising a bit.
As expected, it has risen.
30 minutes currency strength chart.
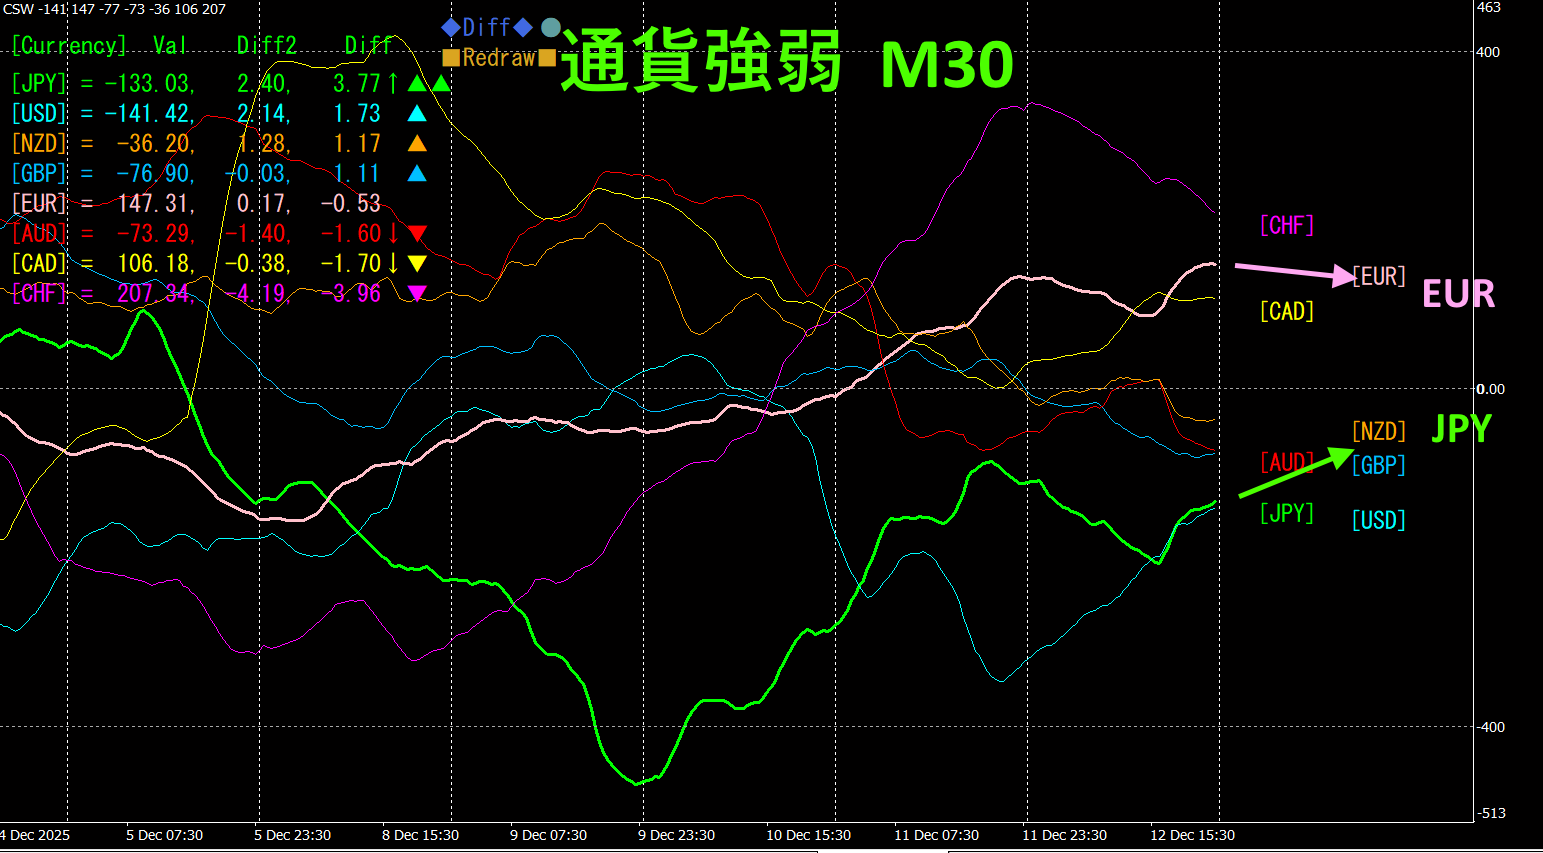
Pink isEUR, green isJPY.EUR andJPY trend horizontally. Vectors suggest EUR slight down and JPY slight up, so expect a slight downward direction.
4.New IndicatorDual_MACD_Trend_Indicator to tryed
New Indicator “Dual_MACD_Trend_Indicator” please see below.
MT4 version:https://www.gogojungle.co.jp/tools/indicators/62199
https://www.gogojungle.co.jp/tools/indicators/62202
An indicator that clearly shows the direction of the trend with color. If the color bar isLime, it’s a buy; ifRed, it’s a sell. Easy for beginners to use. If the bar color is green, it’s an uptrend; if red, a downtrend; no color means no trend. Because it uses color, you can grasp trend status at a glance.
I tried this indicator on theUSDJPY on the1 hour chart.
The buy zone in green and sell zone in red are clearly separated for easy trading. Buy in the green ellipse area, sell in the red ellipse area for smooth profits. With “Dual_MACD_Trend_Indicator, you can focus trades only on the parts where the trend is strengthening.
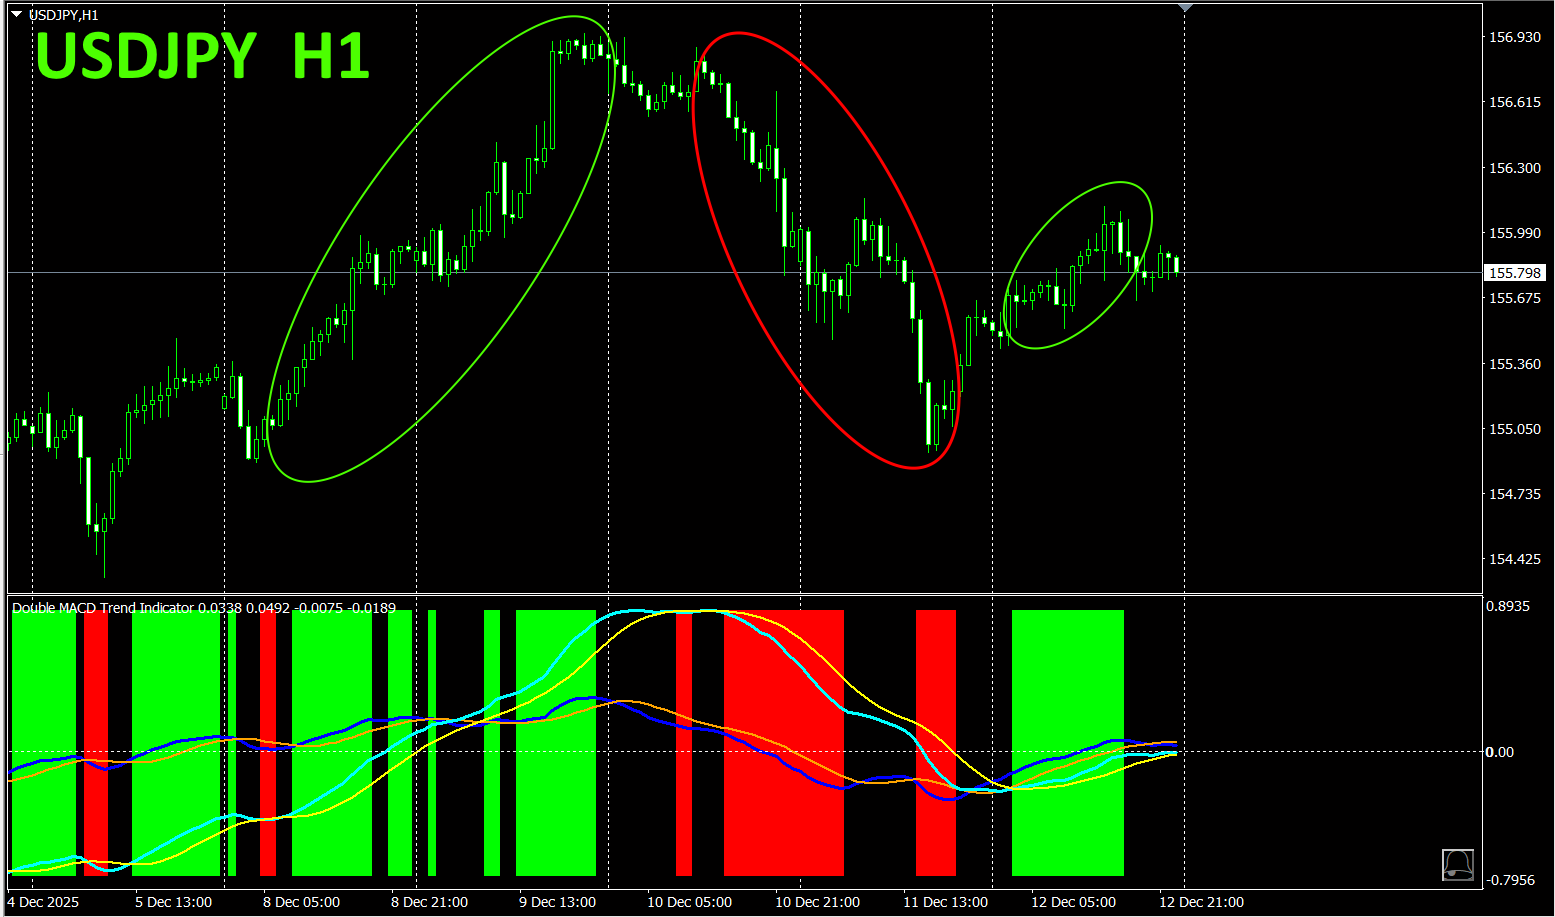
“Dual_MACD_Trend_Indicator” follows a simple rule: buy in the green zone, sell in the red zone, and do not trade otherwise.
With theDual_MACD_Trend_Indicator, you will never question the trade direction again.
5.
“Hyper-CSW” has been released
“Hyper-CSW is a high-performance indicator that visualizes the strength of the eight major currencies at a glance. It records the strongest currency and score for the current time frame, and accurately captures trend persistence and turning points. In addition, it supports multi-timeframe analysis showing currency strength rankings (top currencies) with scores across multiple timeframes such as
.
https://www.gogojungle.co.jp/tools/indicators/65082
※ Recommended Indicators
“8CFD Visualization Indicator version”
https://www.gogojungle.co.jp/tools/indicators/32288
“Toretore Indicator”
https://www.gogojungle.co.jp/tools/indicators/50115
“TrendLine-EX”

https://www.gogojungle.co.jp/tools/indicators/42257
“8CCurrency Strength Visualization Indicator” please refer to the following pages.
version https://www.gogojungle.co.jp/tools/indicators/39150
MT5 version https://www.gogojungle.co.jp/tools/indicators/39159
【My items for sale】


