
Indicator to Master Winning Rate【KUROHUNEPRO】
Get faster access to valuable information from investors around you by signing up as a friend!
The winning investors are the quickest at obtaining information!!
![]()
KUROHUNE PRO introduction video
The era of entering with indicators whose win rate is unknown is over. The era of entering only when you can win
*This product is the full version of “KUROHUNE PRO.”
Indicator highlights
・View at a glance the win rate per time frame for the past 10 years of the popular KUROHUNE indicator (if you have 10 years of historical data). (Historical data can be downloaded for free from an external site.)
・Compatible with all currency pairs!
Have you ever thought something like this?
“This indicator clearly wins based on the most recent arrows, but how does it perform over a long period?”
Many indicators show arrows to indicate entry timing, but
have you ever worried whether you can actually win by entering according to that indicator?
“KUROHUNE PRO” eliminates that worry.
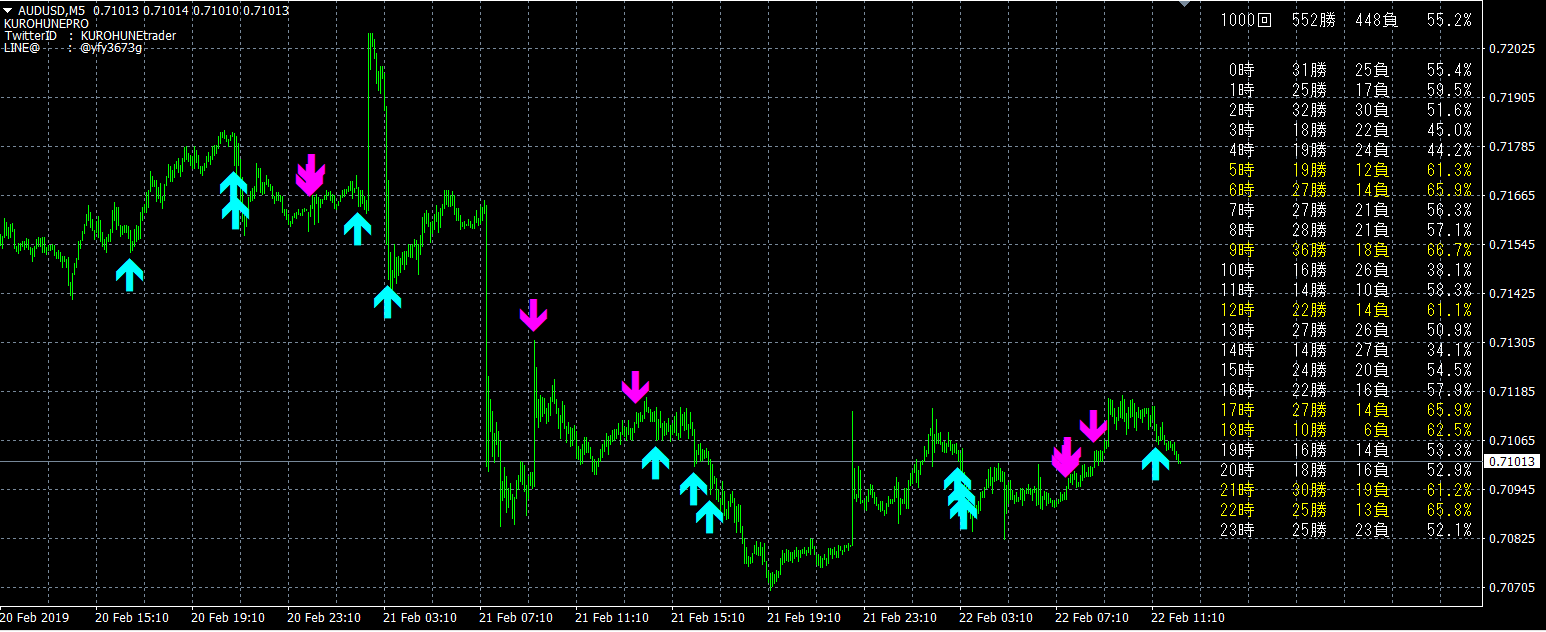
“KUROHUNE PRO” automatically calculates wins and losses from past arrows as shown in the image below and displays them by time!
(Image is AUDUSD 5-minute chart, results of the last 1,000 arrows.
It is also possible to display more than ten thousand arrows.)
You will realize how convenient it is once you try it! Please give it a try!!
Logic
This indicator has fine-grained criteria, but in broad terms,
1) break through the Bollinger Bands
2) RSI crosses the Bollinger Band with RSI
it generates a contrarian signal.
Of course you can change these parameters, so please customize to your liking
Frequently Asked Questions
What is the win/loss determined by?
If the next candle after an arrow is bearish or bullish, it is considered a win. In other words, this is particularly effective for binary options.
Can arrows be displayed for any number?
The more historical data you have, the more arrows you can display.
Historical data can be downloaded from external sources. Even without historical data, several hundred arrows should be displayed.
Also, the more arrows, the heavier the operation becomes.
Please tell me your recommended settings
First try with the default settings.
Then you can apply it to your preferred currency pairs and timeframes, which is another advantage of this indicator.
・Parameter settings
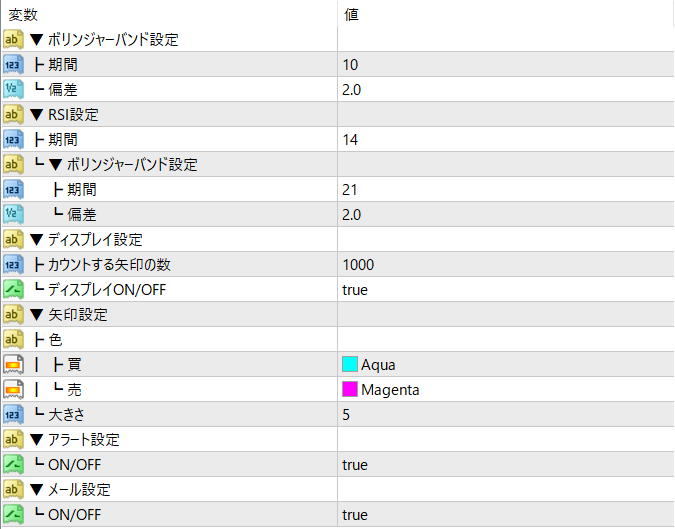
・Bollinger Band settings
Period... The period for the Bollinger Bands. Default is 10.
Deviations... The deviation for the Bollinger Bands. Default is 2.0.
・RSI settings
Bollinger Band settings: Period... The RSI period applied to Bollinger Bands. Default is 21.
Bollinger Band settings: Deviations... The RSI deviation applied to Bollinger Bands. Default is 2.0.
・Display settings
Number of arrows to count... The number of arrows used to display win rate
Defaults to 100.
Display ON/OFF... Whether to display the win rate. It is shown when true.
・Arrow settings
Color – Buy... The color of the buy signal arrows.
Color – Sell... The color of the sell signal arrows.
Size... The size of the arrows.
・Email settings
You will receive an email notification when a signal is issued.
Enabled when true.
・Alert settings
Notifications to MT4 when a signal is issued.
Enabled when true.