

Understanding the Distortion Patterns of the Three Major Currency Pairs | USDJPY, EURUSD, GBPJPY Triad Analysis Report
Hello!TriParity Labs Tokyo is Kaz. In the previous article “What is the 'Physical Law' of FX Known only by HFT? — Five market truths that individual traders are missing,” I explained the triangular currency parity as a “market’s physical law” and the market structure behind the scenes. For theoretical background and data from academic research, please first refer to that.
In this article, based on this hidden market structure, the three major currency pairsUSDJPY・EURUSD・GBPJPY show features of “distortions” and five important truths about how to apply them to trading.
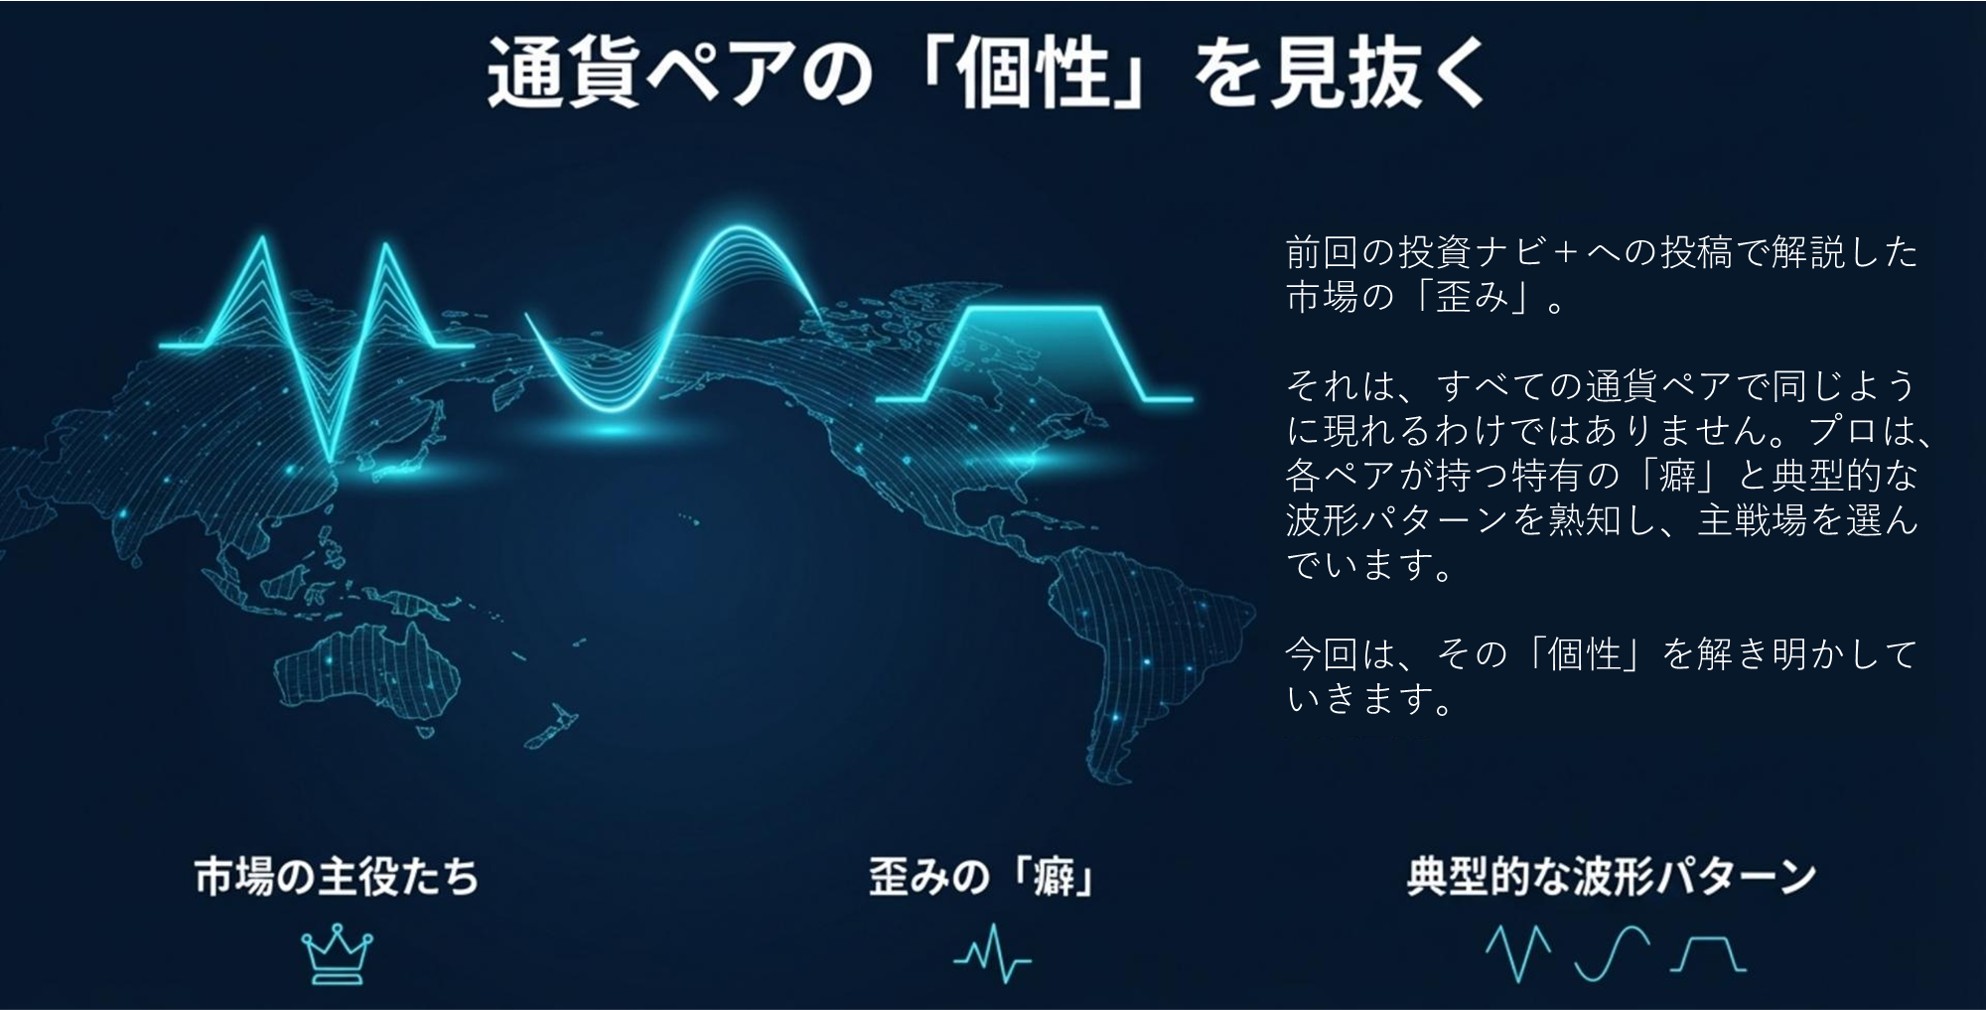
Seeing the “personality” of currency pairs from the distortion perspective
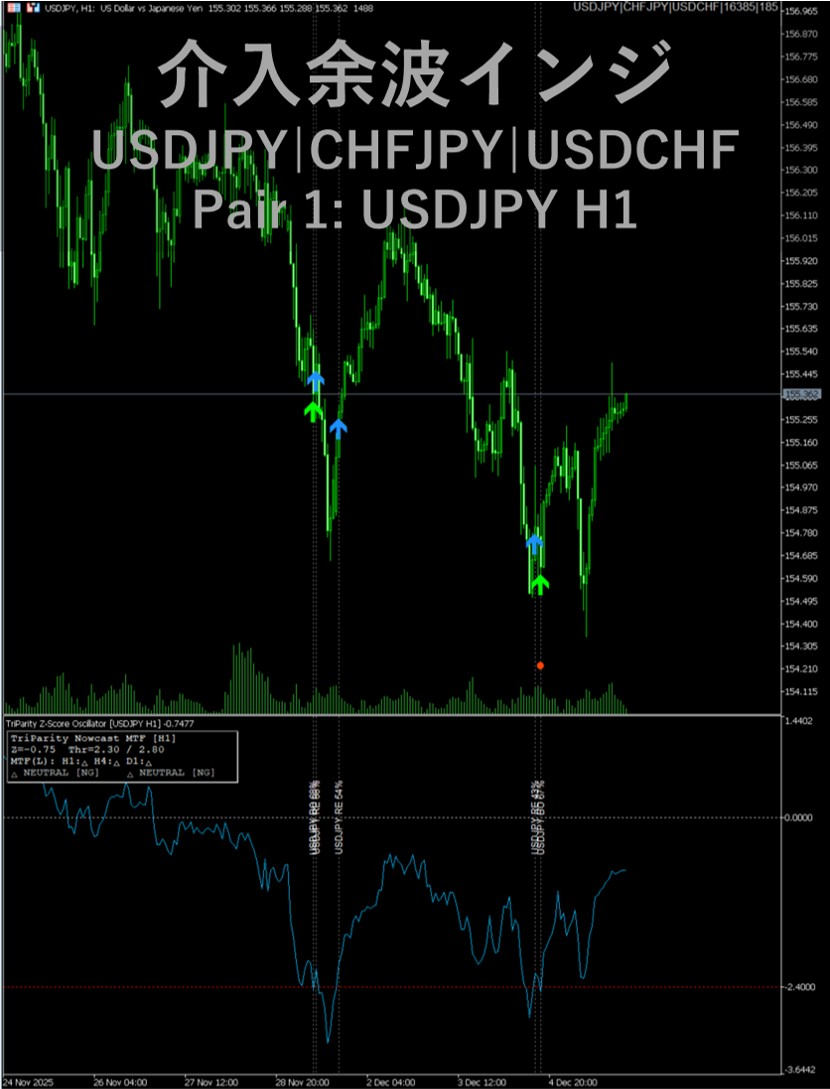
1. The distortion of USD/JPY is sharp like a needle and disappears in an instant

USD/JPY ( dollar-yen ) is the central hub among six Triads (combinations of three currencies) sets (details will be posted later on “Investment Navigator+.”) functioning as a central hub and the flow of arbitrage concentrates at this focal point . This is because EUR/JPY and GBP/JPY are calculated from USD/JPY and another dollar-street rate (e.g.,) as“dependent rates”. Structurally, price misalignments created in cross-yen pairs are ultimately aggregated at the hub USD/JPY and absorbed and corrected there.
The typical distortion pattern is sharp “needle spike”. After important indicators releases or Bank of Japan FX intervention expectations,Z score (deviation from equilibrium) jumps from ±2.5 to at once, and the subsequent reversion (V-shaped correction) is also extremely fast. In many cases, from distortion onset to return to equilibrium takes only seconds to minutes. This phenomenon occurs because many Triad hubs monitor USD/JPY with numerous algorithms, and is particularly evident during the highly liquid London and New York sessions. Also, in rare cases, the SafeHaven_Mix Triad involving the safe haven yen and Swiss franc may exhibit a two-stage spike (W-shaped).
Visually, this pattern appears as the sharp waveform below.──╭─╮── (※ For two-stage spikes, the shape is)
Understanding this characteristic changes trading strategy. It is often more rational to wait for the distortion to form and then ride the move back toward equilibrium, rather than jumping on rapid surges or crashes.
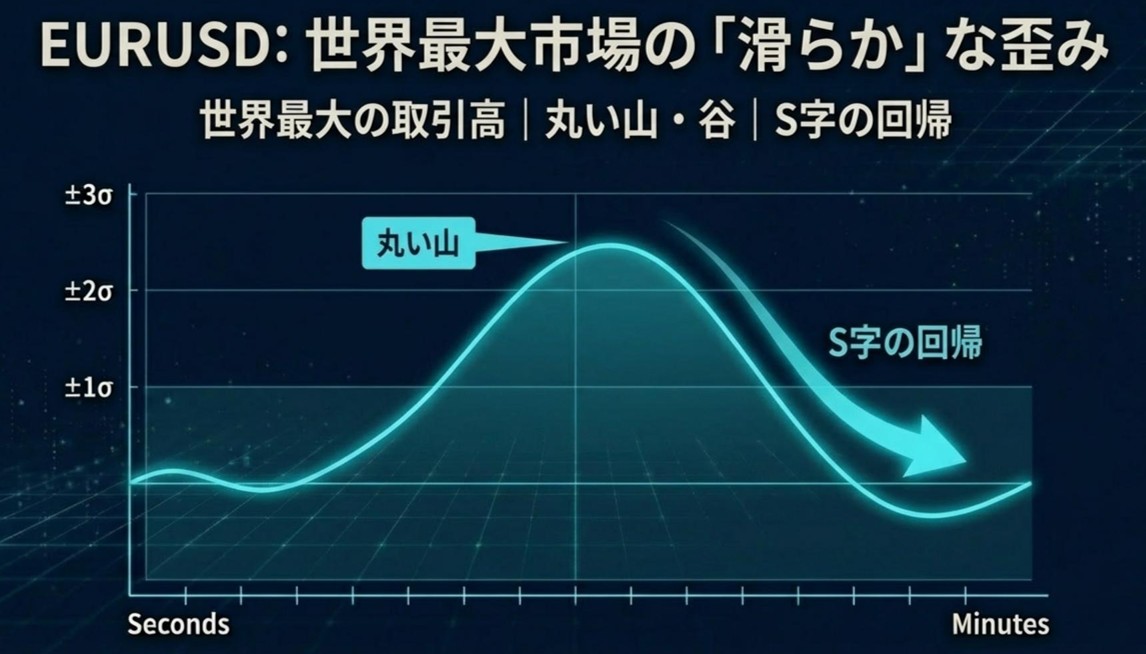
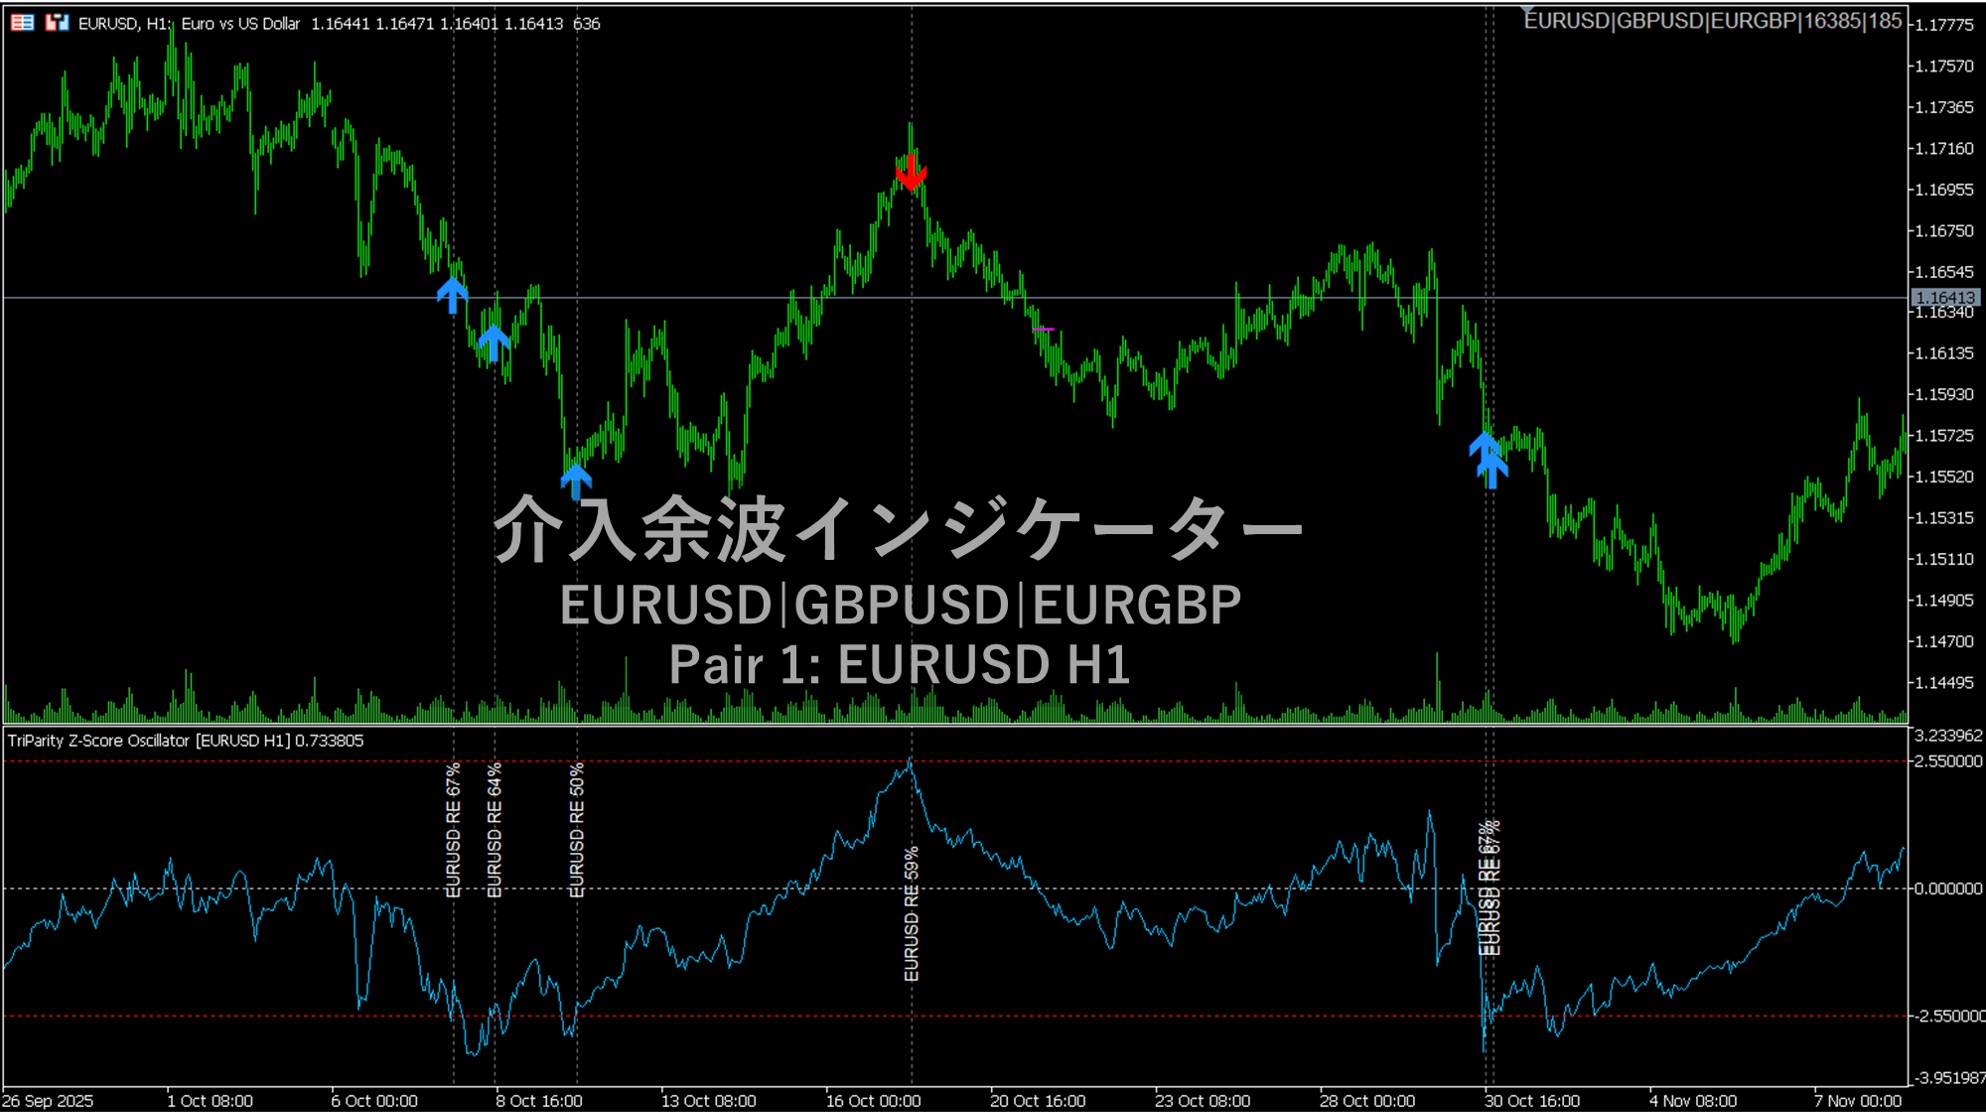
2. The distortion of EUR/USD forms like a gentle rounded hill and slowly returns
EUR/USD (euro-dollar) is central in a set of five Triad sets. Its overwhelming liquidity earns it the title of being the “most fairly arbitraged currency pair in the world,” and its distortion pattern contrasts with USD/JPY.
The EUR/USD distortion is not a sharp spike but is formed gently like a “round hill or valley,” and it gradually returns to the equilibrium while tracing an S-curve over time. The distortion magnitude is relatively small, usually score reaches around ±2.0 to ±2.5σ and then turns around. The correction may take several minutes to a dozen minutes, and this calm movement is due to the market's depth, making instantaneous slips unlikely; large orders gradually create distortions that gradually dissipate as well.
This smooth waveform can be imagined as──╮╰──
This gradualreversion process creates practical opportunities for individual traders. For strategy, catching the pullback after overextension is a logical entry basis for “buy on dips and sell into the rebound.”
3. The distortion of GBP/JPY is extreme and volatile, as the currency nicknamed the “killer currency”
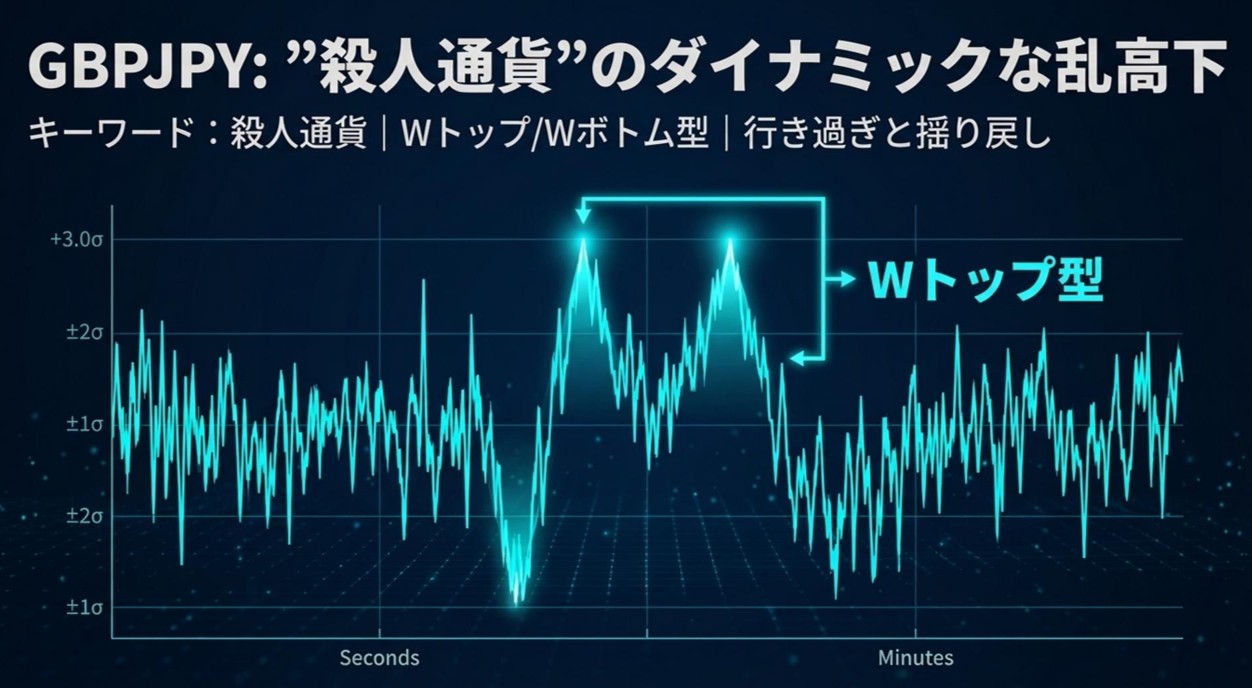
The “killer currency” (the killer currency) GBP/JPY is, as the name suggests, extremely volatile and distortion manifestation is dynamic. The structural reason lies in the fact that GBP/JPY is a “dependent rate” that does not include USD.
GBP/JPY distortions occur frequently, and when overshooting occurs, the Z score jumps from ±2.5 to ±3.0σ. Then, as with USD/JPY, an immediate sharp V-shaped reversion is typical. Additionally, after a return begins, a second spike in the same direction may occur, forming a W top/W bottom distortion (╭─╮ ╭─╮). This reflects its choppy price action.

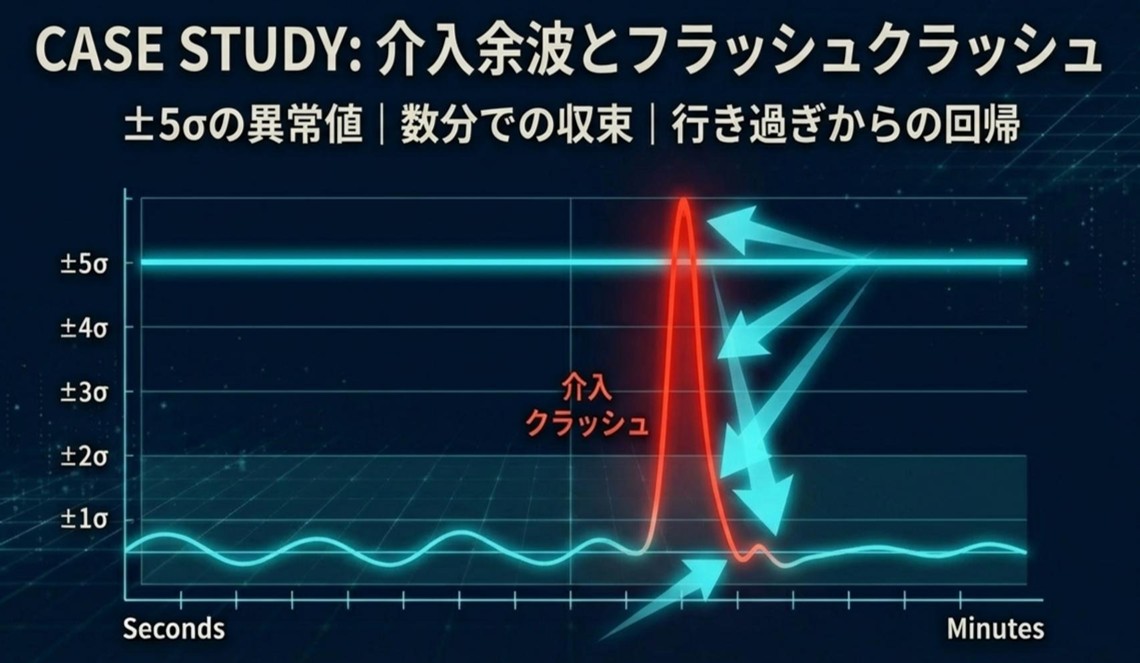
In the Brexit shock of the past, a remarkable distortion occurred at the Z score level of ±5σ. At that time, the typically highly correlated GBP and JPY relationship briefly collapsed, but that was itself a massive market distortion, and it ultimately returned to equilibrium due to arbitrage—this reinforces a way to view GBP/JPY’s nature:
Because it is so prone to extreme moves, you can also see it as having a strong force pulling back toward equilibrium.
4. Distortion itself provides a logical justification for contrarian trading without relying on intuition
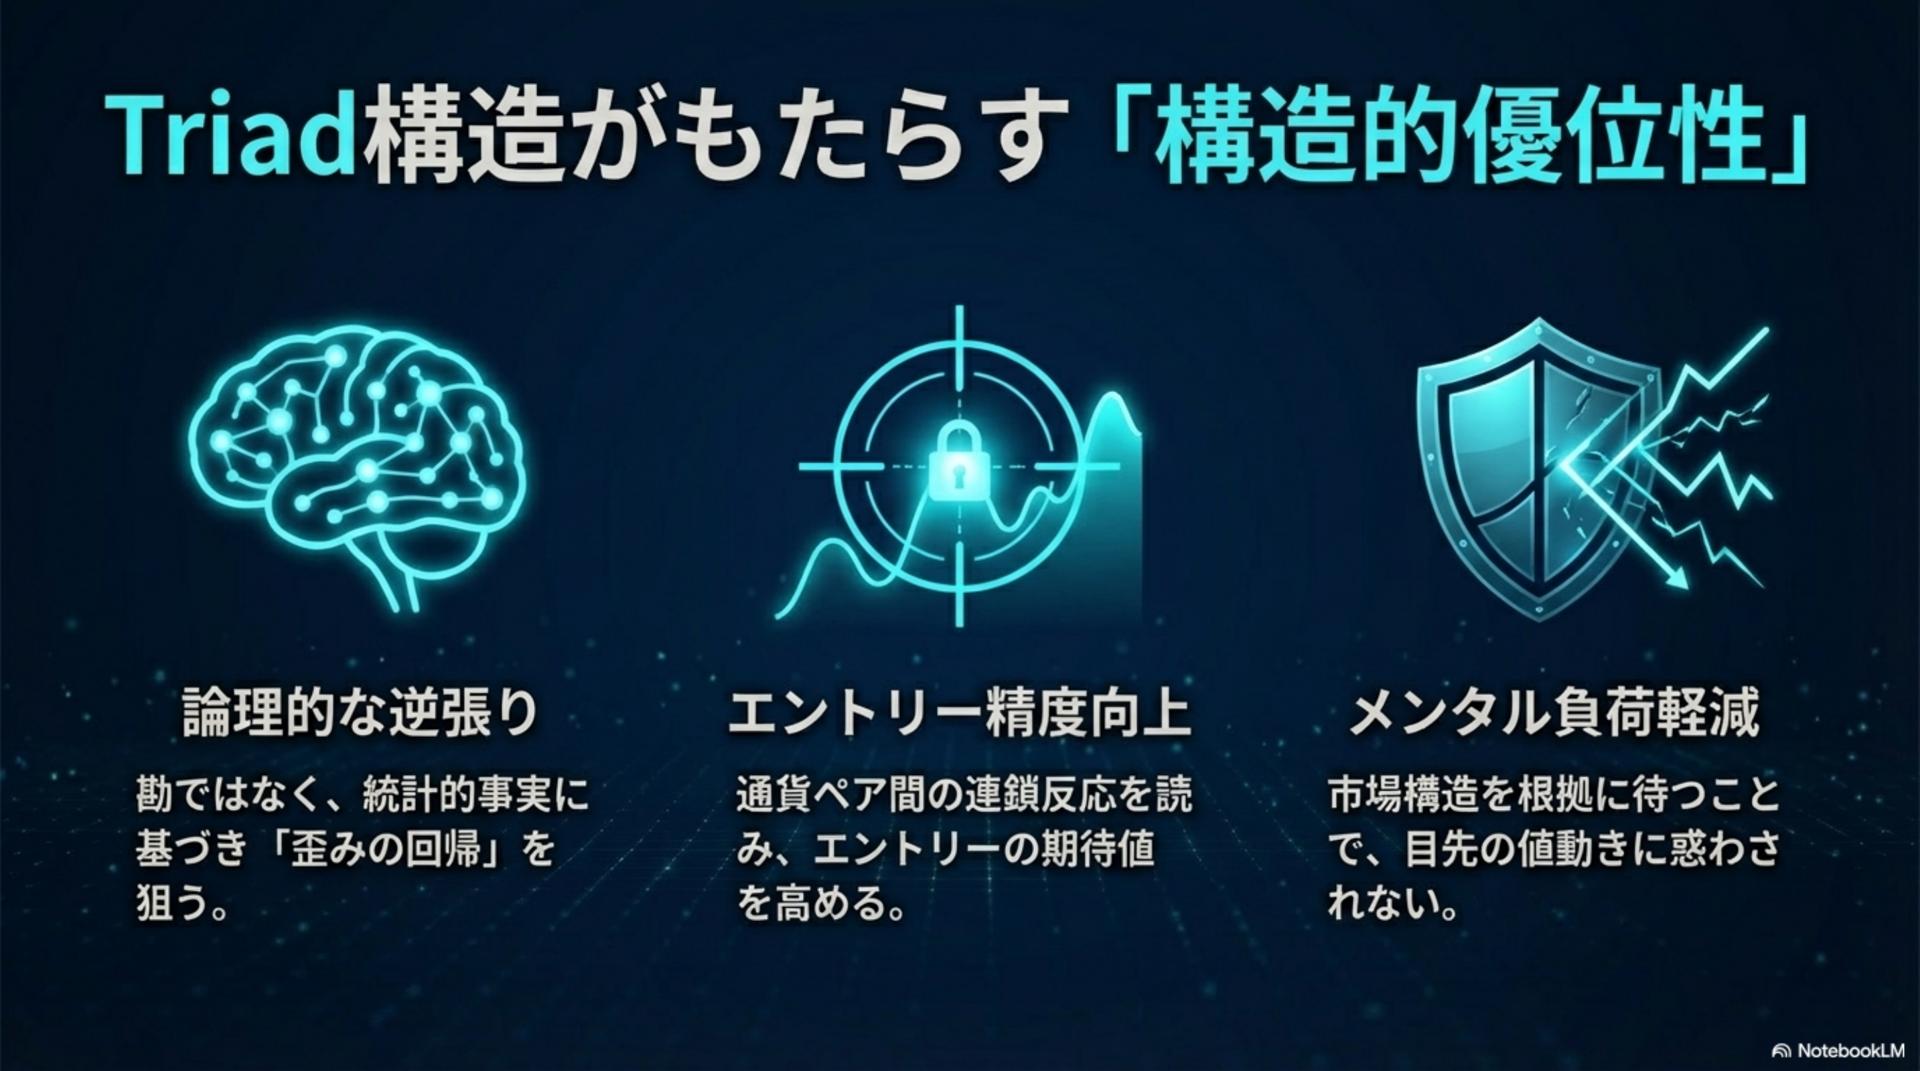
Understanding the Triad structure and distortion patterns gives individual traders four concrete benefits.
1. Logical risk management(Logical Risk Management) Rather than emotionally selling because prices rose too much, use the distortions that statistically resolve quickly as signals, creating a clear basis for trades. This allows rational sizing and stop placement, greatly improving risk management accuracy.
2. Higher precision entries(Higher Precision Entries) By understanding the chain reactions among currency pairs, you can infer which currency leads a move (e.g., dollar-led or yen-led). This helps select the most suitable pairs and improves entry timing accuracy.
3. Mental stability(Mental Stability) Understanding that your trading is based on market structural principles provides psychological support. Rather than reacting to short-term price swings with anxiety, you can calmly approach the market with the confidence that overbought/oversold prices will revert due to arbitrage forces.
4. Improve expectation and consistency through arbitrage-structured trading(Improve Expectation and Consistency) Triad trading follows highly repeatable patterns, increasing overall strategy consistency. For example, you can set clear rules based on historical data, such as “enter when GBP/JPY hits ±3σ and take profit near ±1σ,” leading to low-variance trading.
5.
Professionals monitor market distortions with their own systems; individual traders can now access real-time understanding through tools developed by us atTriParity Labs Tokyo.
【Intervention Ripple Pro】 Three-Currency Parity Analysis Indicator 3-Set (Scanner+Catcher+Nowcast MTF) for MT5(Product link)
【Intervention Ripple Scanner】 Three-Currency Parity MTF (M1~D1) Distortion Heatmap for MT5(Product link)

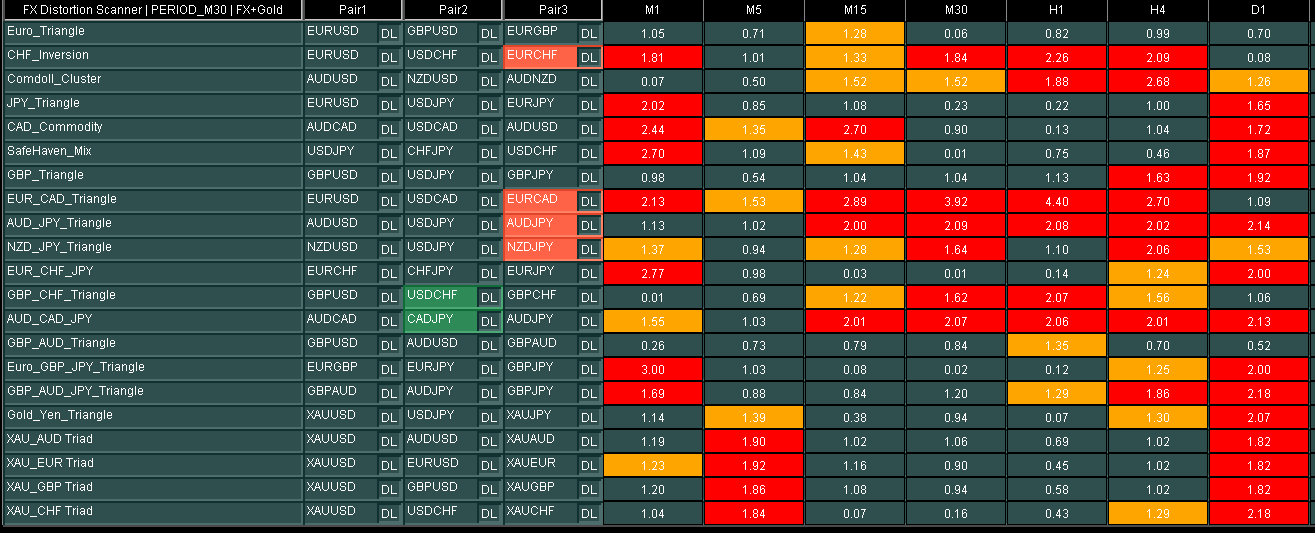
“Intervention Ripple Scanner” lists the distortions of the entire21 Triad sets, as a single Heatmap of distortions. It provides a multi-timeframe (M1 to D1) view of where stress concentrates, giving professionals the same perspective as monitoring multiple related rates.
“Intervention Ripple Catcher” is an indicator that directly plots a signal on a chart when distortions appear and begin to unwind for a specific currency pair, capturing the moment when an excessive move is about to be corrected and alerting the trader for a more precise entry decision.
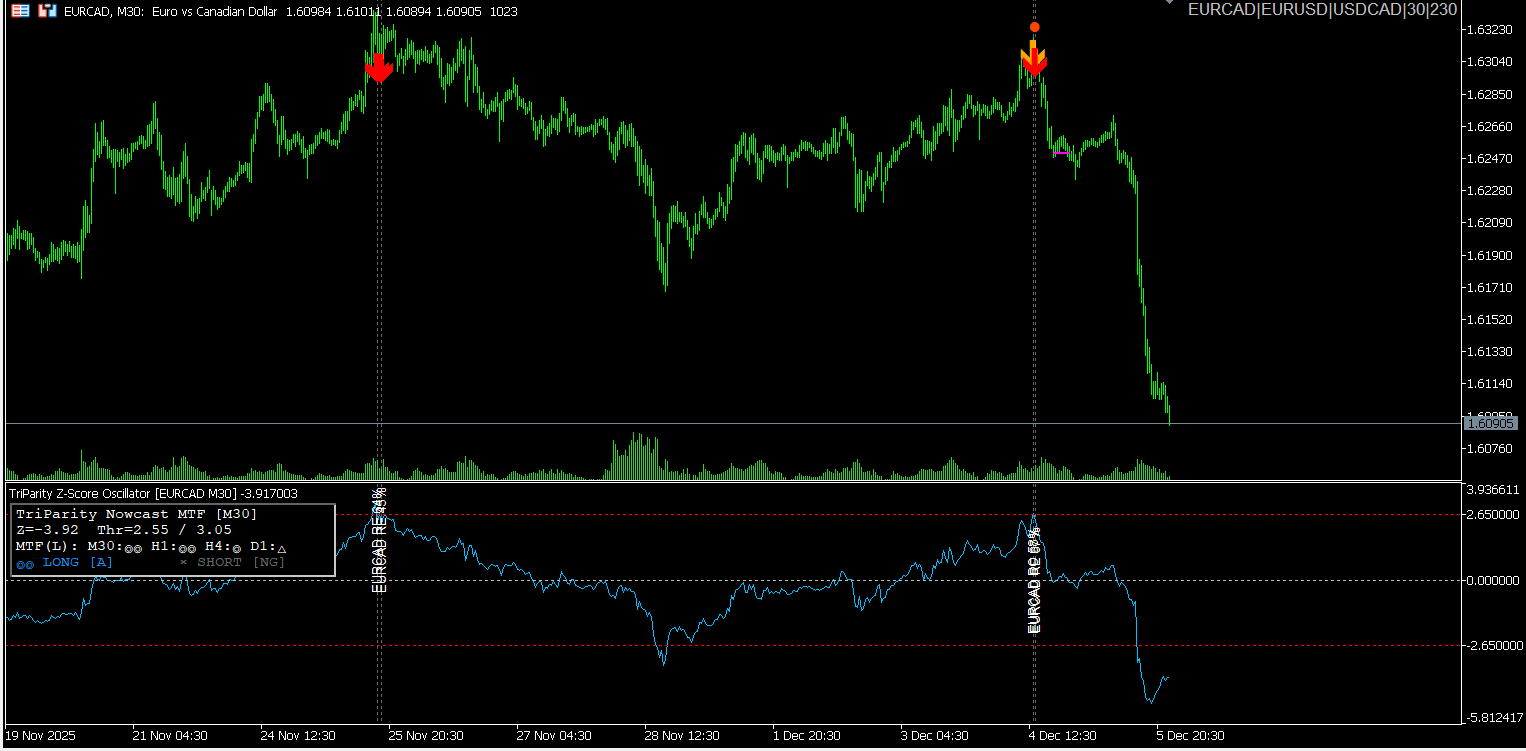
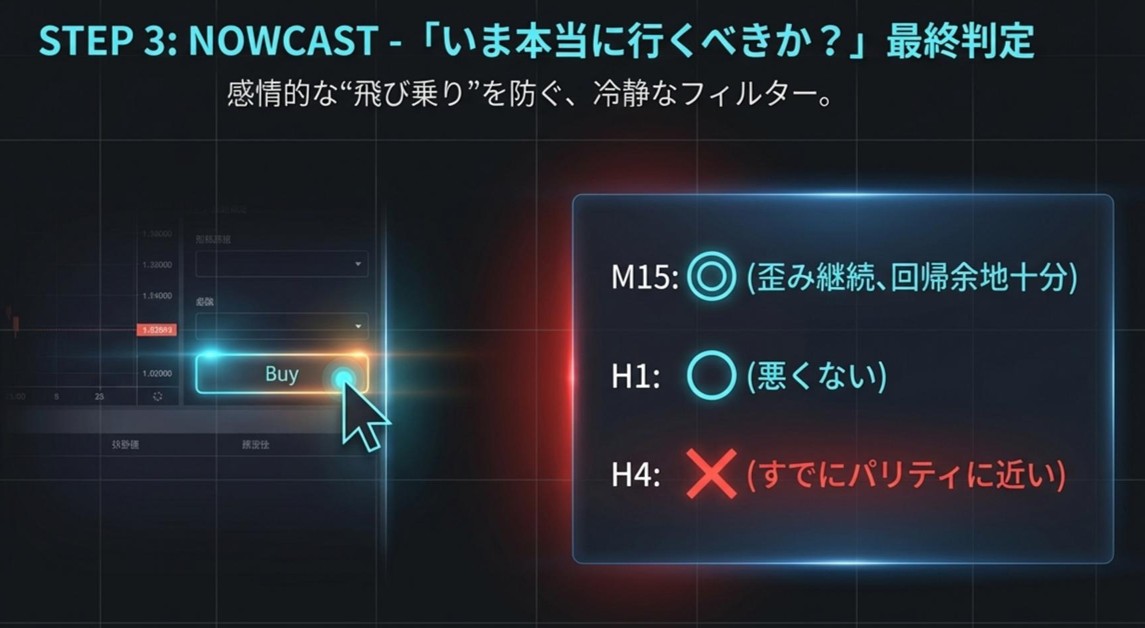
“Intervention Ripple Nowcast” is a module to verify in real time how much “wind is behind” the distortion signals across multiple timeframes, including higher and lower ones. It checks timeframes like M30, H1, H4 on a single screen to filter out setups where the higher timeframe contradicts the distortion, providing the final push for entry decisions.
What matters is that these tools are not a guaranteed holy grail, but infrastructure that visualizes previously unseen market structures. They make it possible to observe information used by professionals with substantial resources at hand.
They can bridge the information gap between professionals and individuals, supporting a fairer competitive landscape.
Conclusion(Conclusion)
At first glance, a seemingly random and chaotic chart hides the hidden market structure of triangle parity—physical laws watched by HFTs and banks. The arbitrage opportunities for them vanish in an instant, but the resulting phenomenon of “distortion returning to equilibrium” is a powerful force that individual traders can leverage.
Sharp spikes in USD/JPY, gentle hills in EUR/USD, and intense fluctuations in GBP/JPY. Each distortion pattern differs, but the principle that “excesses are always corrected” is common. Merely adopting this structural viewpoint can dramatically change how you see the market.
Finally, one question for you: “Is your chart just a collection of candles, or does it reflect a market-wide ‘distortion map’?”