2025/12/6 Dollar/Yen, Gold, SP500, and Nikkei 225 Environment

『Trendline Pro 2』✖『Break Edge Pro 5』
『Break Edge Pro』 is based on Dow Theory to form zigzags,
and it scores the break to display the edge (border/advantage),
an MT4 indicator that shows the edge.
Light blueandGreenare参考 buy points
PinkandRedare参考 sell points
For now, please refer mainly to the horizontal bar symbols.
In the image below,『Trendline Pro 2』is also displayed on the chart.
Dollar/Yen
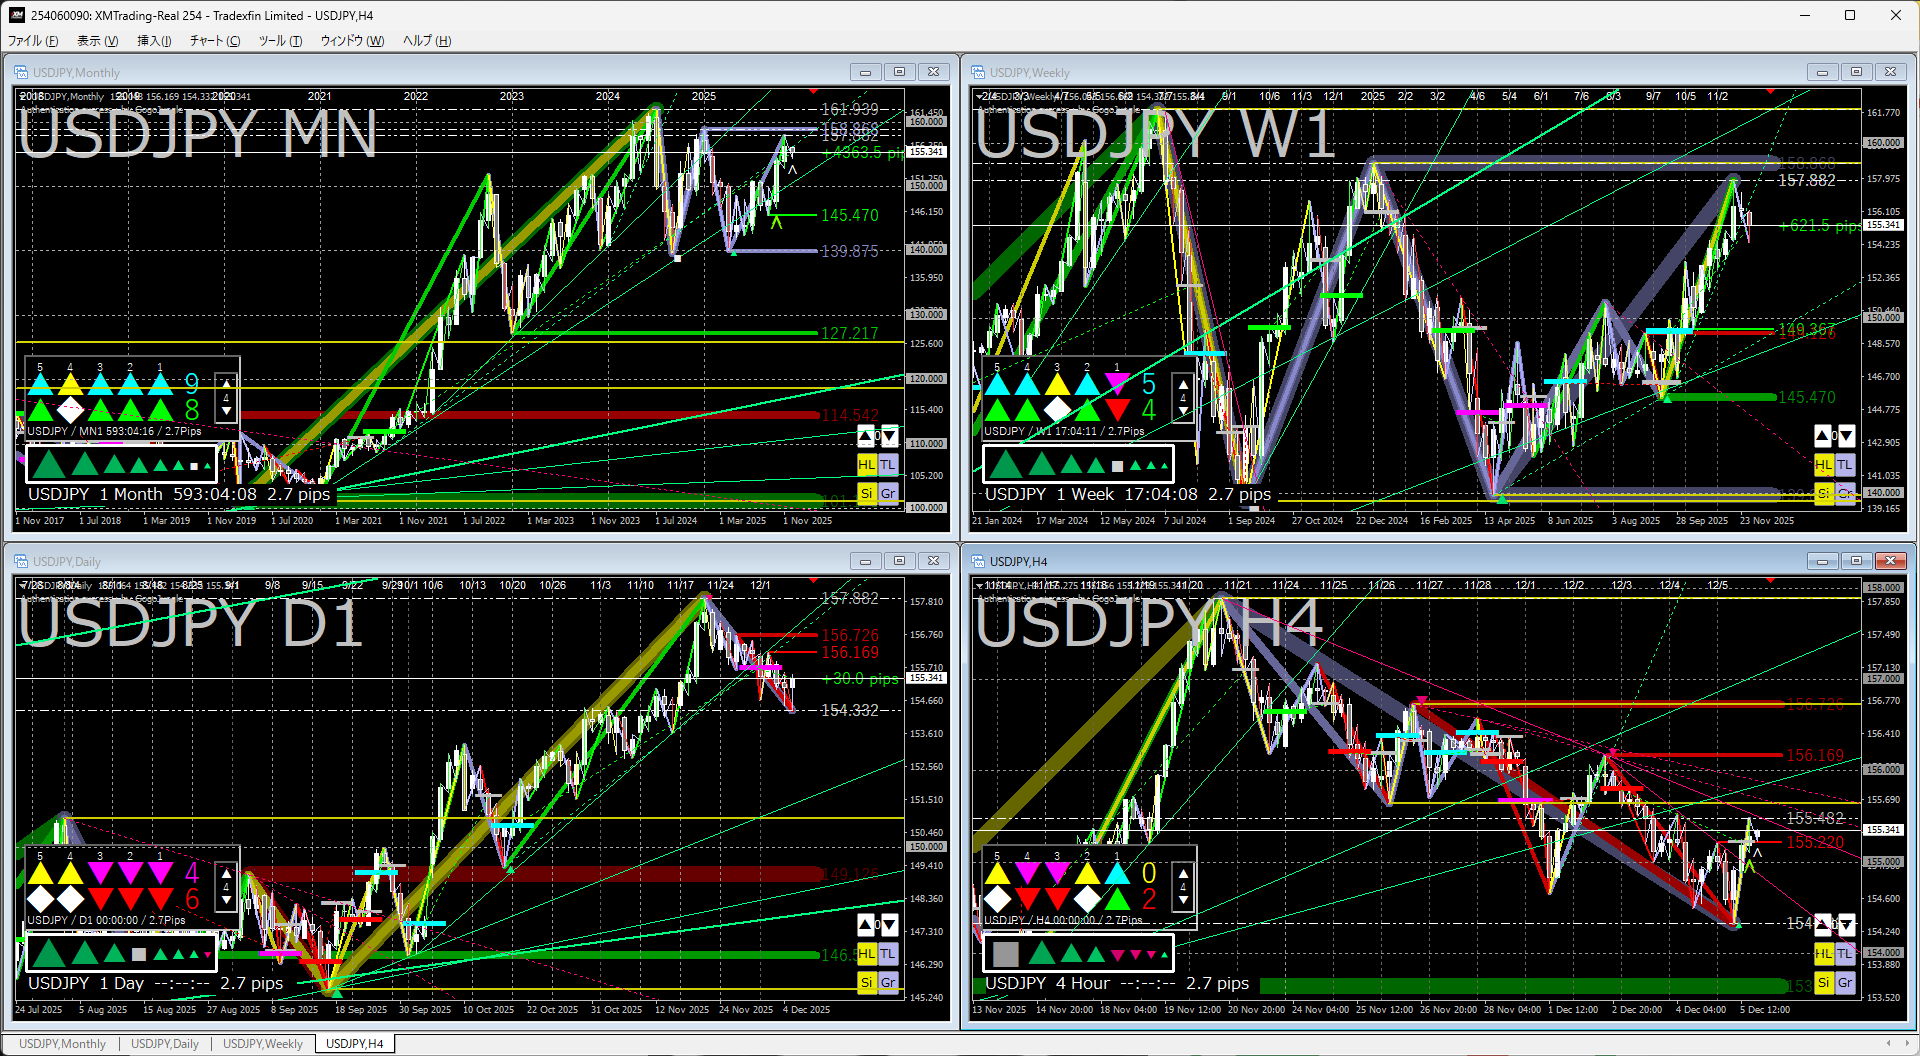
On monthly and weekly charts, the uptrend continues, but a triangle pattern is forming, located at its upper limit.
On the daily chart, a trendline break to the downside appears, indicating a selling signal, but the impression is more of a pause in the upside rather than a strong bearish stance.
Next week is likely to have weak directional movement.
It would be better to rigorously short when pulled up, and rigorously buy when pulled down.
Gold
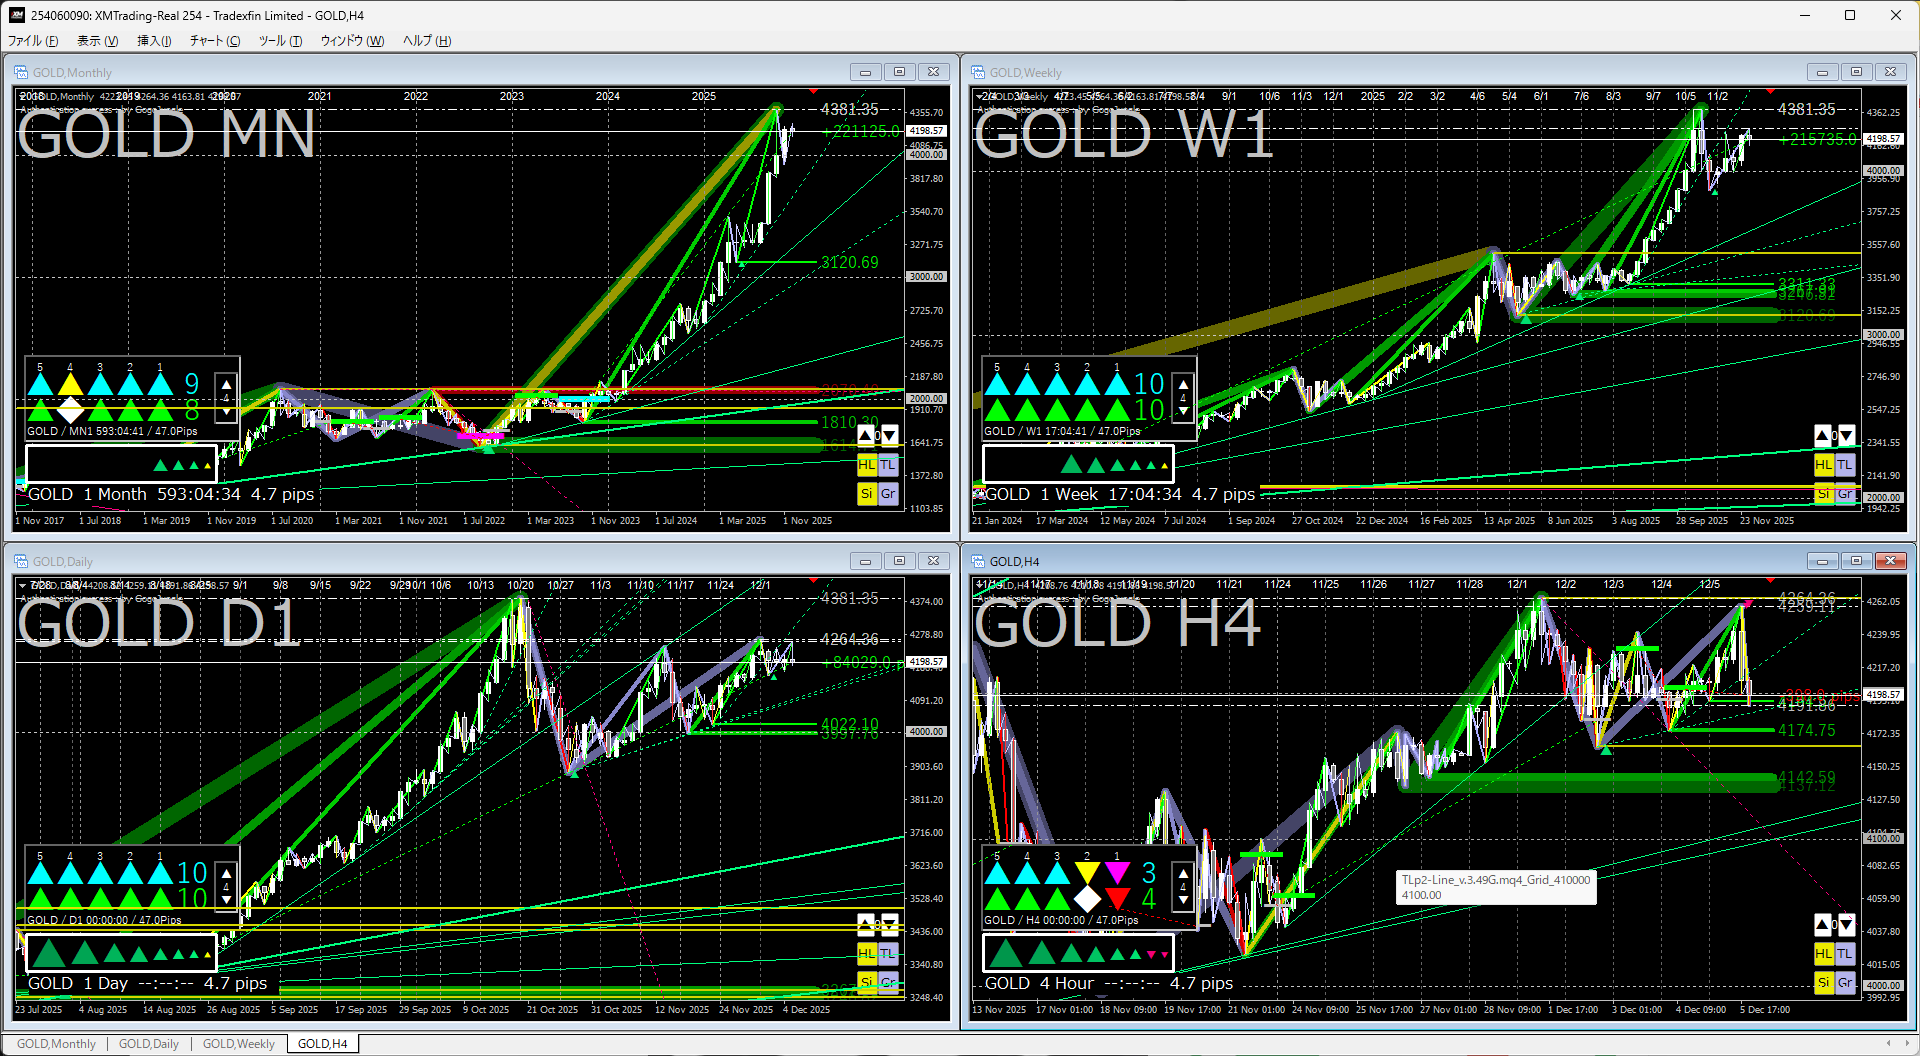
Gold remains in a clear buy bias.
A stance of buying on a sharp decline may not be appropriate.
That said, it’s unlikely to breakout to new highs immediately; expect some price consolidation for a while.
On daily charts, it seems good to buy if it falls to support or a trendline.
S&P 500
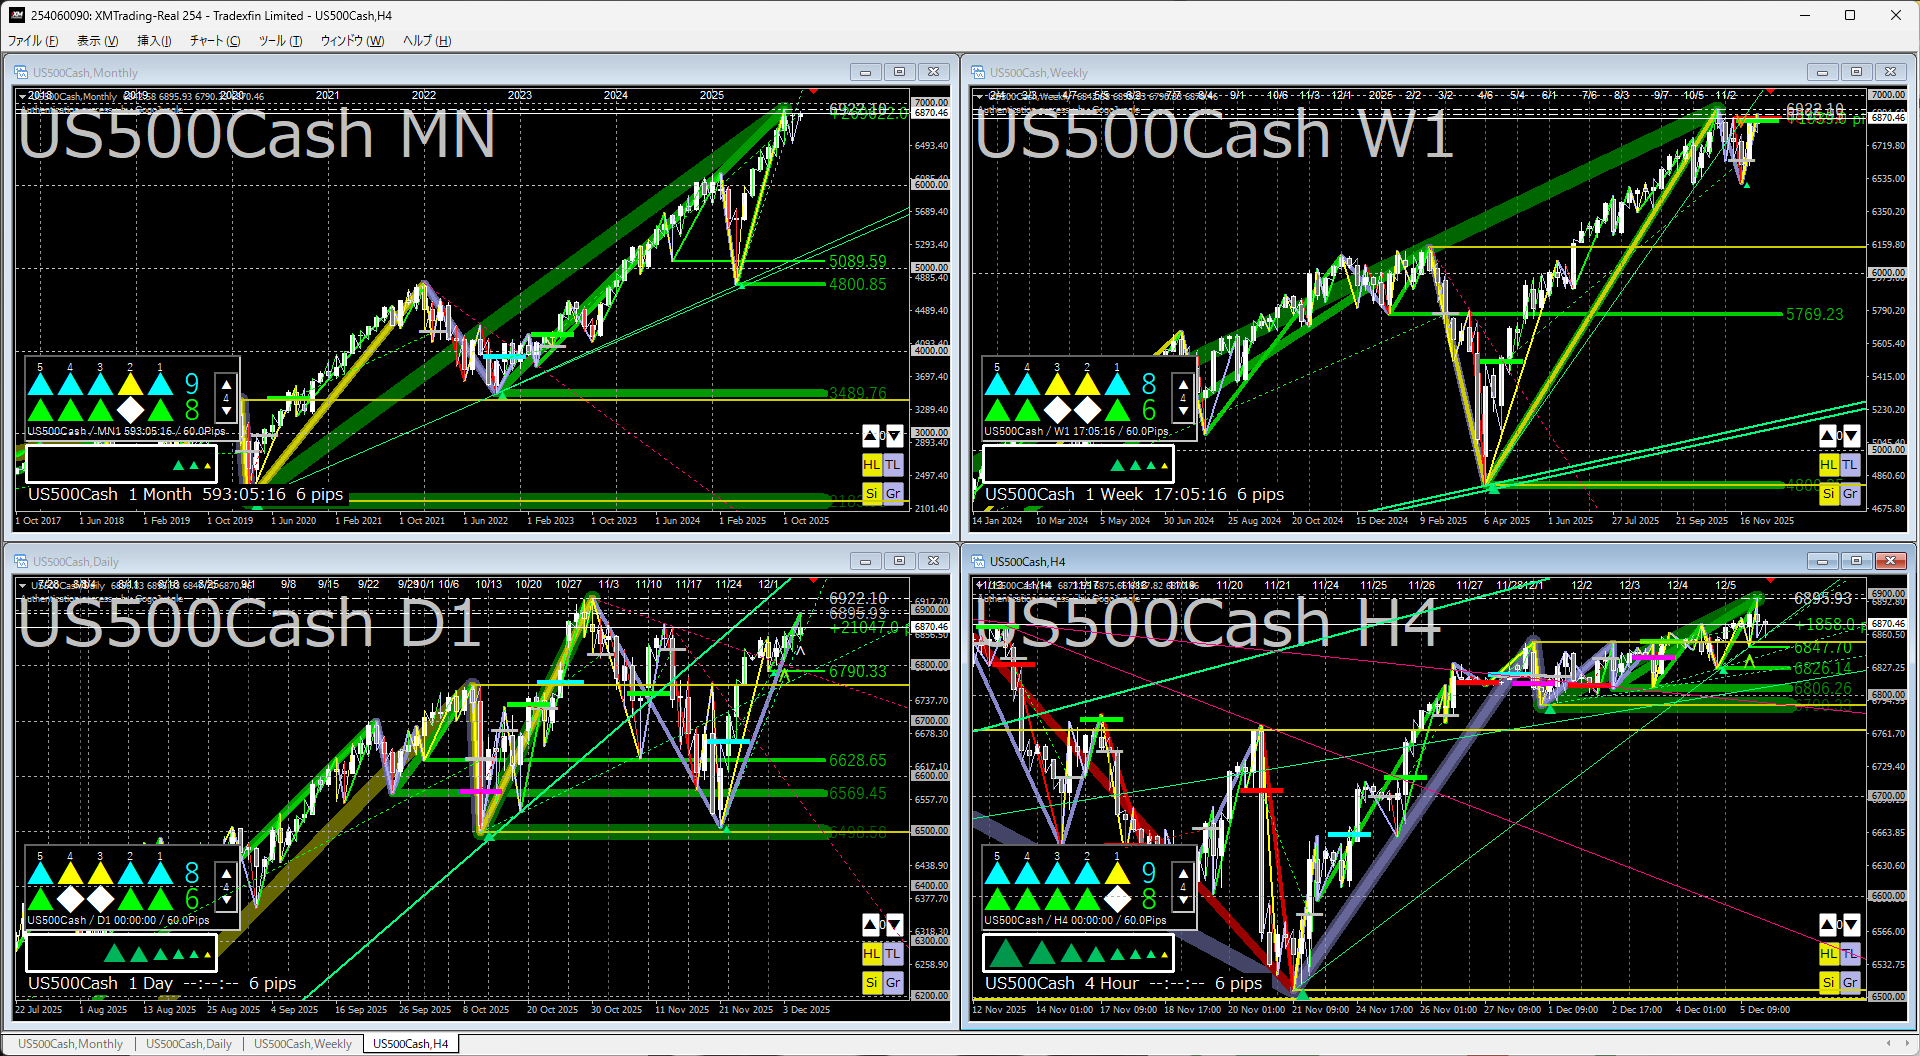
On monthly charts, a rebound at the trendline leads to ongoing upside, and a fresh buy signal appears on the weekly chart as well.
For those who bought on the daily signal, holding seems reasonable.
If buying now, it may be better to wait for a pullback.
There is a possibility that a right shoulder of a head-and-shoulders pattern could form on the daily chart.
Nikkei 225
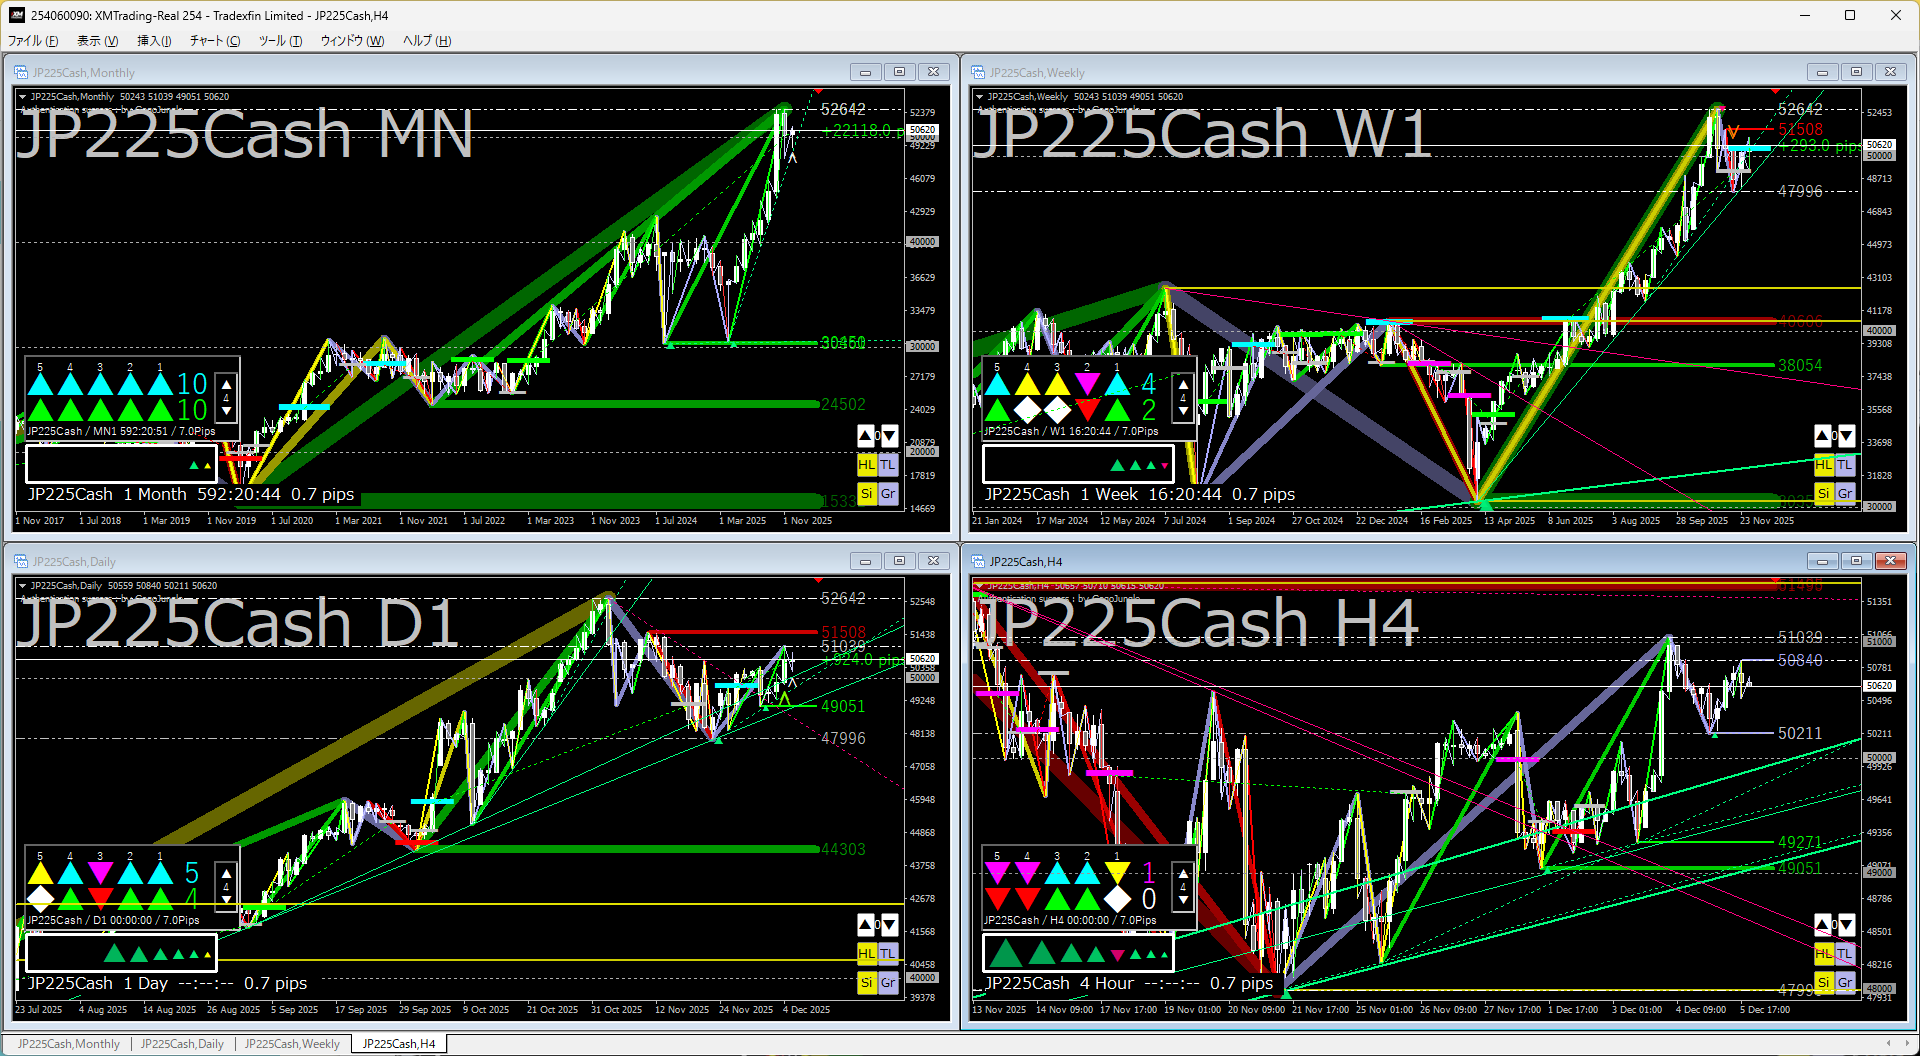
Uptrend continues on monthly, weekly, and daily charts.
The trendlines on weekly and daily timeframes are strongly watched.
When a direction appears on the 4-hour chart, buy if up, and wait if down until the trendline breaks.
The indicators in the attached image use two indicators below.
If you’re interested, please take a look.
『Trendline Pro 2』✖『Break Edge Pro 5』
The following text is nothing.
If you’d like to continue seeing this article, please click the button.