

Utilization of the "Visualization Indicator" (Part 227)
Utilization of the "Visualization Indicator" (Part227)
1. Further evolve the "28 Currency Pair List Indicator" into an indicator
“8CPVisualization Indicator”to chartNZDUSD.
The “8CPVisualization Indicator” has editions for Oceania,Oceania版版版版版 edition.
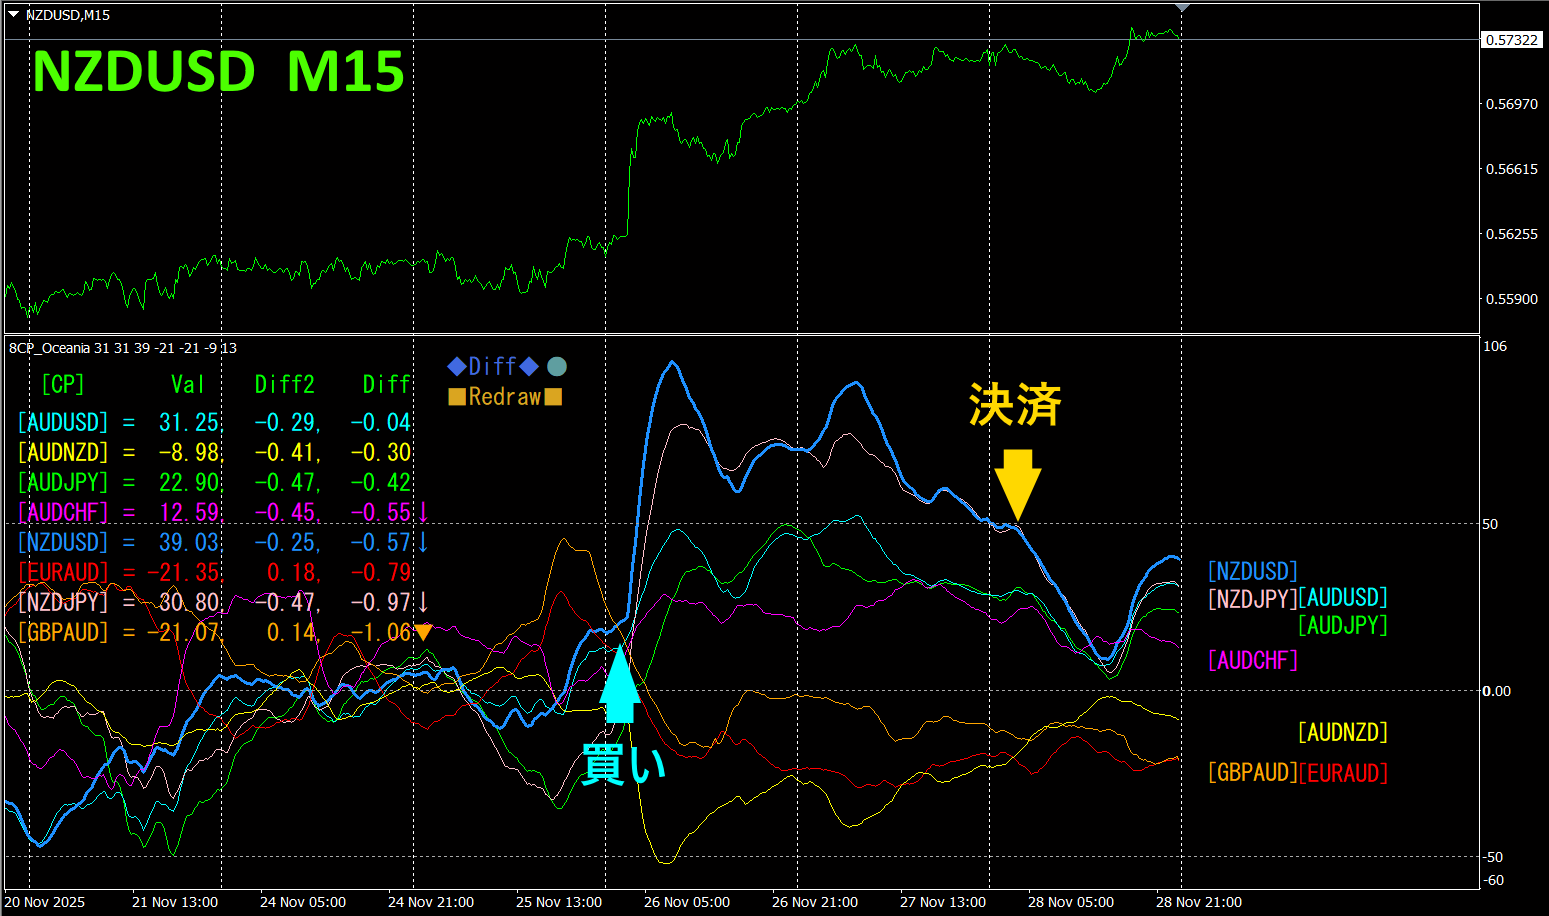
The top half is a 15-minute chart ofNZDUSD. The bottom half shows the results from the “8CPVisualization Indicator”; the blue thick line graph corresponds toNZDUSD.
On Wednesday, the NZDUSD graph broke above the other graphs, so a long (buy) trade was made. On Friday, it fell below the upper average line, so it was closed. Profit was about100 pips.
Currency Strength/Weakness Graph
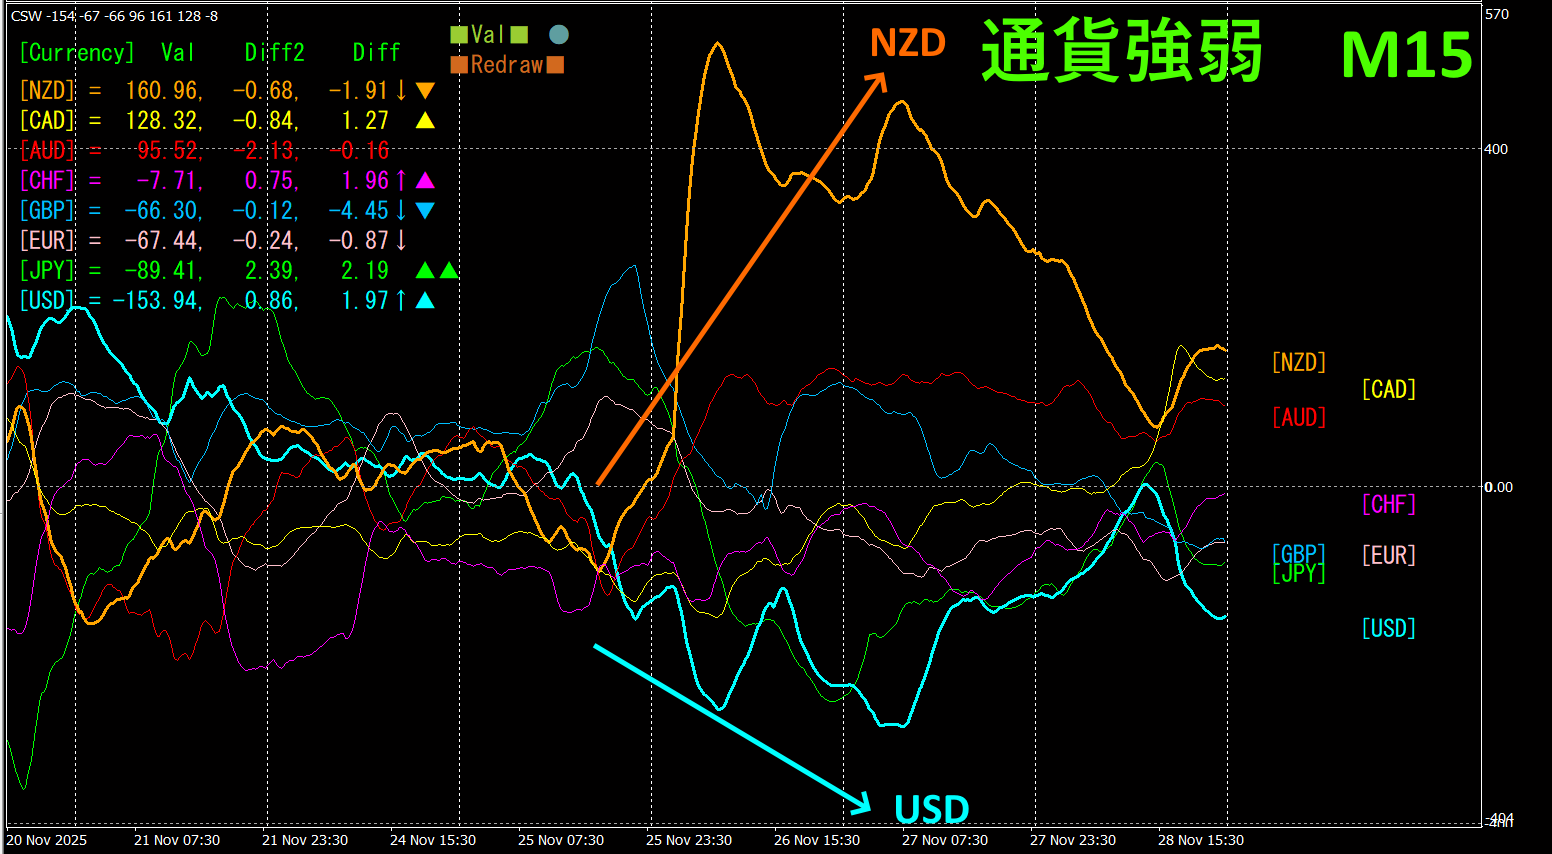
Looking at the 15-minute currency strength graph,NZD andUSD show a remarkably inverse correlation.NZD andUSD relationship is,NZD >USD, and we should focus on the parts where NZD and USD diverge, and buy NZDUSD. If the graphs fluctuate in the meantime, hold the position while the vectors of NZD and USD diverge.
In FX, if you pick the pair that is currently growing the most and is inversely correlated, the results will follow.
“Aim for the currency strength inverse correlation!”is's iron rule.
If you use “TrendLine-EX, you can automate entry and exit by breakouts of diagonal trendlines. You can leave it as is for easy trading. “TrendLine-EX is a semi-automatic EA that can automatically sell on a break below a trendline and automatically close on a break above a trendline.
2. Best SelectTry the indicator
The figure below is a screenshot taken on2025yearmonthday.
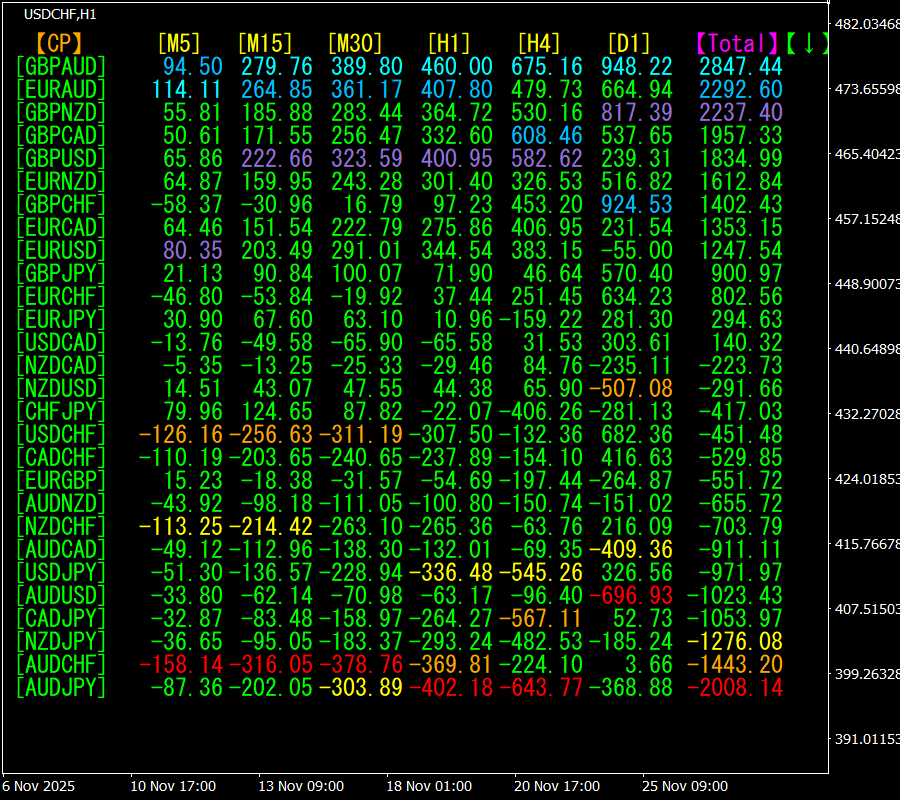
[Total]By descending numerical value. At the top,GBPAUD displays blue color across all timeframes. value is2847.44, a large positive number.GBPAUD indicates an upward trend is developing.
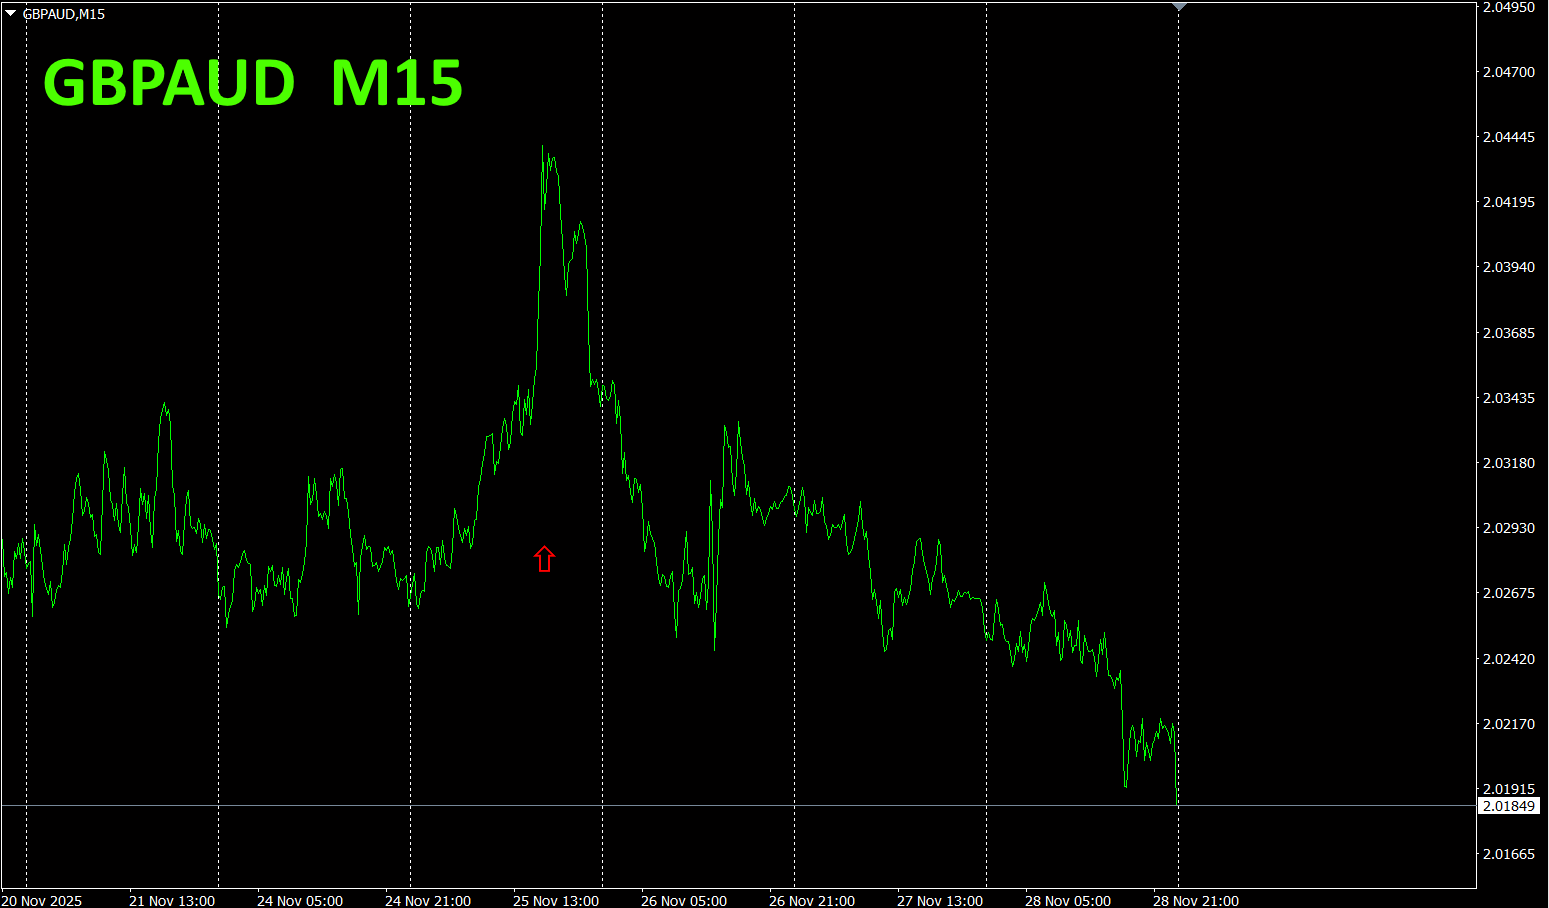
Now, let's look at the chart forGBPAUD.
The red arrow marks where the screenshot was captured. It captures the sharp rise.
“28 currency pairsBest Select indicator allows easily identifying which currency among 28 pairs is showing the strongest current trend. It also tells you, with numbers and colors, whether you should trade now. It is an excellent indicator to judge the overall movements of all currency pairs at a glance.
“28 currency pairsBest Select indicator”

https://www.gogojungle.co.jp/tools/indicators/35128
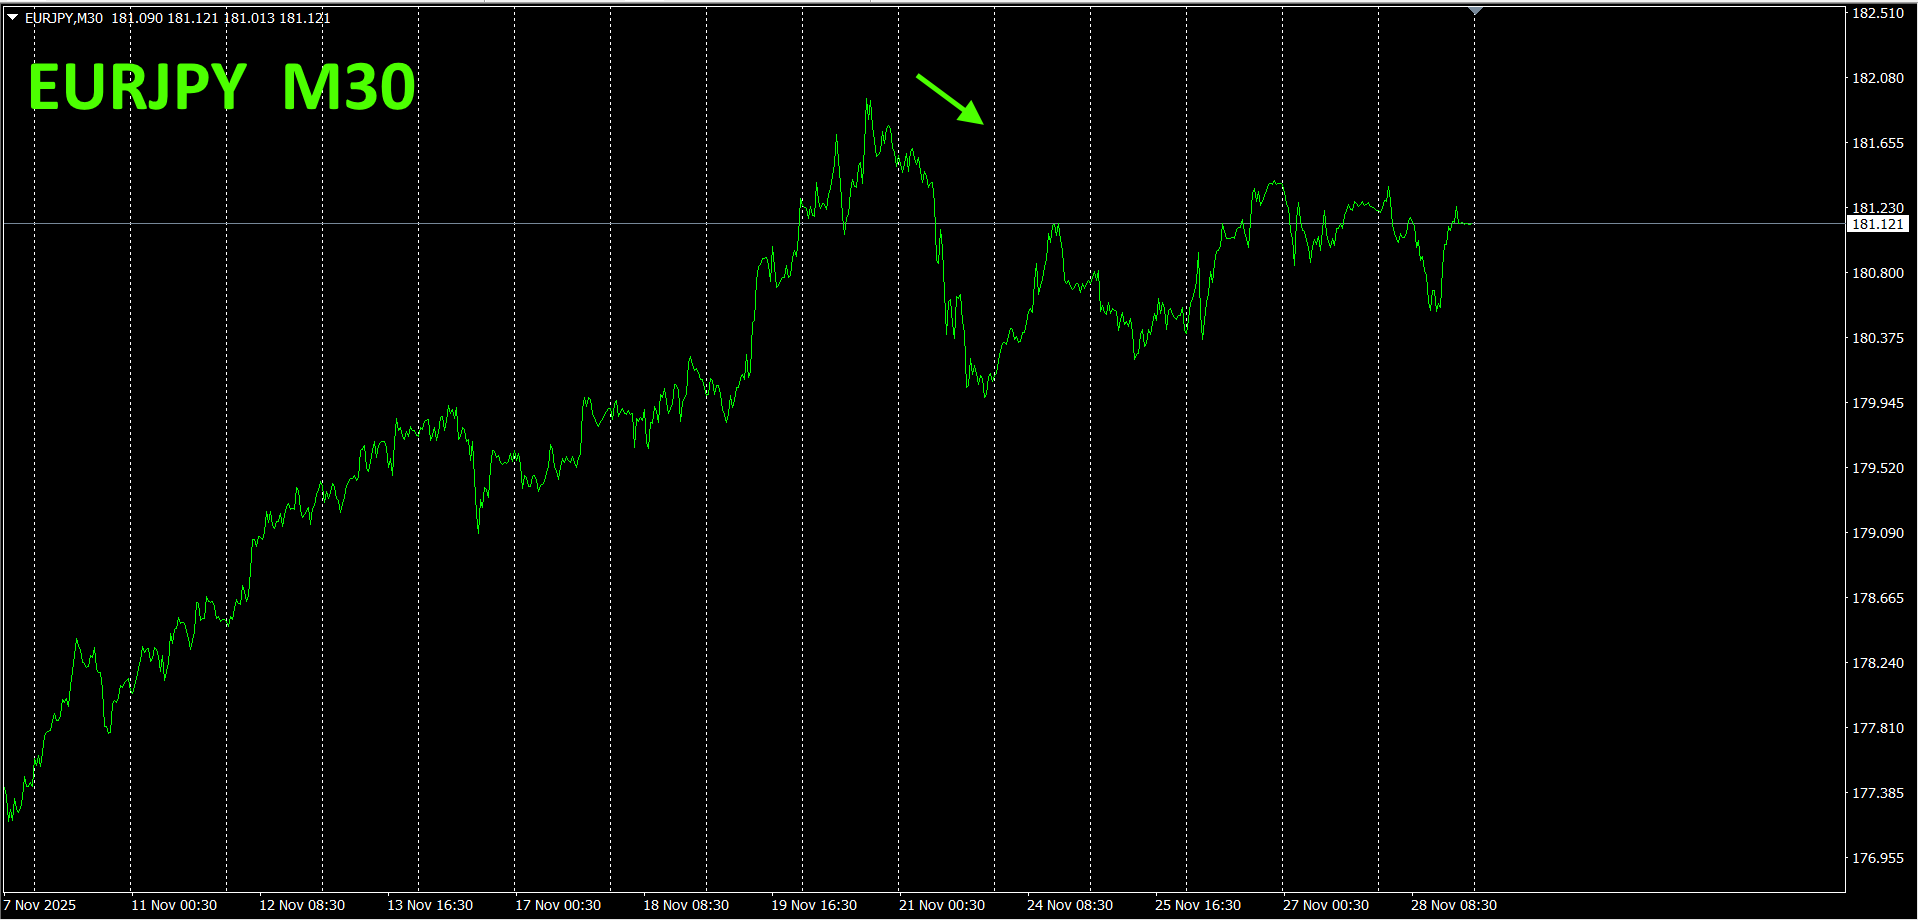
3. 2021yearmonth follow-up: how did EURJPY move?
2021yearmonth,EURJPY
To view overall trends, a30 minute chart for the last about3 weeks is drawn.
Previously, I wrote the following.
Pink color representsEUR, green representsJPY. Last week'sEURJPY rise was caused by the weakness of theJPY. For future direction,EUR is downward, andJPY is firmly upward, soEURJPY is expected to trend downward.
As expected, upper limits are being capped.
30 minute currency strength chart.
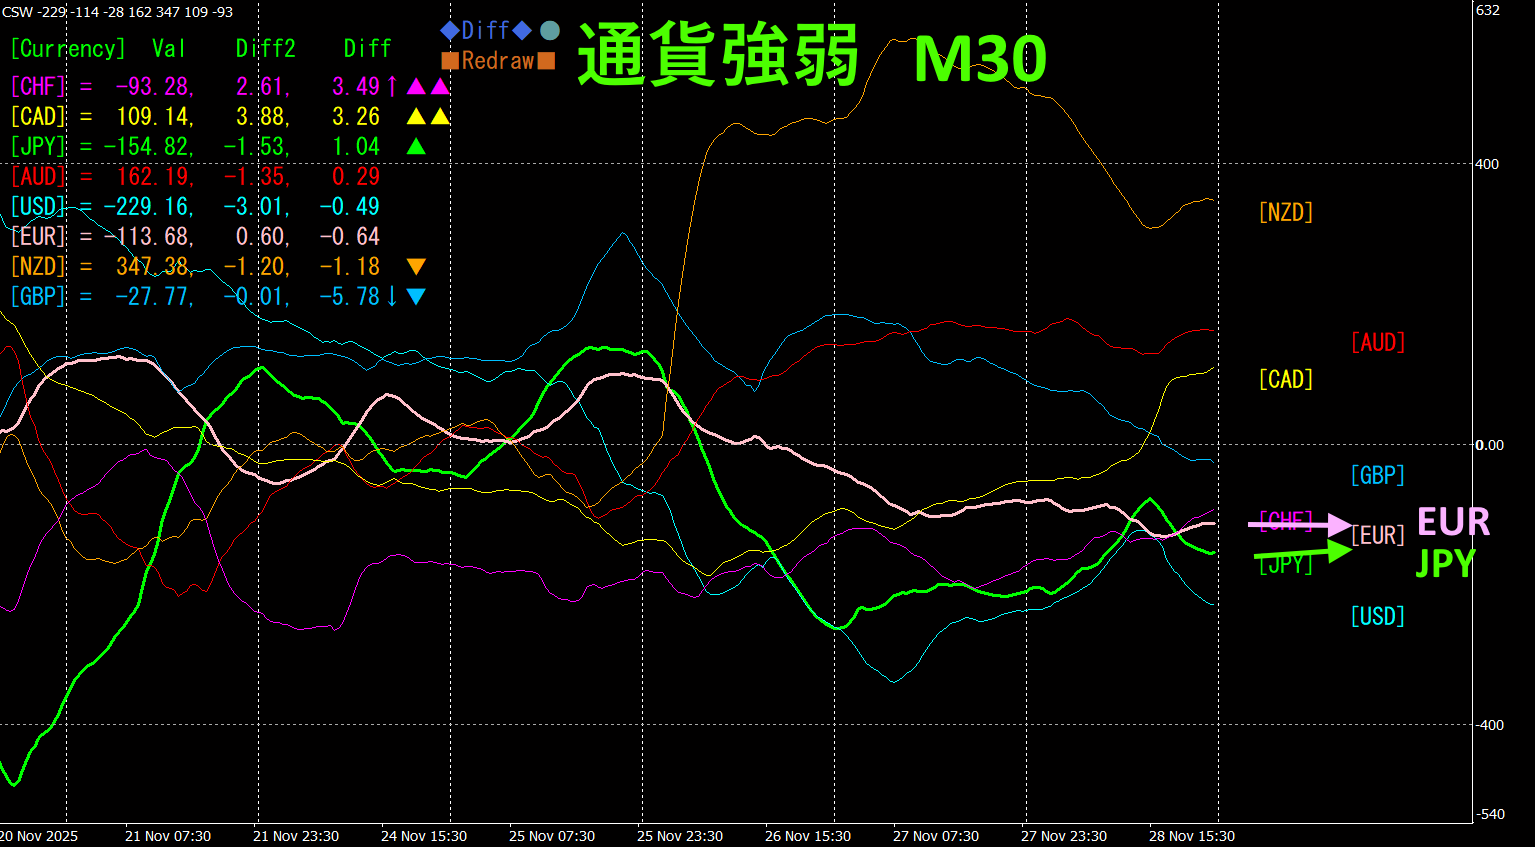
Pink representsEUR, green representsJPY. The charts forEUR andJPY intertwine. The vector directions are almost horizontal, so future direction is not clear.EURJPY is expected to remain range-bound for a while.
4.Trying the new indicatorDual_MACD_Trend_Indicator.Available
The new indicator “Dual_MACD_Trend_Indicator” is as follows.
MT4 version:https://www.gogojungle.co.jp/tools/indicators/62199
https://www.gogojungle.co.jp/tools/indicators/62202
An indicator that clearly shows trend direction with color. If the color bar is Lime, it is a buy; if Red, a sell. It is easy for beginners to use. If the bar is green, it signals an uptrend; if red, a downtrend; if no color, no trend. Because it uses color, you can grasp the trend state at a glance.
I tried this indicator on the NZDUSD1 hour chart.
The red sell zone and the green buy zone are clearly separated, making trading straightforward. There are hardly any red zones. Mostly green, so you simply buy in the green zones. Overall an uptrend, so profits come naturally. By using the “Dual_MACD_Trend_Indicator,” you can narrow trades to the parts where the trend expands.
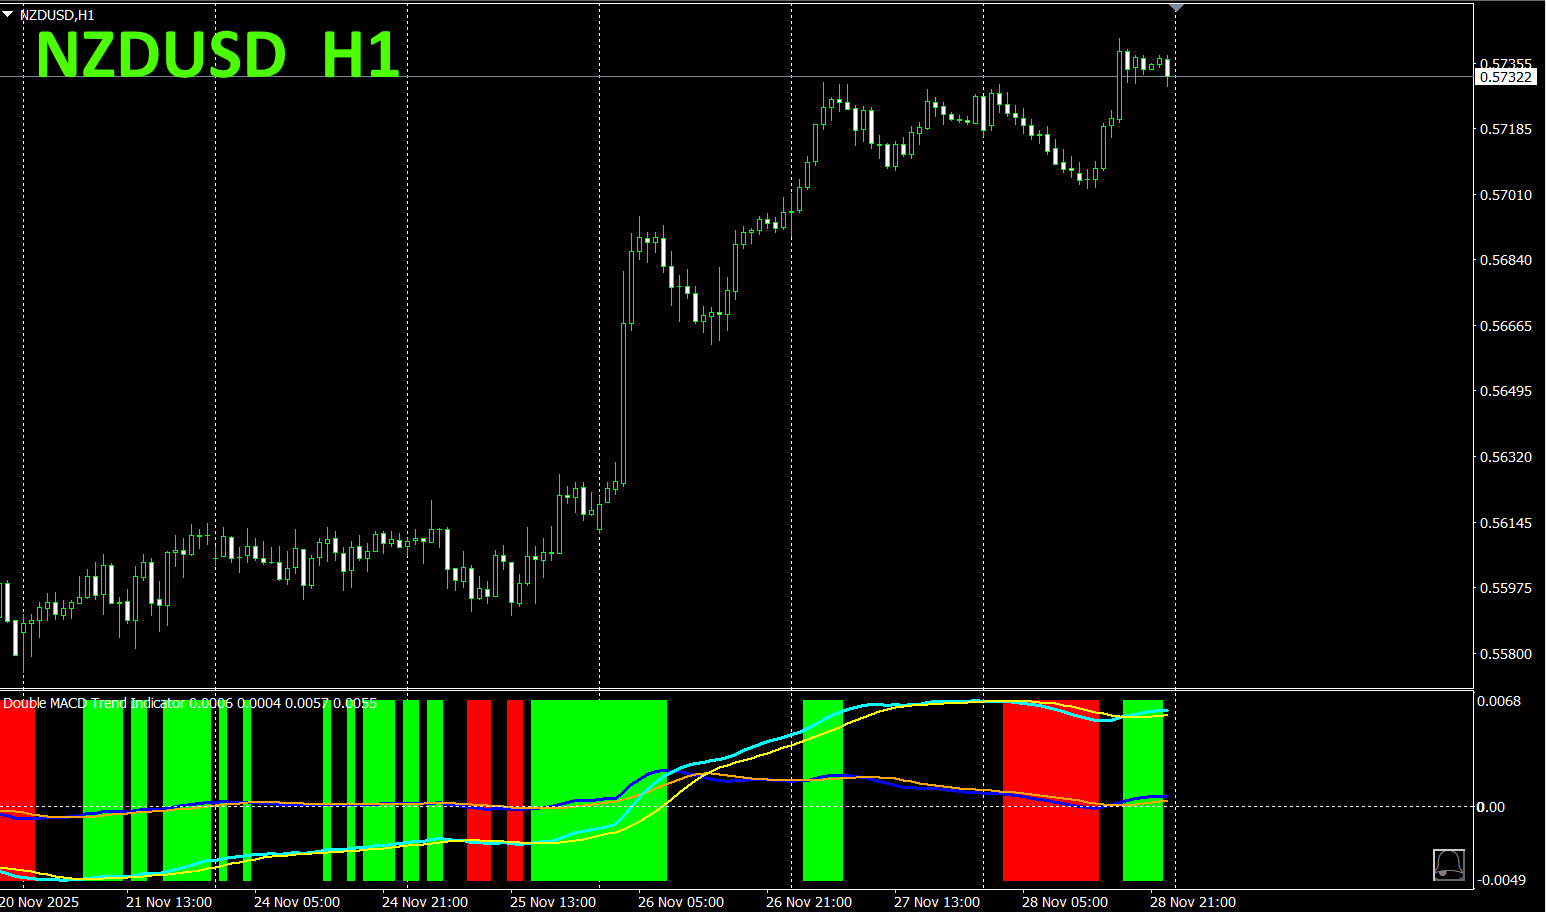
In the “Dual_MACD_Trend_Indicator, buy in green zones, sell in red zones, and do not trade in other zones.
Using theDual_MACD_Trend_Indicator eliminates any uncertainty about trade direction.
5.
“Hyper-CSW” has been released
“Hyper-CSW” is a high-performance indicator that visualizes the strength/weakness of the eight major currencies at a glance. It records the strongest currency and score for the current chart’s timeframe, accurately capturing trend persistence and turning points. Furthermore, it supports multi-timeframe analysis, showing currency strength rankings (top44 currencies) across multiple timeframes such as top currencies with scores, in M15, H1, H4, D1, and W1. With highly legible color lines and a separate window, it empowers you to discern market movement.
For details, please see the following link.
https://www.gogojungle.co.jp/tools/indicators/65082
※Recommended indicators
“8CFD Visualization IndicatorAny edition”
https://www.gogojungle.co.jp/tools/indicators/32288
“Toretore Indicator”
https://www.gogojungle.co.jp/tools/indicators/50115
“TrendLine-EX”


https://www.gogojungle.co.jp/tools/indicators/42257
“8C currency strength visualization indicator” please refer to the following page.

version https://www.gogojungle.co.jp/tools/indicators/39150
version https://www.gogojungle.co.jp/tools/indicators/39159
【My listed products】


