November 29, 2025 Dollar/Yen, Gold, S&P 500, and Nikkei 225 Environment
Create a zigzag based on Dow Theory,score the break,
display the edge (boundary/advantage),it is an MT4 indicator.
For a while, we will prepare articles sharing the charting environment with you.
We are lining up monthly, weekly, daily, and 4-hour charts of each product.
We hope it proves helpful for next week’s outlook.
Light blueandGreenare reference buying points
PinkandRedare reference selling points
For now, please refer to the horizontal bar symbols only.
Dowzag “Break Edge Pro5”If you would like to know more, please access here.
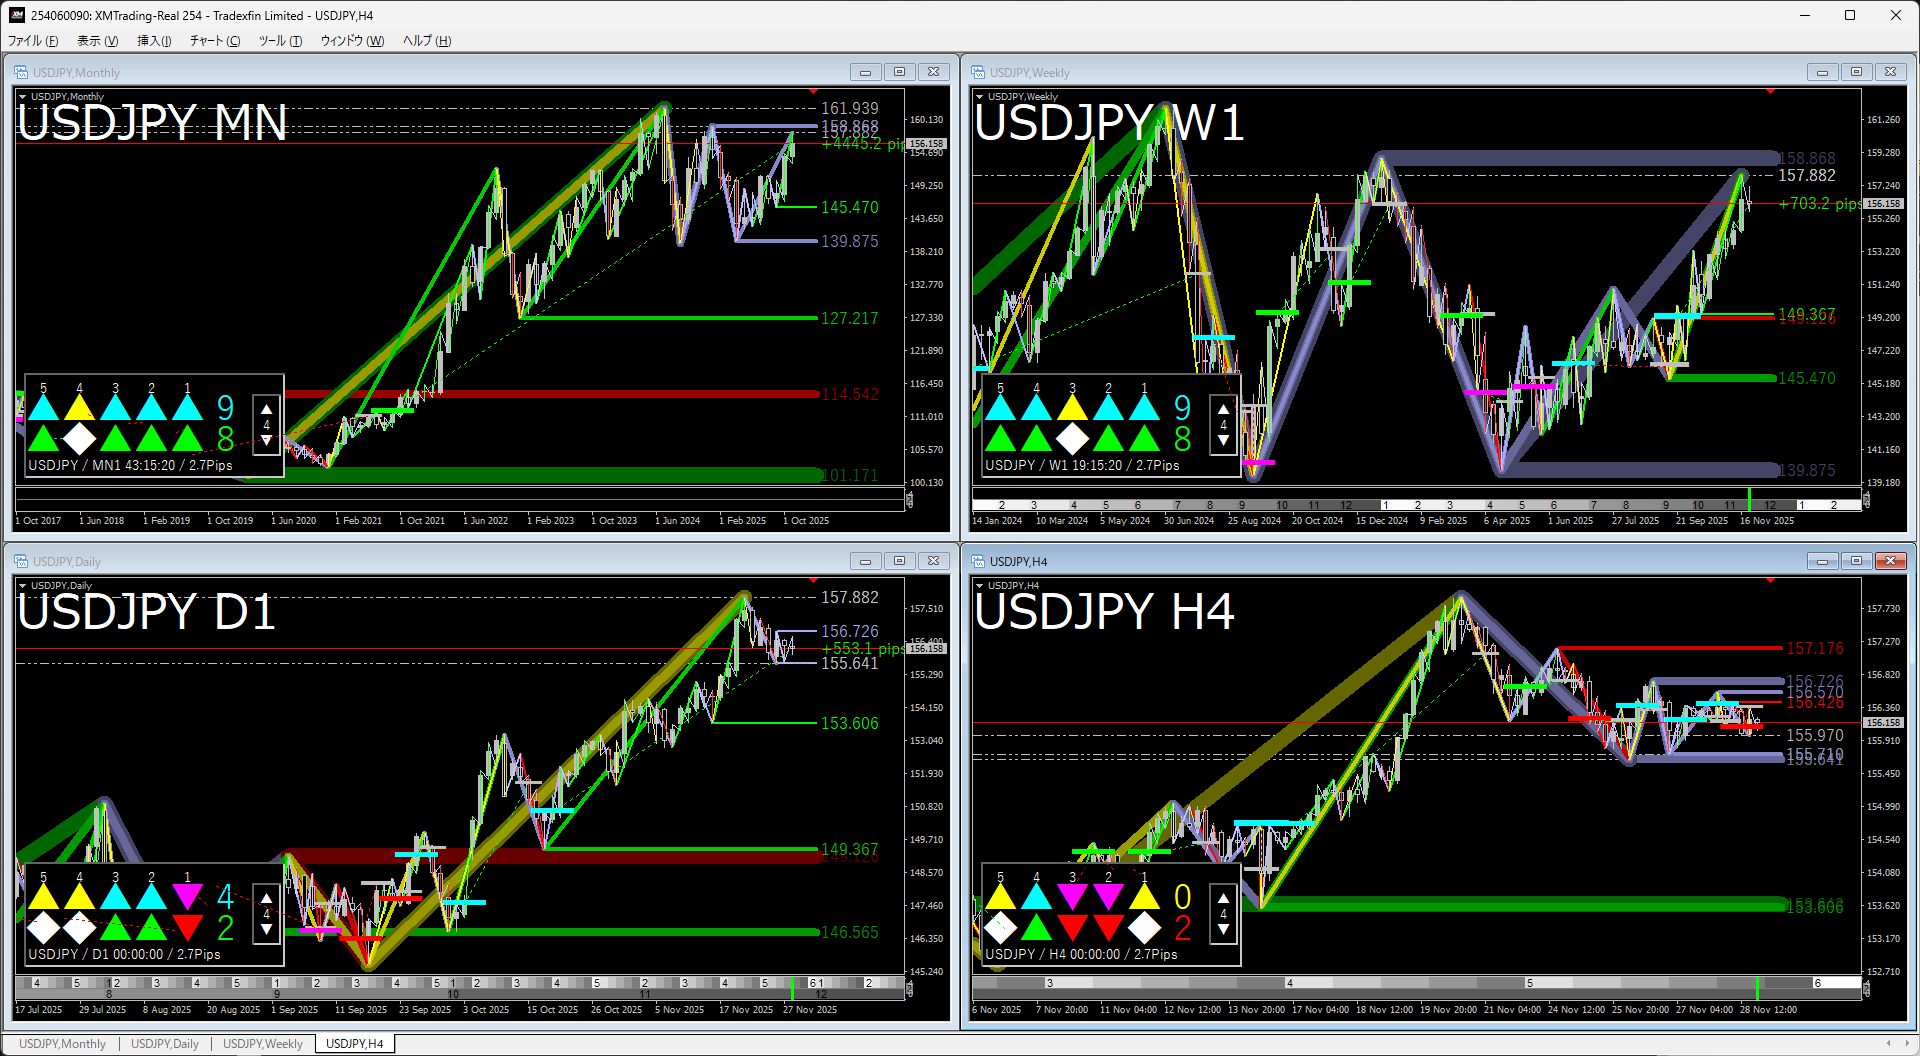
USDJPY
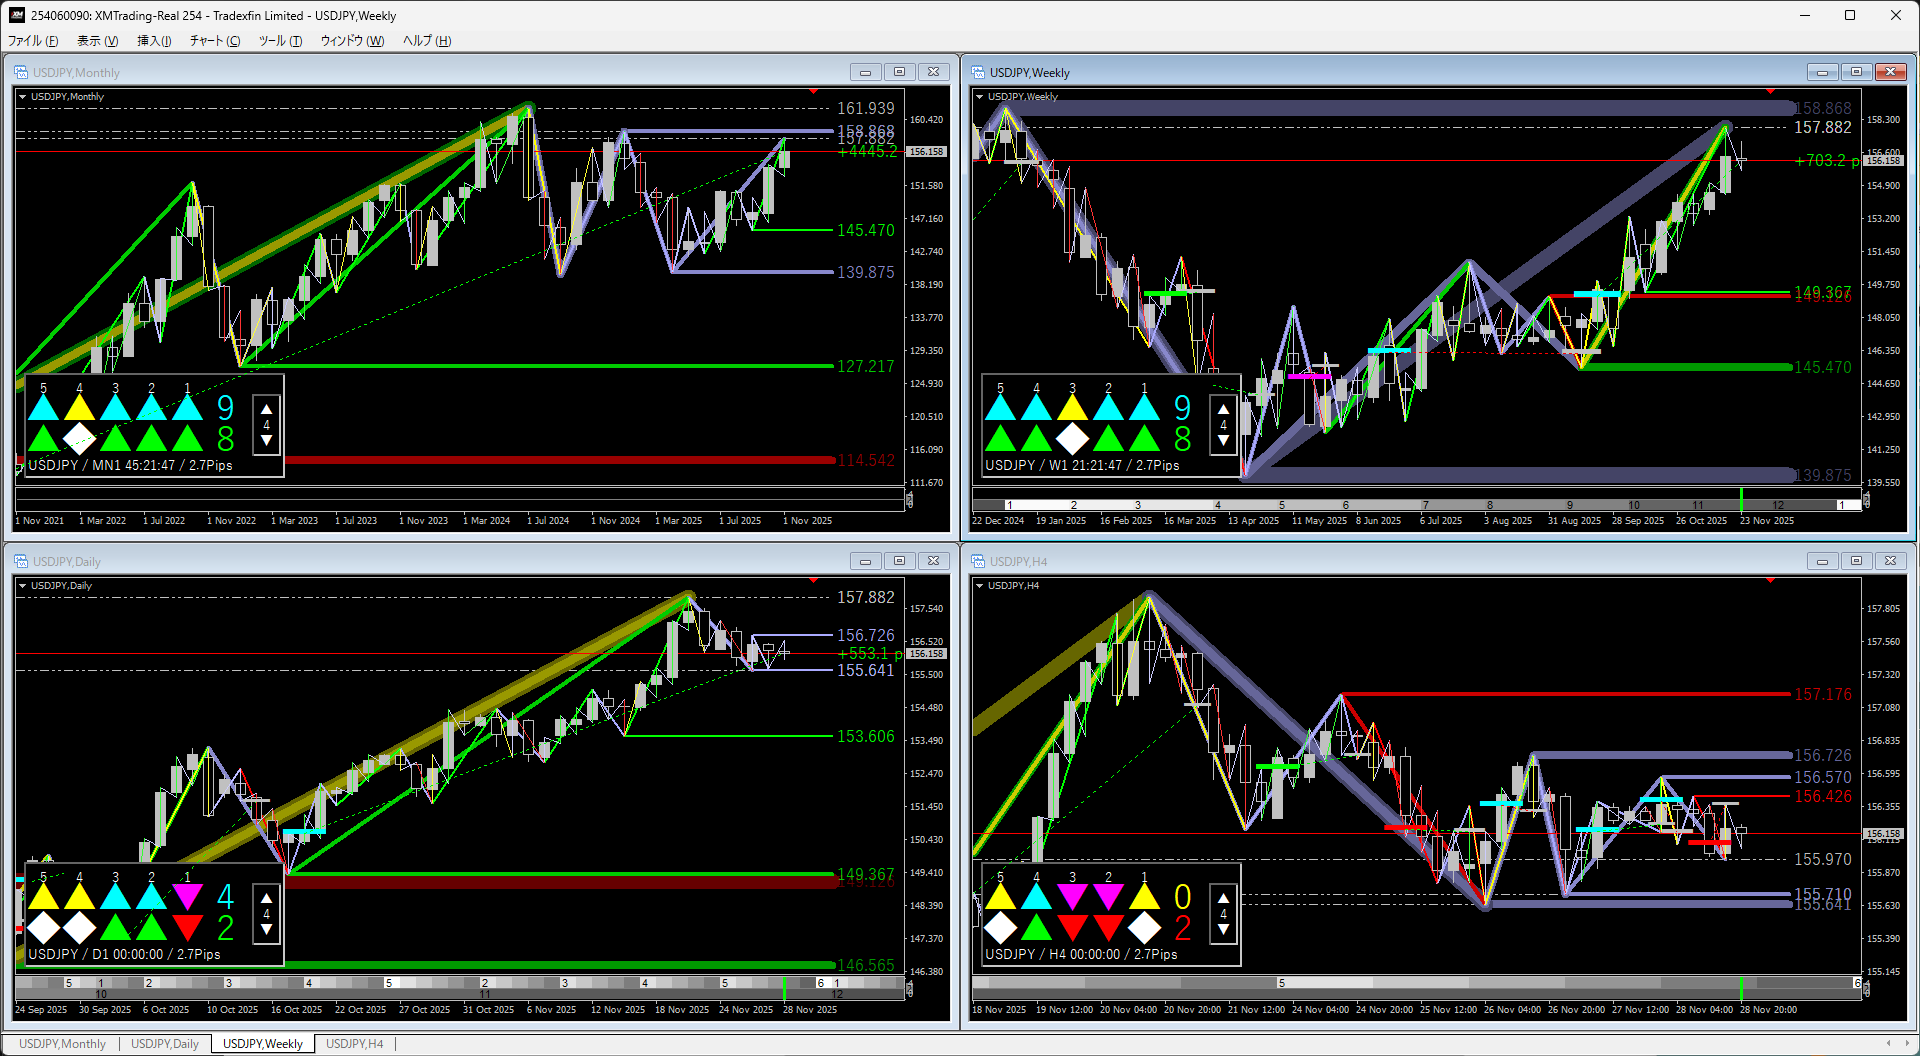
(images being added) If you make the bars smaller, you can see the whole, but it may be harder to read. Which do you prefer?
On or above the daily chart, it is in an uptrend, but on the 4-hour charta triangle consolidationis indicated by a purple horizontal line.
Trade should begin after breaking out of this triangle consolidation; until then, it’s prudent to wait and see.
Gold
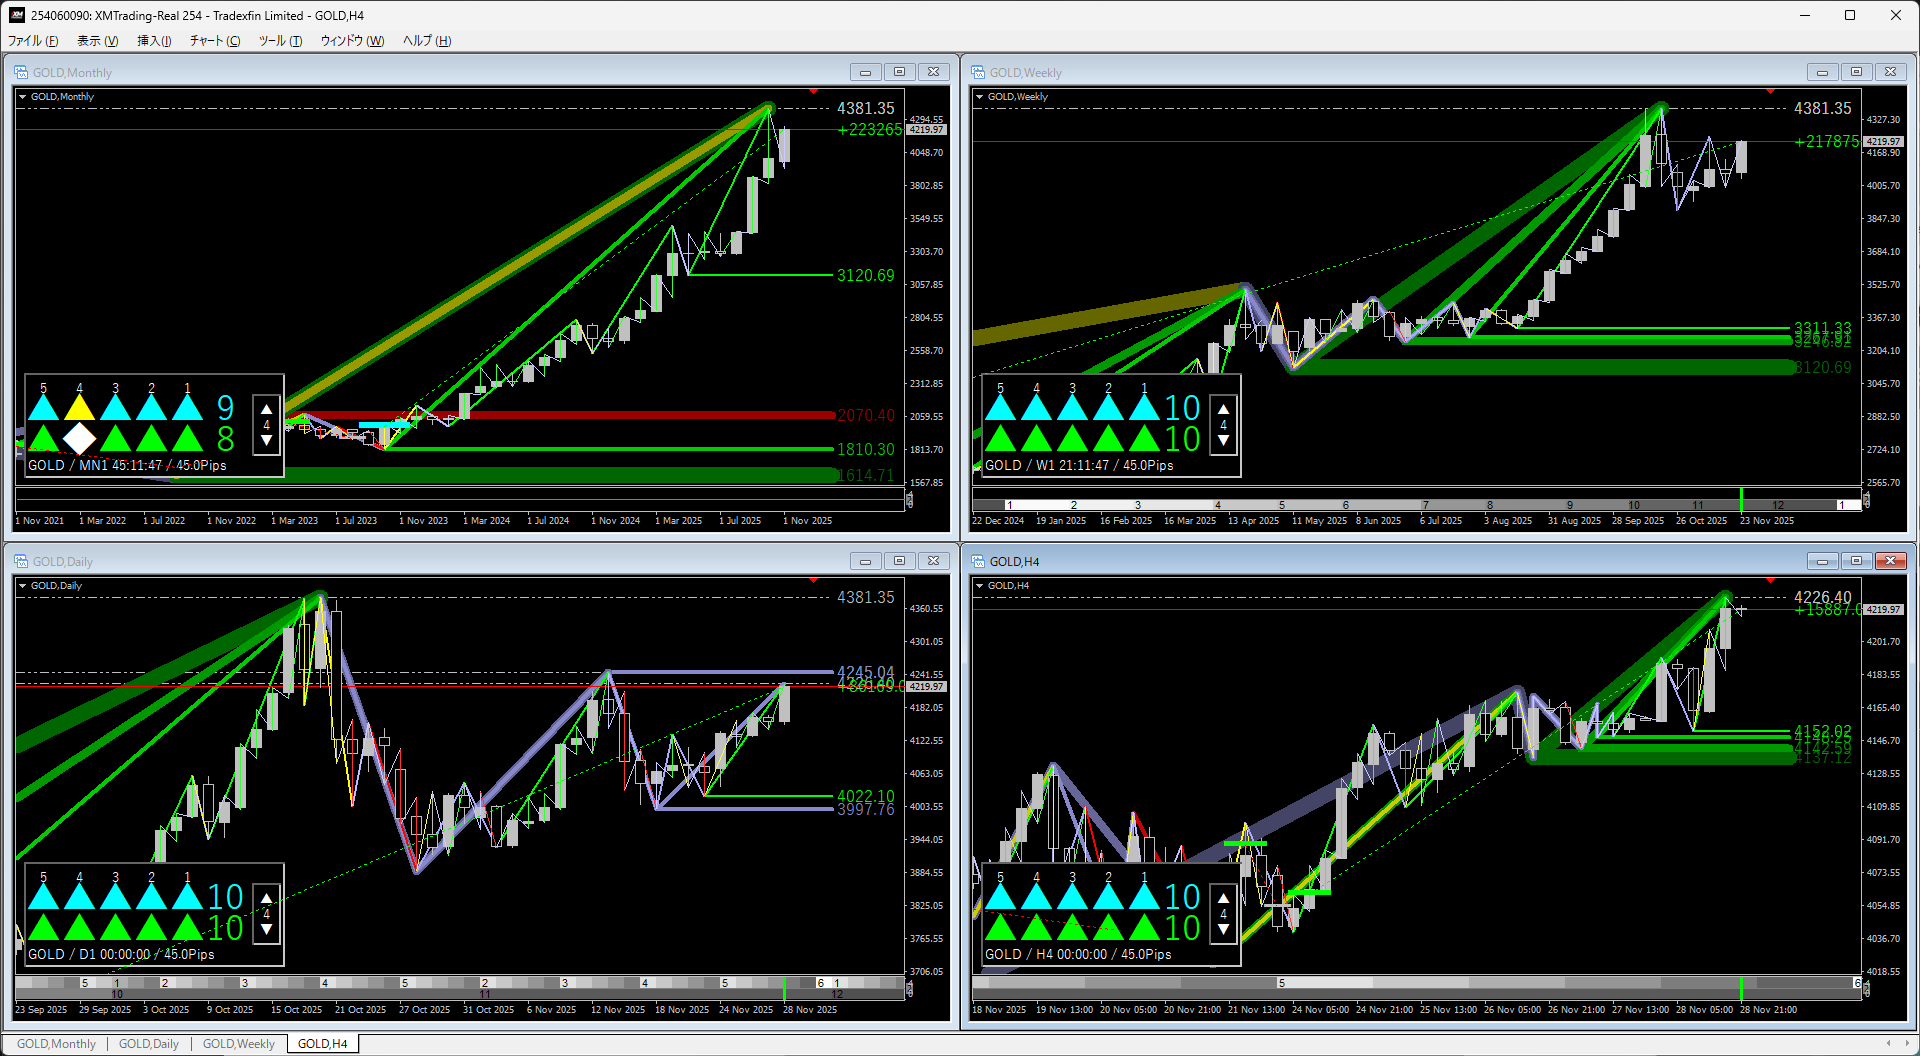
Gold remains a clear buy across timeframes.
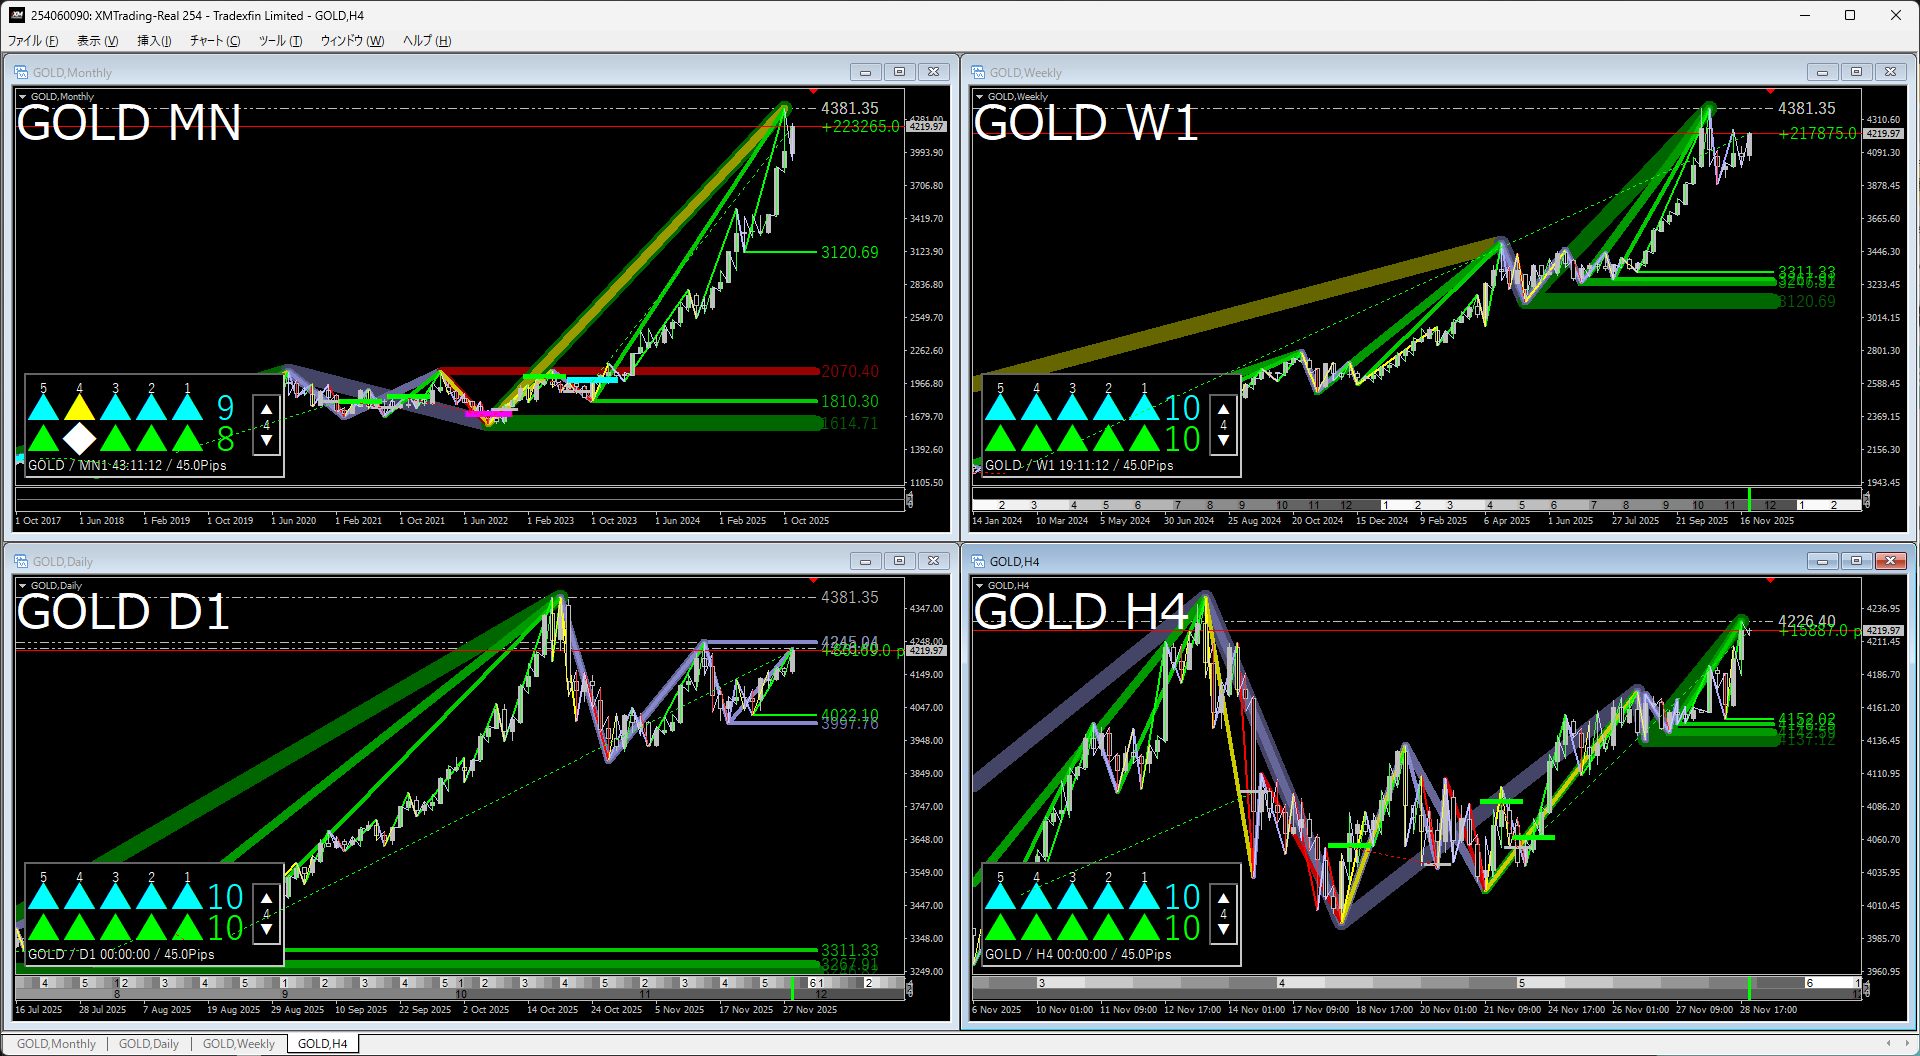
All timeframes show an uptrend, but the daily chart is showing a triangle consolidation.
First, see if it breaks upward here or observe, but a sideways move is likely.
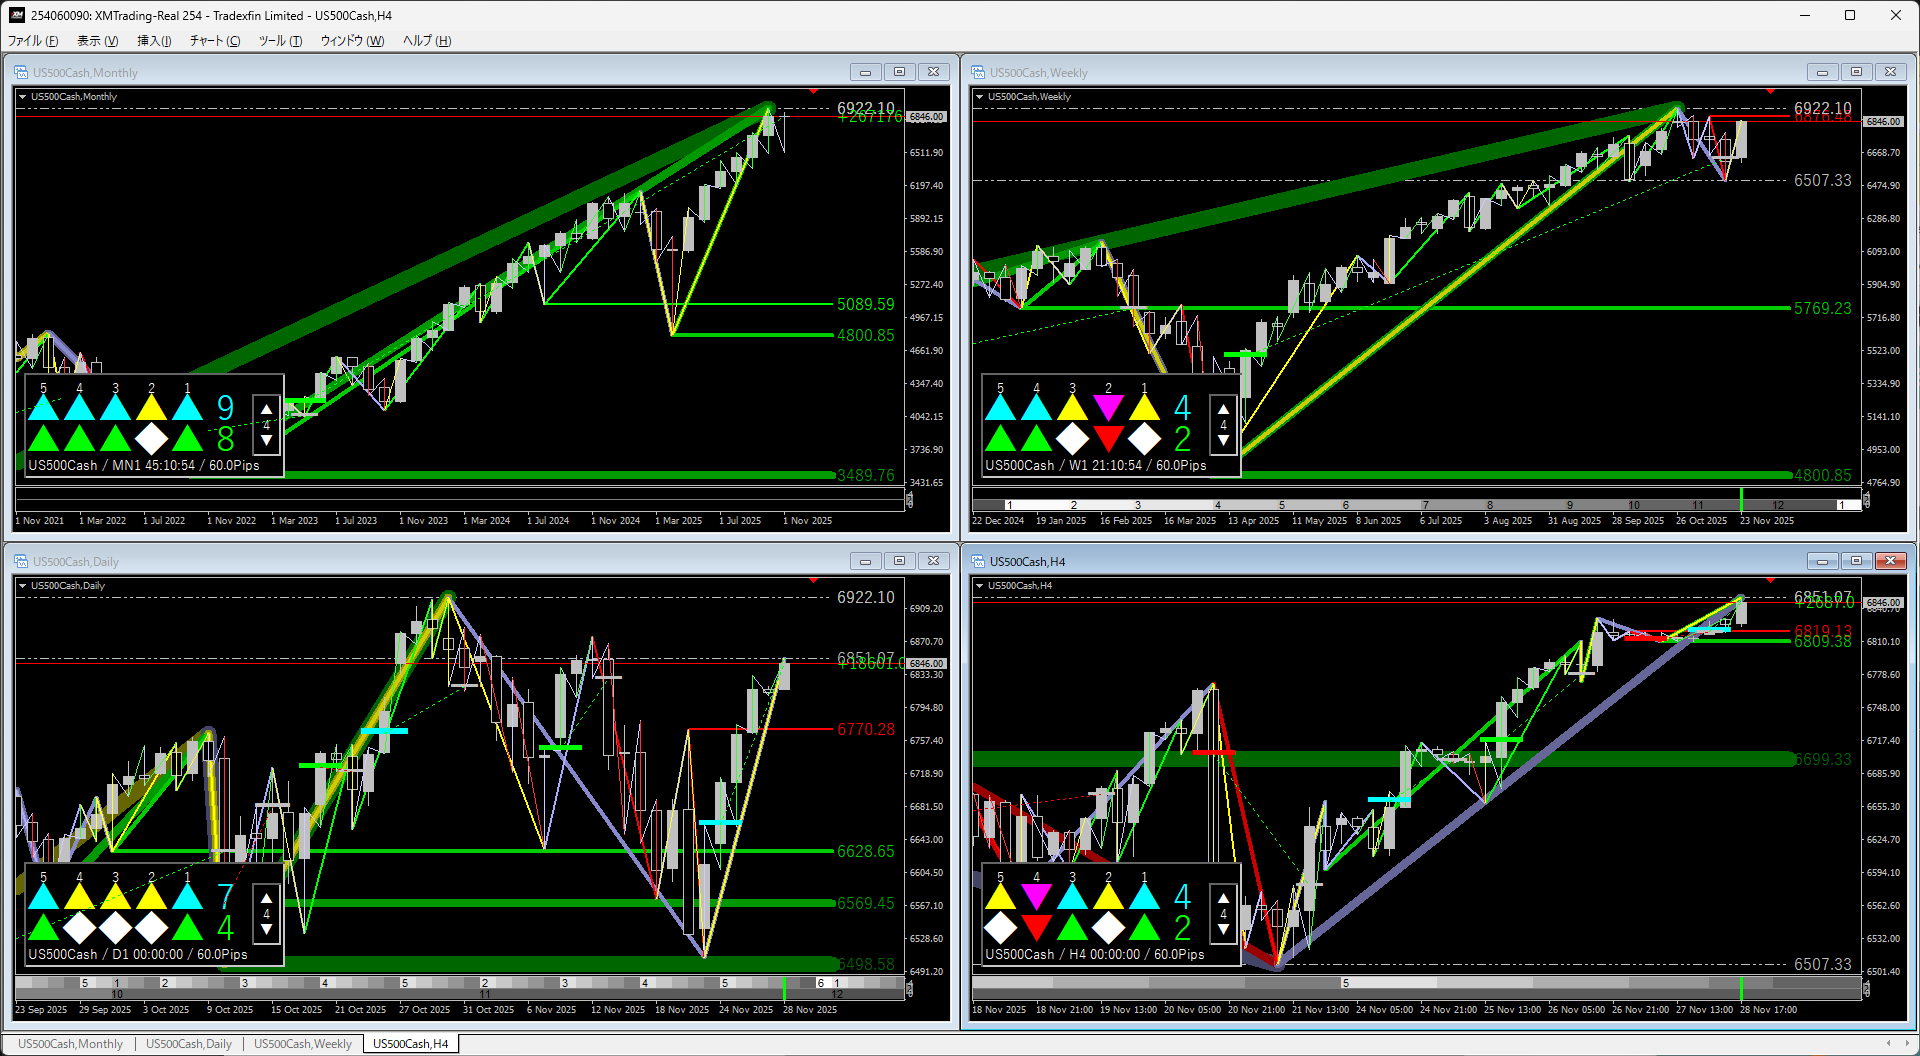
S&P 500
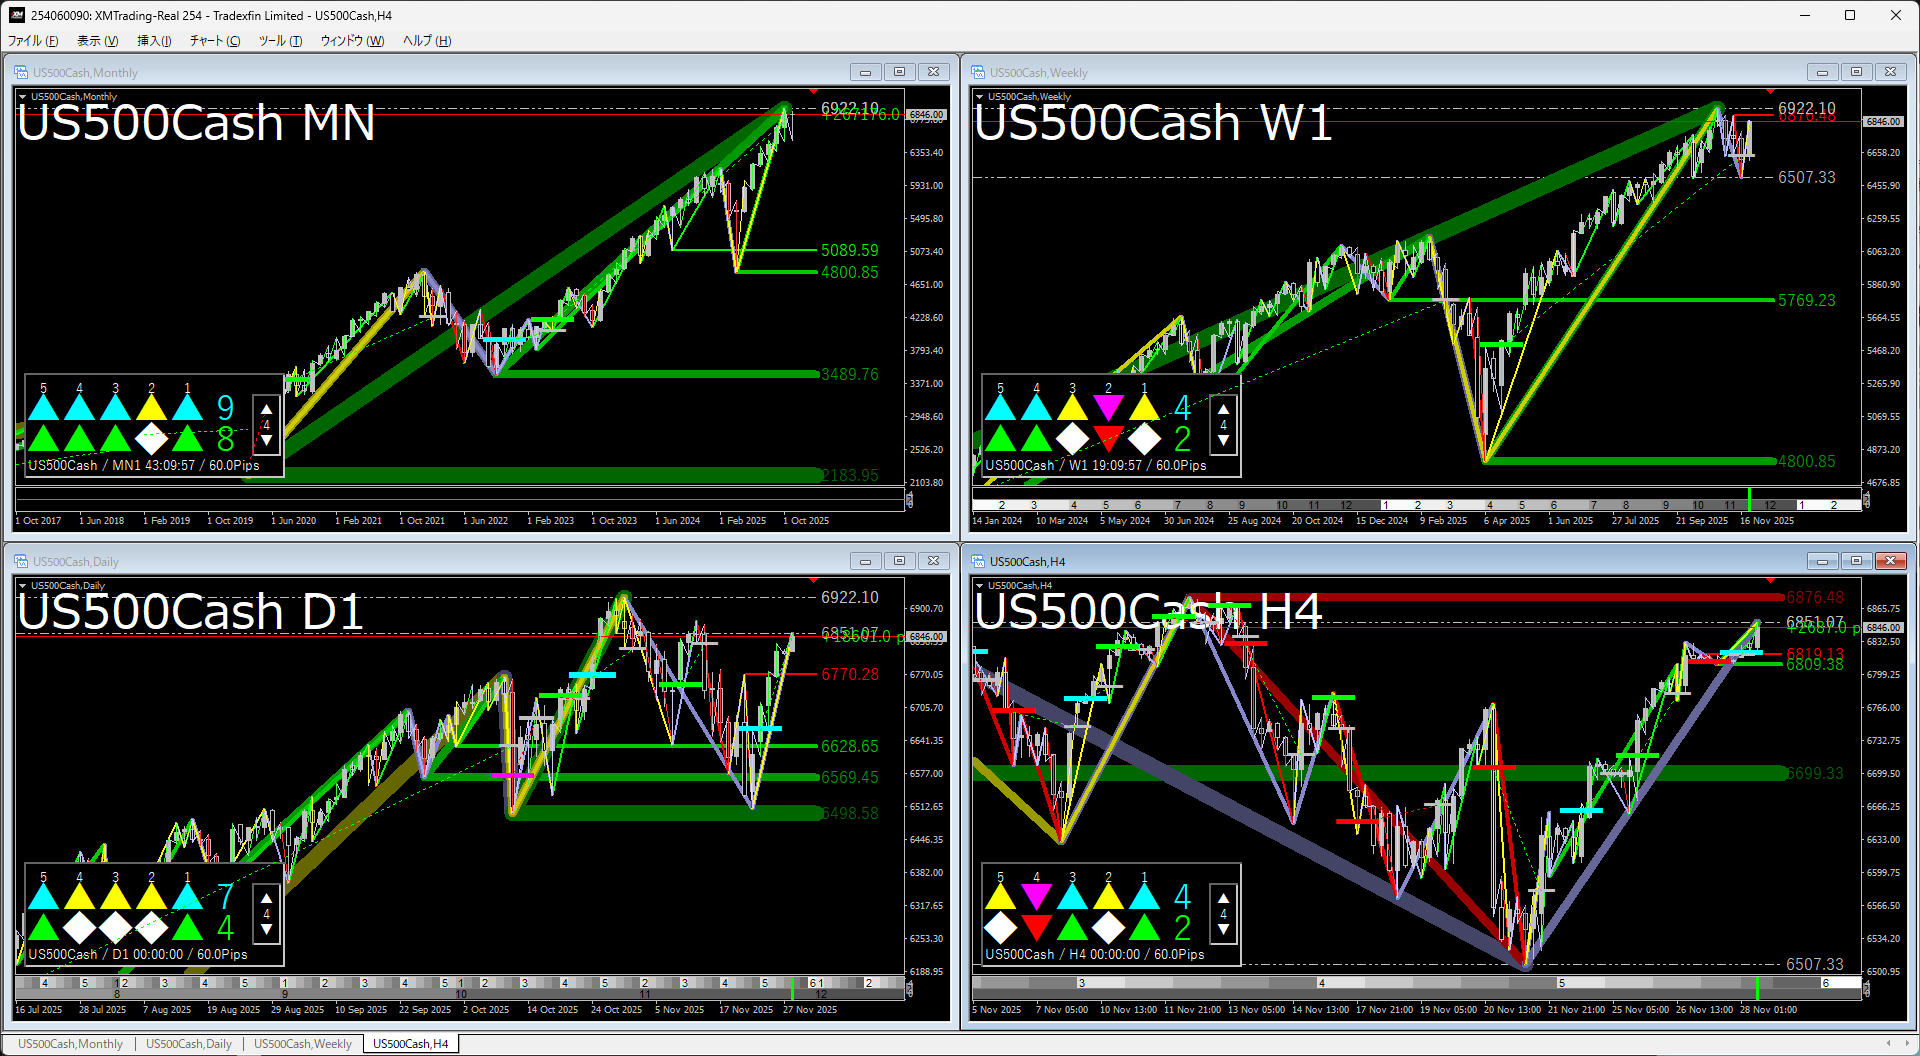
On the daily and 4-hour charts it is in an uptrend, but its current position is in an awkward spot.
Nikkei 225
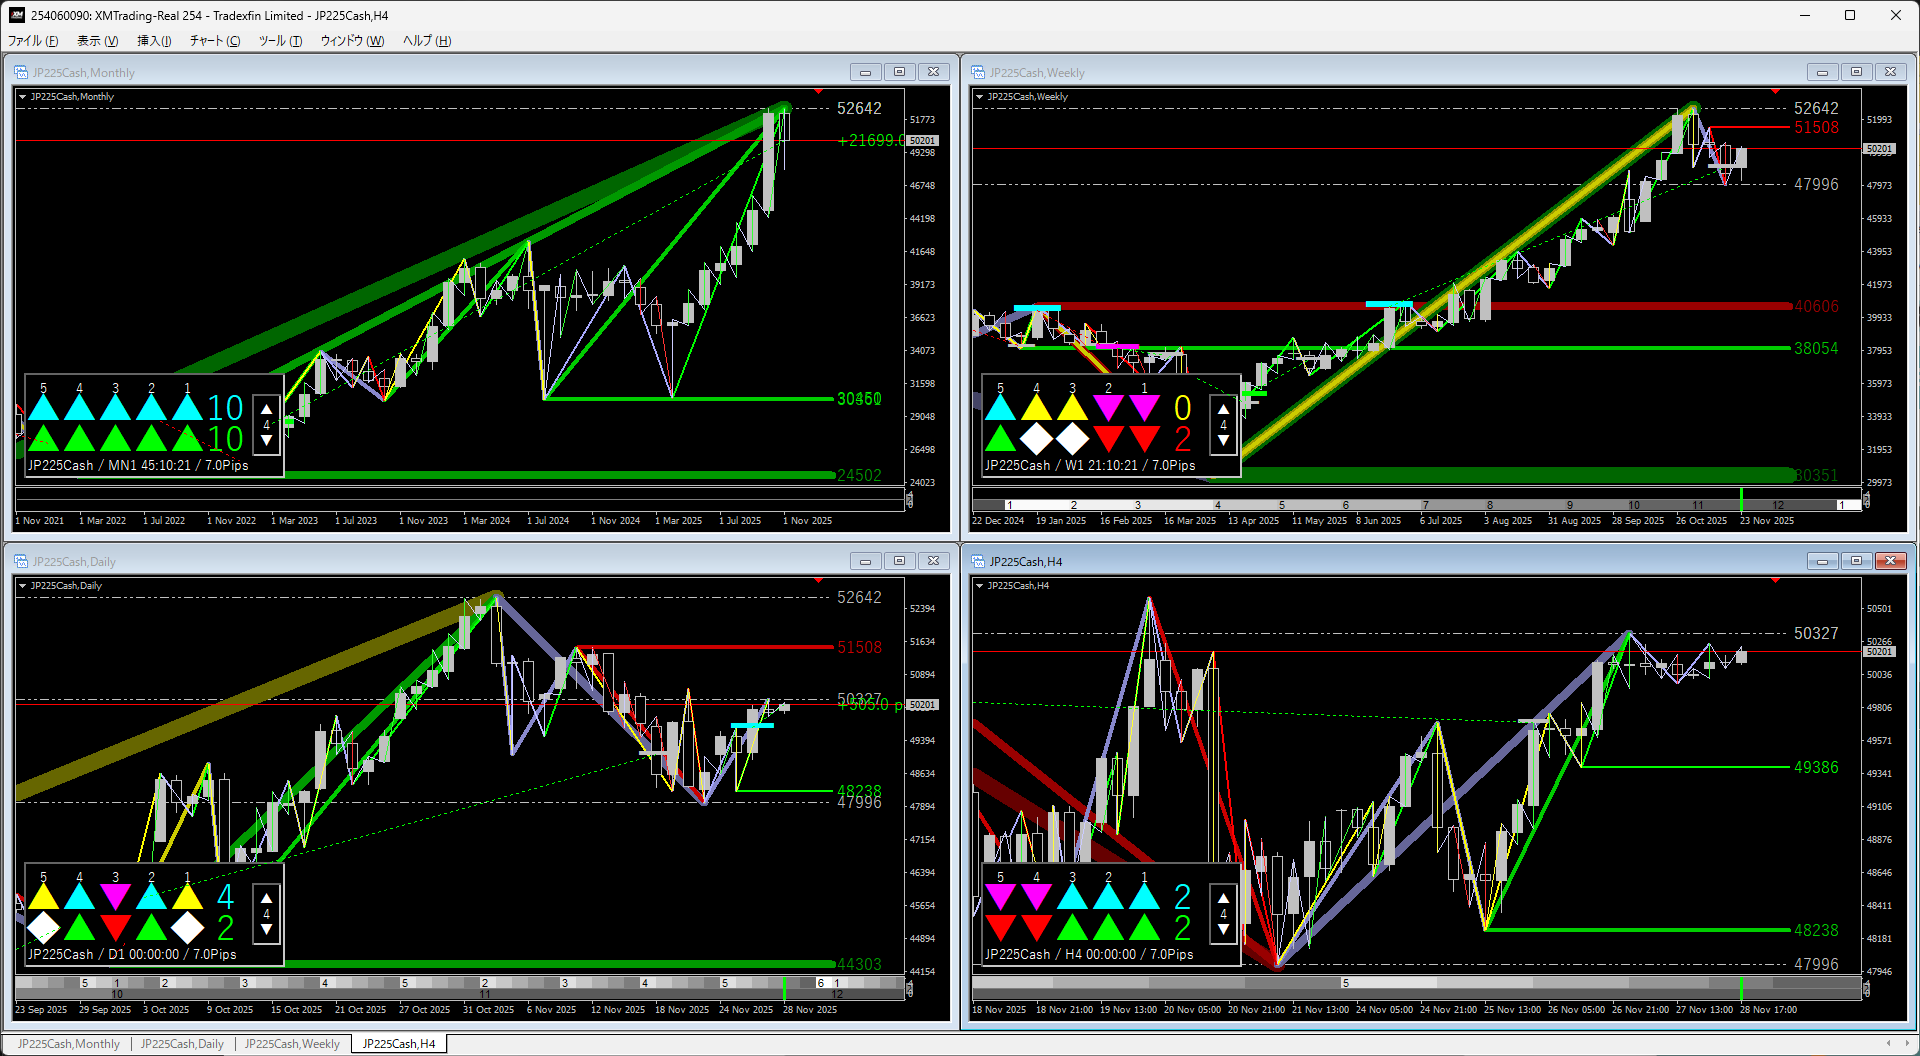
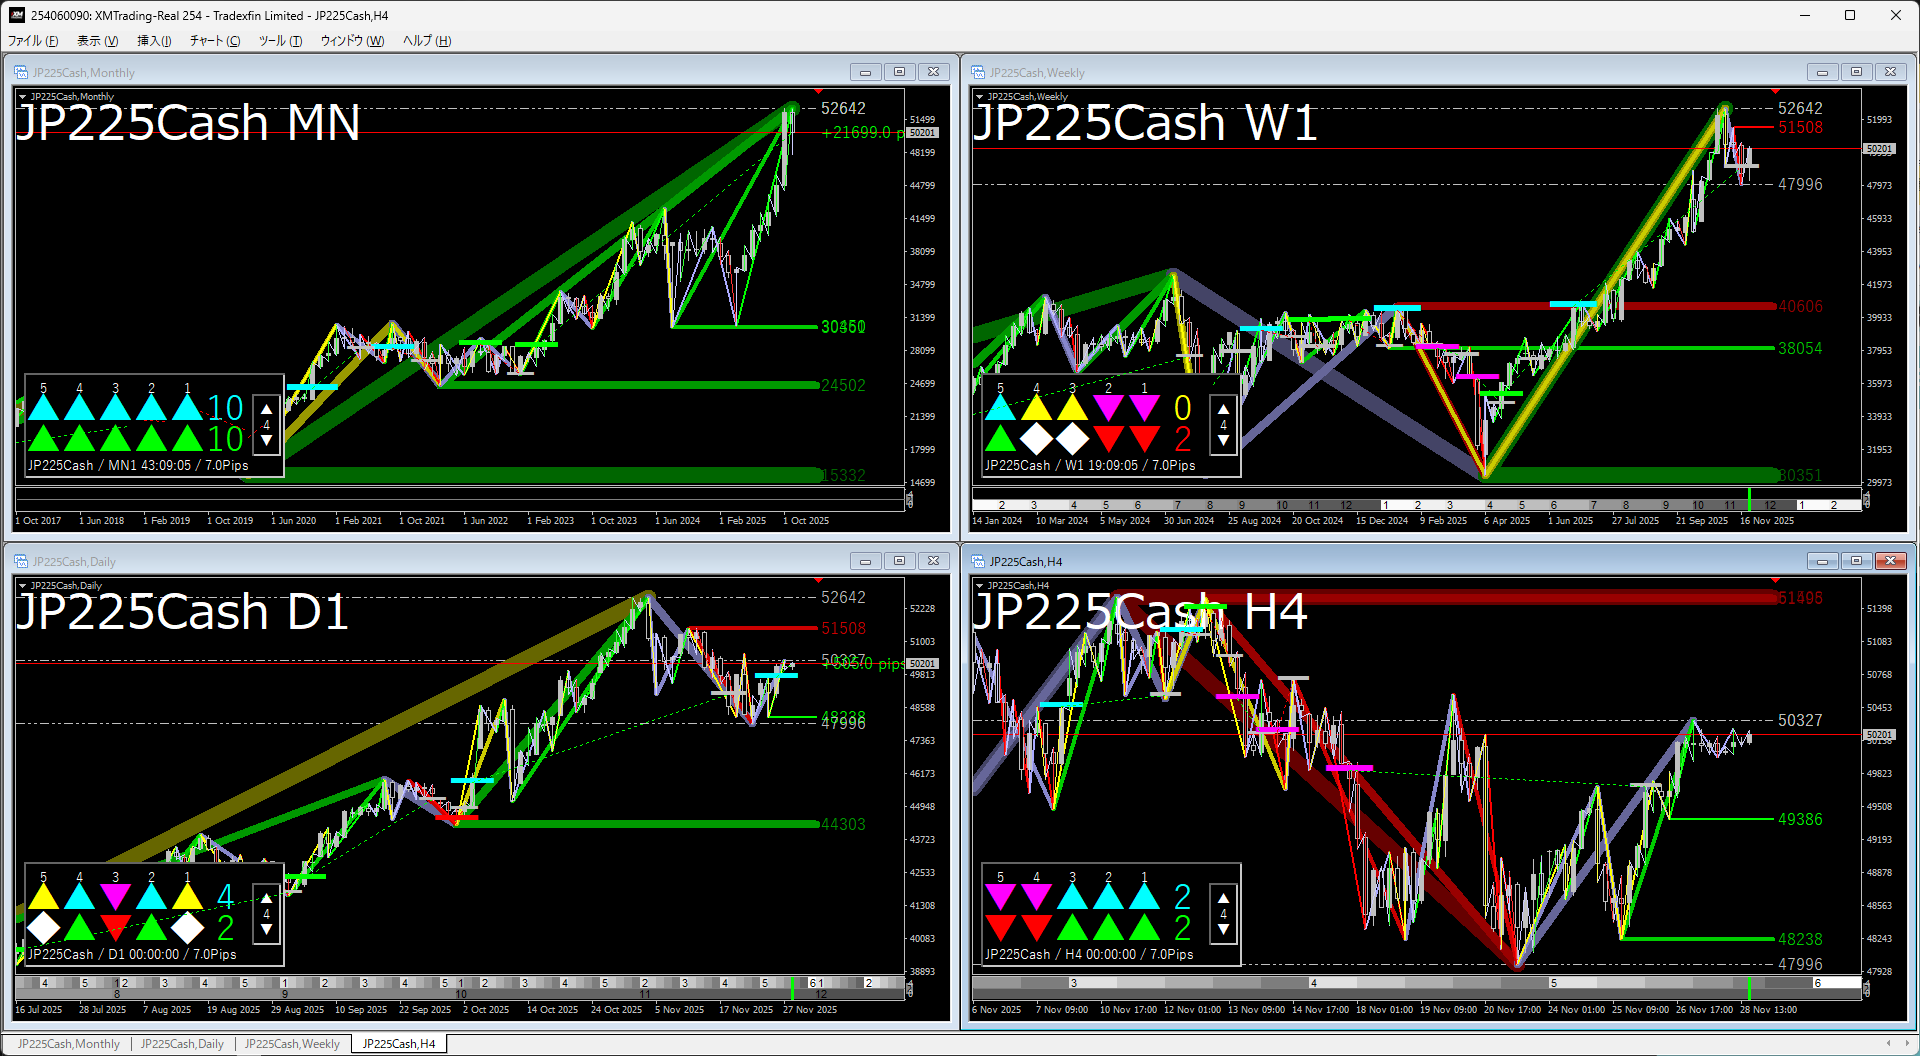
On the monthly chart the uptrend continues, but as with the S&P 500, the weekly chart shows reference exit points.
It has temporarily settled, but on the daily chart there are buy reference signals.
If it pulls back and a buy signal appears on the 4-hour chart, entering may be good.
Nothing more is written below.
If you’d like to continue seeing this article, please press the button.