

【Read FX with Tri-Currency Parity — Turning Everyday “Distortions” into Profits with TriParity Analysis】 Episode 3: Diagramming the Tri-Currency Parity — A new concept of a “1 set” called Triad
Last time, I talked about how "watching only 2 currencies as a pair prevents you from seeing the market’s 'structure'."This time, taking a step further—from there—
what you can see when you treat 3 currencies as a single Triad, and I’ll convey it as much as possible with diagrammatic imagery.
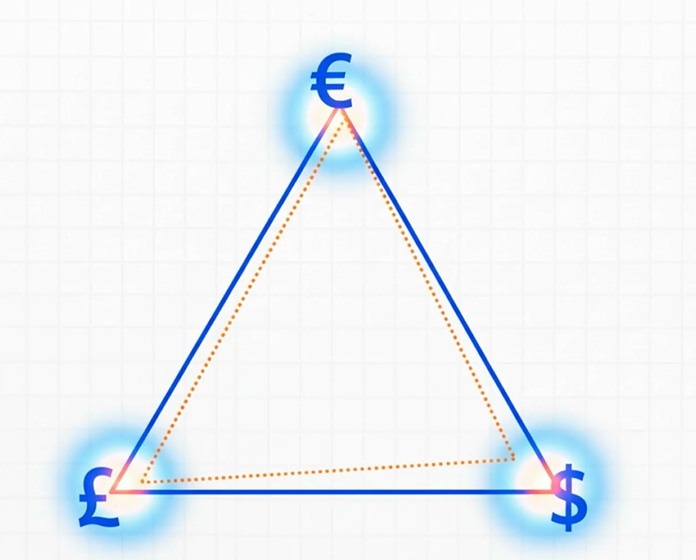
1. Start with a simple triangular relationship
In FX, for example,EUR・GBP・USDare three currencies, which allow you to form
-
EURUSD
-
GBPUSD
-
EURGBP
three currency pairs.
What’s important here is not that these three move independently, but thatthey are in a relationship that should logically interlockas a triangle in which the parts fit together.
If you write it mathematically, it looks like this.
EURUSD ÷ GBPUSD ≒ EURGBP

For example,
-
EURUSD = 1.20
-
GBPUSD = 1.50
then the theoretical EURGBP would be
1.20 ÷ 1.50 = 0.80
approximately … that’s the idea.
Actual rates won’t match exactly due to spreads and market fluctuations, but
there exists an “equation” that the trio should naturally align with—
this isthe Triad parity (the consistency condition of the triangle).
2. Triad (Triad) = concept of a 3-currency set
In this way, the three pairs formed by three currencies are
“Triad = 3-currency set”, treated as a single unit, which is the starting point of TriParity analysis.
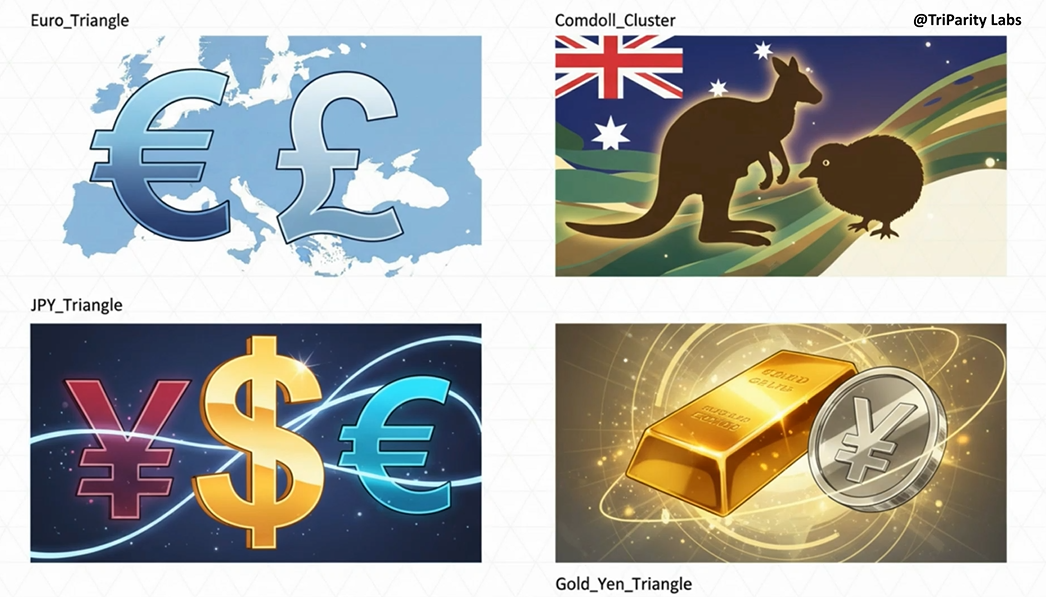
Here are a few representative Triads for visualization.
-
Euro_Triangle
-
Pairs: EURUSD | GBPUSD | EURGBP
-
What to look at? → See the structure that is formed when you remove the influence of USD from the relationship between EUR and GBP.
-
-
Comdoll_Cluster
-
Pairs: AUDUSD | NZDUSD | AUDNZD
-
What to look at? → Compare AUD vs NZD, two commodity currencies, while removing USD noise.
-
-
JPY_Triangle
-
Pairs: EURUSD | USDJPY | EURJPY
-
What to look at? → View EUR vs JPY movements in a three-dimensional view using USD as a mediator.
-
-
Gold_Yen_Triangle
-
Pairs: XAUUSD | USDJPY | XAUJPY
-
What to look at? → Analyze the yen-denominated gold price (XAUJPY) by decomposing it from dollar-priced gold and the USD/JPY pairing.
-
For each Triad,
-
what currency relationships you want to extract
-
which markets (Europe, Asia, commodities, safe assets, etc.) you’re sensitive to
and other “characteristics” differ.
Instead of looking at each pair in isolation, treat as a single 1-unit of three.
This is the first key point of the Triad concept.
3. A baseline that “should be coupled like this”
The strongest point of the Triad is
to have from the outset a baseline that this trio should fit together in this way
.
In the earlier EUR/GBP/USD example,
EURUSD ÷ GBPUSD = (theoretical) EURGBP
you can calculate a “theoretical value A/C.”
Then by comparing it with the actual EURGBP rate,
“how much is it not in sync right now?”
= “how distorted is it?”
you can quantify it.
This difference between the theoretical value and the actual is
called the Parity Gap in TriParityParity Gap.
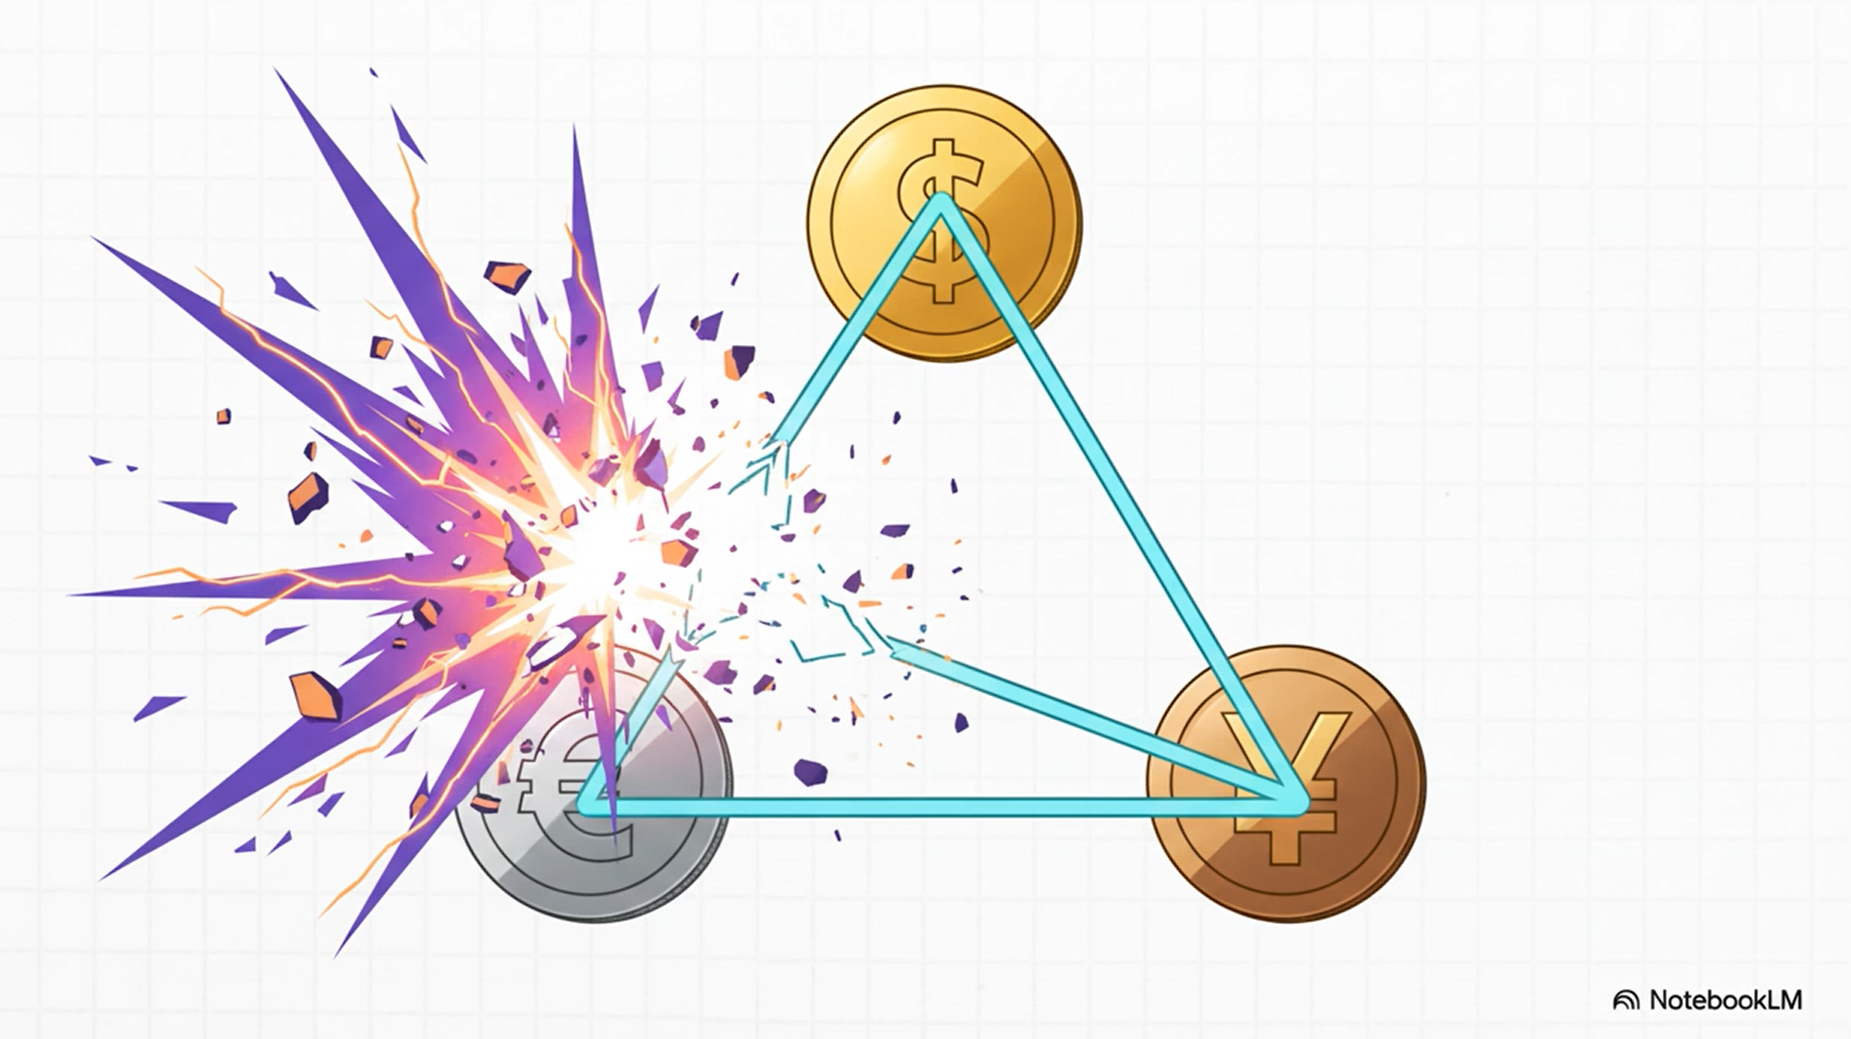
4. Parity Gap = the distortion in the triangular relationship itself
As a mental image, it looks like this.
-
Step 1: Decide the Triad
-
Example: EURUSD / GBPUSD / EURGBP
-
-
Step 2: Calculate the theoretical rate
-
EURUSD ÷ GBPUSD → theoretical EURGBP
-
-
Step 3: Compare with the actual EURGBP
-
Take the difference (gap) between the“theoretical value” and the actual rate
-
-
Step 4: Track that gap as a single sequence
The larger the gap becomes,
“This triangle of three currencies is far from its natural coupling”
in other words.
Conversely, if the gap returns near zero,
“The distortion is resolved and the triangle re-aligns”
that is how it is viewed.
In TriParity analysis, this Parity Gap is furtherstandardized using a Z-score and plotted as a “Distortion Line”to visualize in one line how abnormal the current distortion is compared with past statistics.
(Details on Z-scores will be covered in depth in Episode 4.)
5. You can see who contributes most to the distortion
An interesting aspect of the three-currency parity is that
“not only the magnitude of the misalignment, but
which of the three pairs contributes how much to that misalignment” can be analyzed
.
Specifically, there are cases where
-
as a whole the Triad shows a significant distortion
-
but, upon decomposition,
-
EURUSD and GBPUSD are relatively stable
-
EURGBP alone is “one person going rogue”
-
In such cases,
“the main offender of distortion is EURGBP (the cross).
the other dollar-strengths are not distorted to the same extent”
that structure becomes apparent.
Conversely, if
-
EURGBP and GBPUSD are calm
-
EURUSD is moving extremely
then
“the push-orchestrator in this Triad is EURUSD”
can be judged.
TriParity analysis incorporates a mechanism to visualize such“who is pushing the most (leading leg)”and
allows structural-level judgment on which pair to build with.
6. Each Triad has a different “visible world”
Based on what’s been discussed up to Episode 2,
“which Triad you choose changes the world you can see”
I think you can imagine this naturally.
A few examples include──
-
Euro_Triangle (EURUSD / GBPUSD / EURGBP)
→ See the tug-of-war between EUR and GBP inside Europe, excluding the influence of USD.
-
Comdoll_Cluster (AUDUSD / NZDUSD / AUDNZD)
→ See the “wins and losses among commodity currencies” detached from USD movements.
-
JPY_Triangle (EURUSD / USDJPY / EURJPY)
→ See the relationship between EUR and JPY, viewing USD as a driver and cross-JPY as a single structure.
-
Gold_Yen_Triangle (XAUUSD / USDJPY / XAUJPY)
→ See the movement of yen-denominated gold by decomposing gold with the USD/JPY pairing.
Even when looking at the same USDJPY or EURUSD charts, the meaning of the “ distortion” changes greatly depending on which Triad you view it as a part of.
7. A decisive difference from analyzing a single currency pair
To summarize the above against single-pair analysis──
Single currency pair analysis
-
Looking at the overextensions/returns contained within that pair alone
-
Market structure can only be supplemented by multiple charts “by impression”
-
Who is the lead actor and why distortion occurs tends to be vague
Triad-based three-currency parity analysis
-
From the start“1 relationship among 3 currencies”is held
In other words,
“By introducing Triad as a ‘one-set view,’
we can reorganize what used to be done by feel into a framework based on equations and statistics.
.”

This is the main point when diagramming three-currency parity.
8. Next time preview — Turning distortion into numbers with the Parity Gap and Z-score
This time,
-
Form a Triad with 3 currencies
-
Originally, the triad parities should be “in sync” within a single triad relationship
-
Chasing the part where it deviates = Parity Gap
-
Also break down which pair contributes most to the distortion
We’ve organized these as visually as possible.
Next time, we’ll evaluate this Parity Gap from the perspective of
“how abnormal the distortion is compared to past statistics”
and
convert it into a metric called the Z-score (how many standard deviations away).
From here on, this becomes an entry into practical trading strategies of distortion and mean-reversion, so please stay with us for the continuation.
※The contents of this series reflect the author’s personal views and do not endorse specific currency pairs or trades.
Final investment decisions should be made at your own risk.
Video summary (Japanese version)
Video summary (English version)