

[Practical Explanation Part 6] Selling Weakness, Buying Weakness Reversal Signal v1.0 — Weekly Screening Edition for Top 200 Prime Stocks by Market Cap: Part 1
----------------------------
✨Sell Exhaustion Buy Exhaustion Reversal Signal v1.0
Weekly Screening of Top 200 Prime Market Capitalization Companies: Part 1
----------------------------
?Introduction — This Week's Theme
In this article,
?Screening the top 200 TSE Prime stocks on TradingView by weekly charts
?Extract BUY/SELL with “Sell Exhaustion Buy Exhaustion Reversal Signal v1.0”
?In the most recent weekly chartwe thoroughly analyze the 19 stocks where BUY/SELL lit up in reverse chronological order with ahead-of-time stock-by-stock detail
will be performed.
Additionally this time,
・BUY/SELL list
・Reasons for reversal points by stock
・Future price movement outlook (bullish / neutral / bearish scenarios)
has been comprehensively covered.
?List of 19 Stocks (BUY/SELL)
?BUY Signals (16 stocks)
No Stock Code Comment
1 Kikkoman 2801 Down move completed → reversal BUY 2 Asahi Kasei 3407 Bottom formation then reversal BUY 3 Nexon 3659 Re-acceleration BUY from pullback
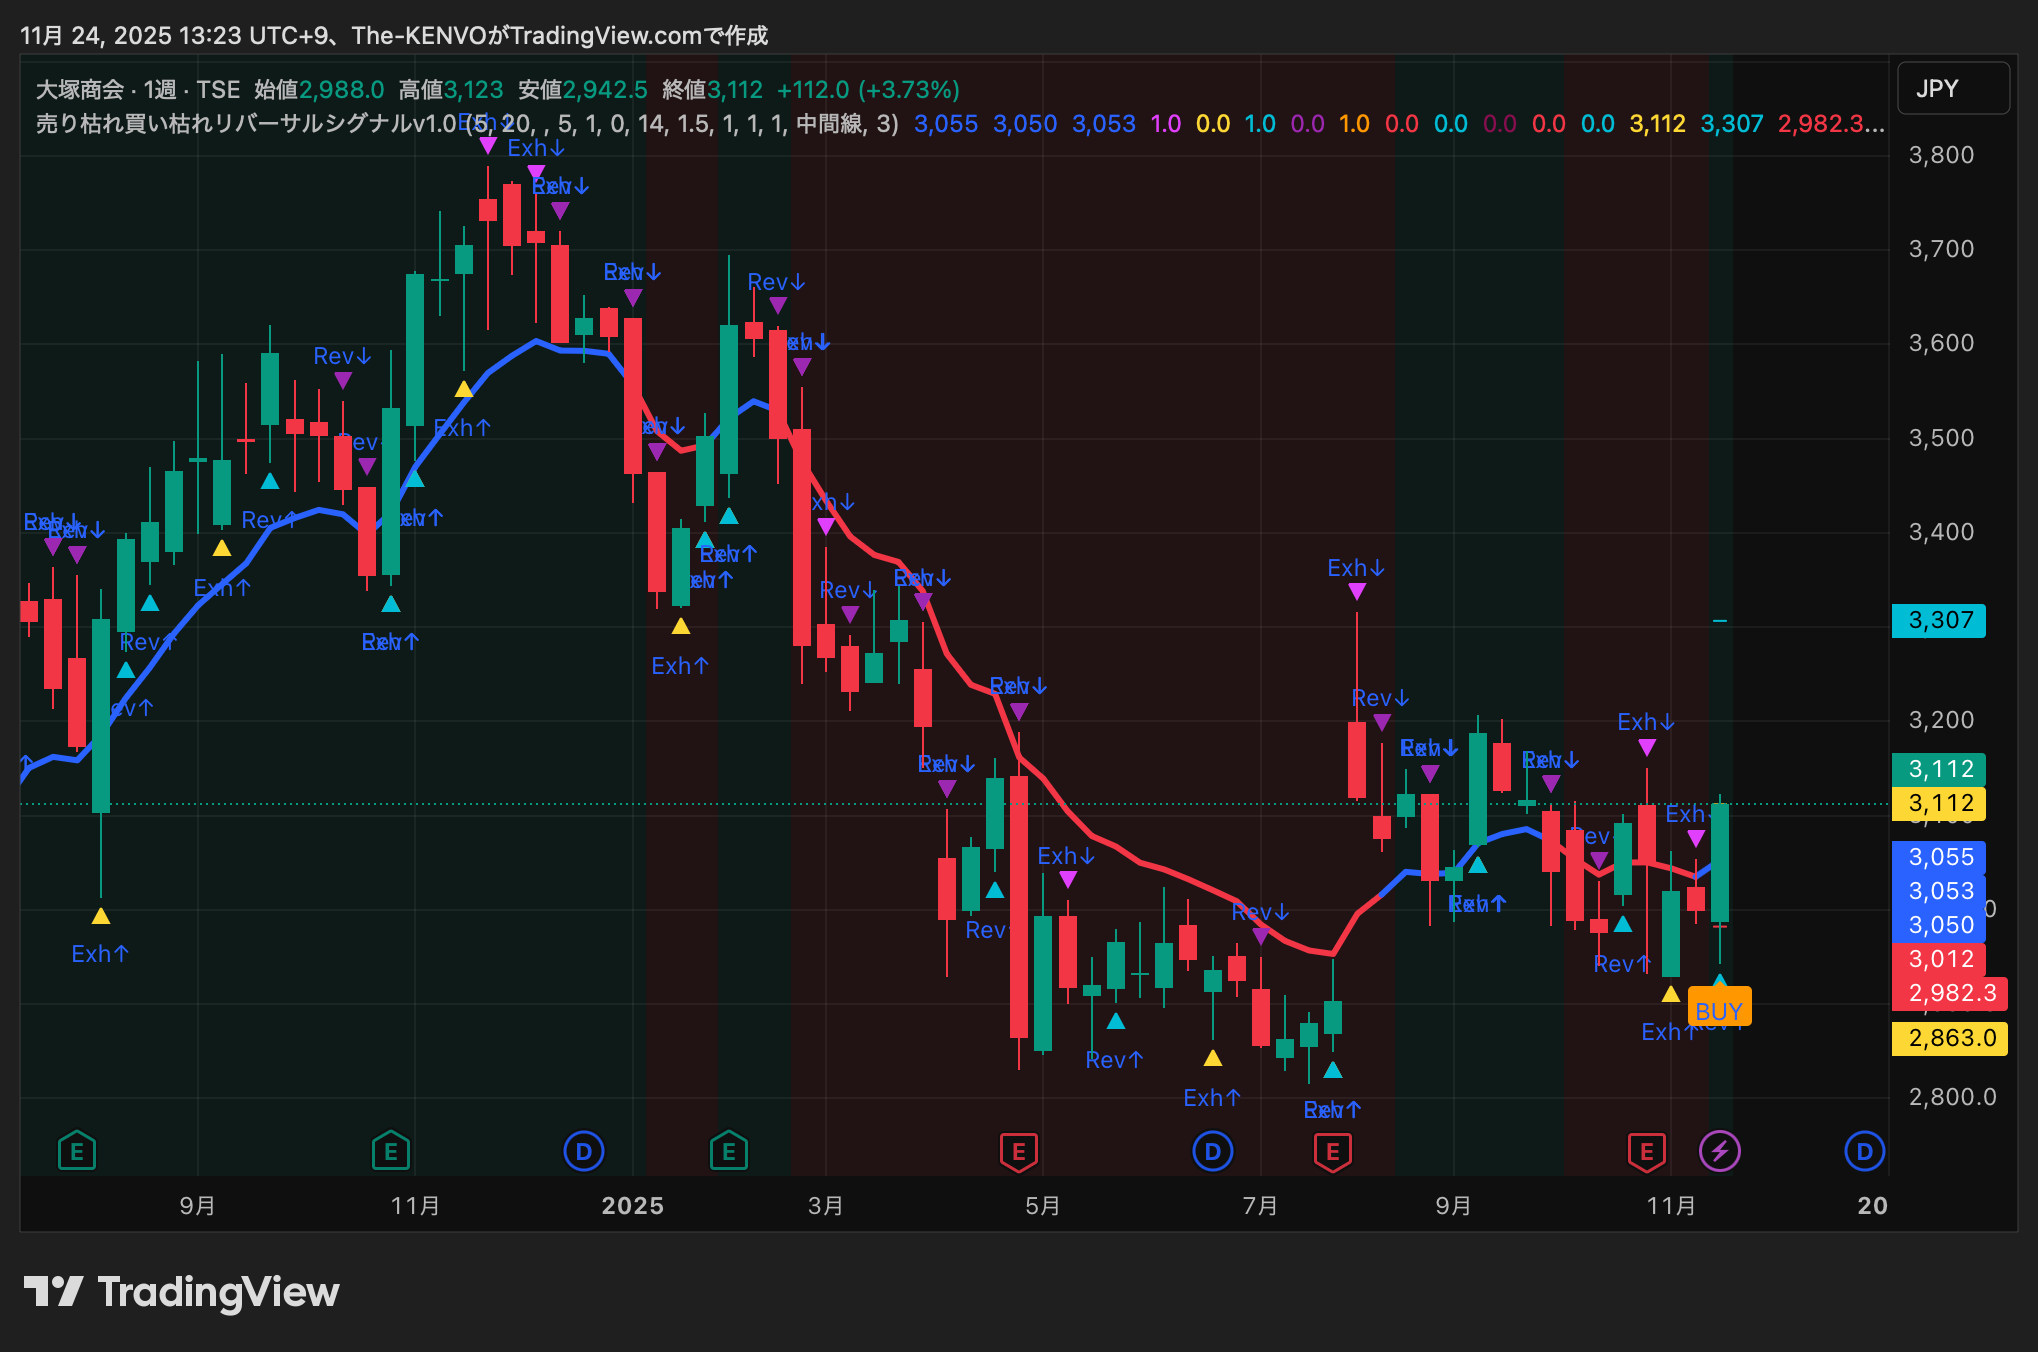
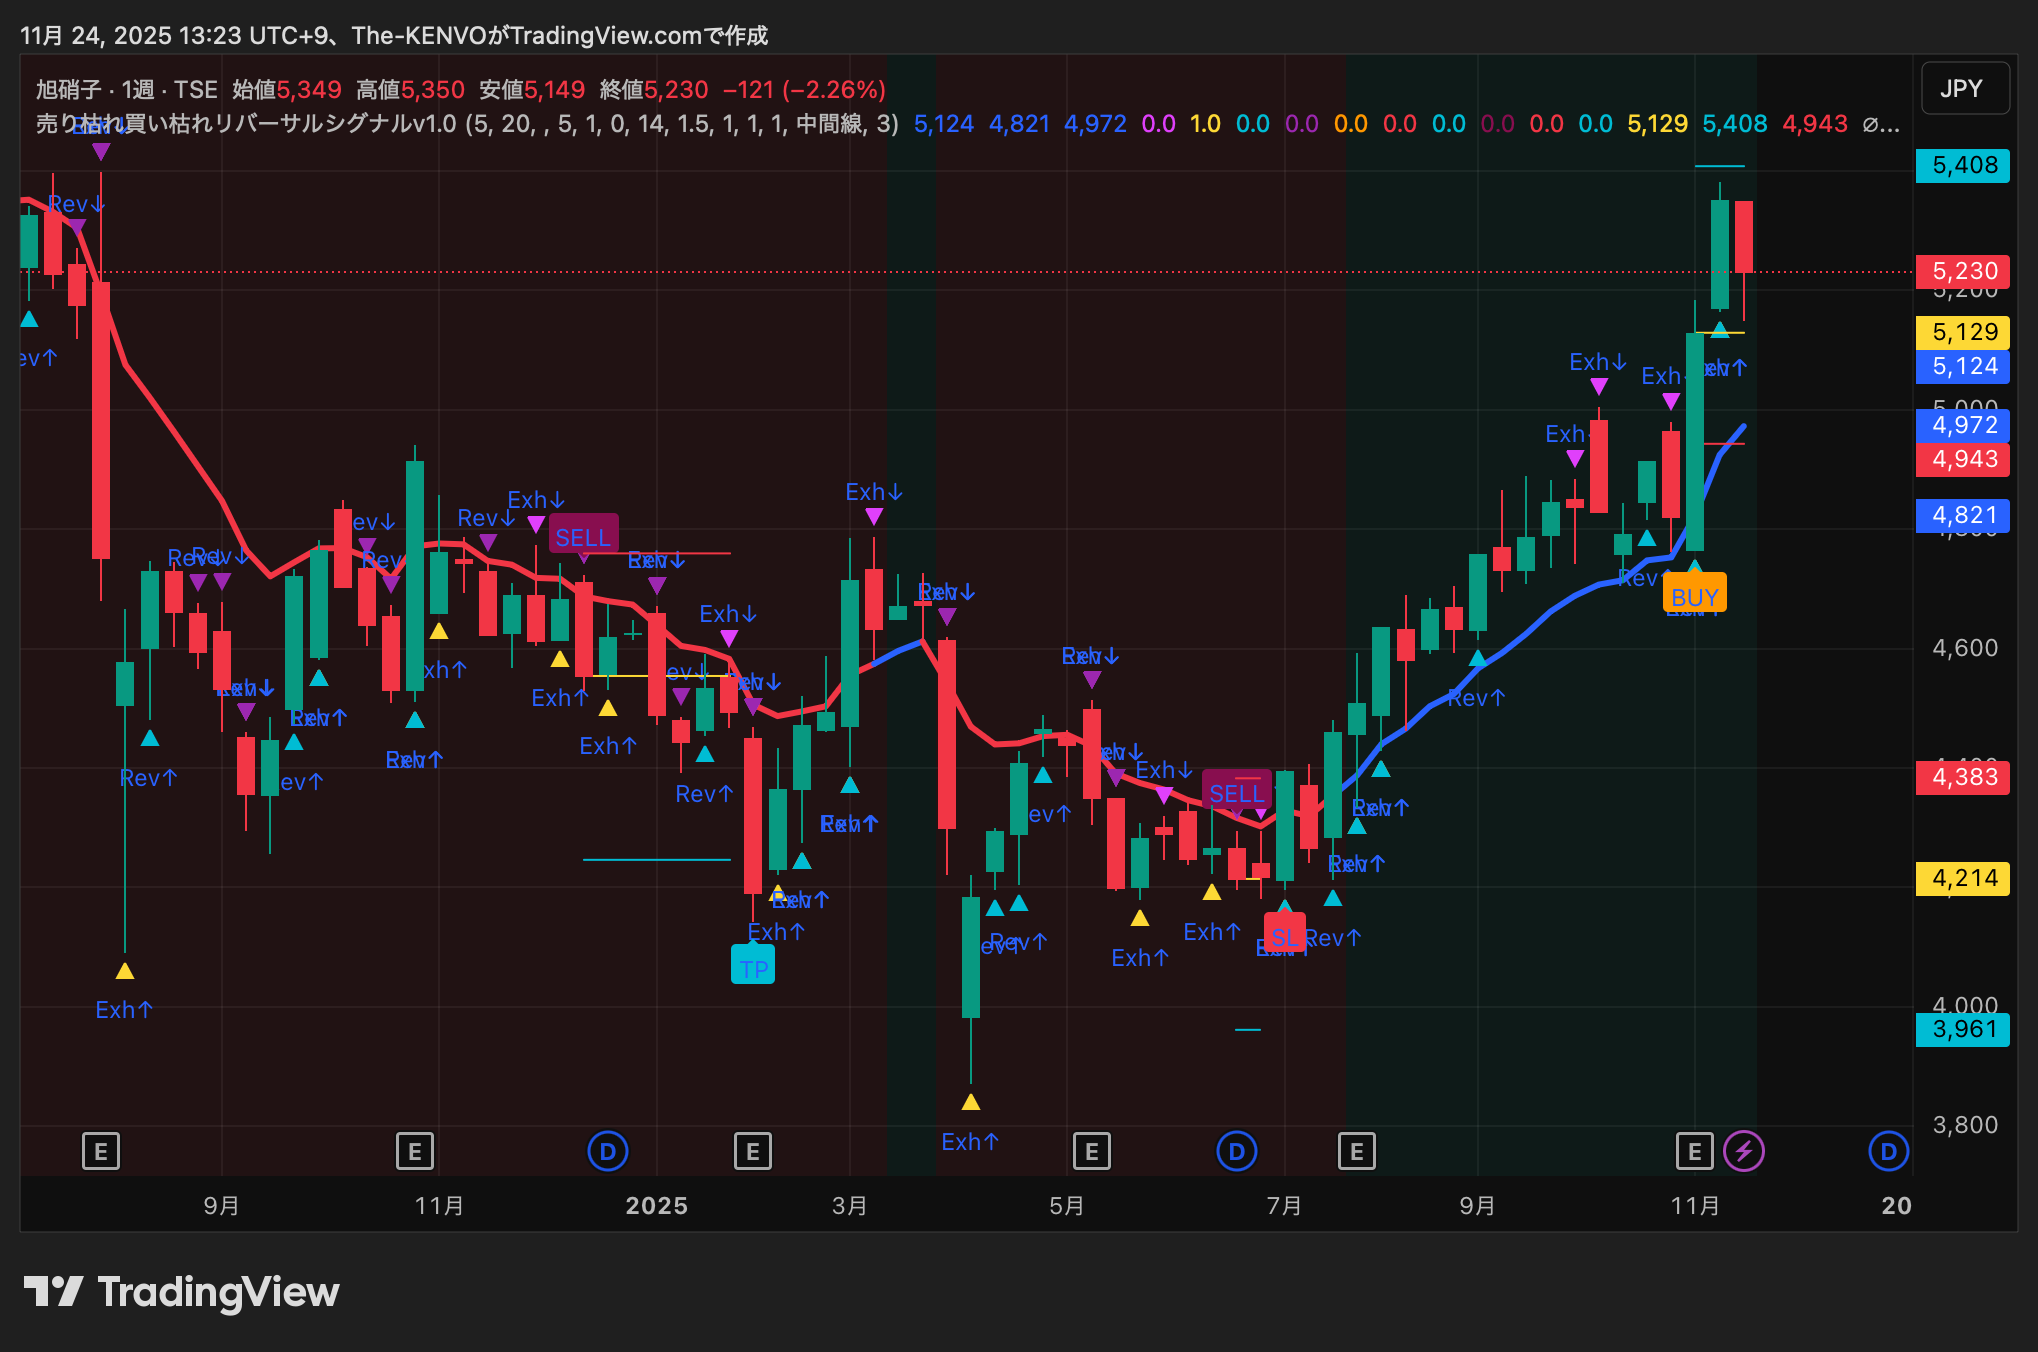
4 Otsuka Shōkai 4768 Candle under/over reversal → BUY 5 AGC (formerly Asahi Glass) 5201 Reversal BUY 6 Komatsu 6301 Late-cycle but strong pullback BUY 7 Daikin Industries 6367 Ideal reversal BUY 8 Sony Group 6758 Pullback BUY in an uptrend 9 Kyocera 6971 BUY on EMA bounce 10 Japan Post Bank 7182 Stable pullback reversal BUY 11 Nissan Motor 7201 Rebound off box lower boundary BUY 12 SCREEN Holdings 7735 Semi reversal BUY 13 Daiwa Securities Group 8601 After adjustment rebound BUY 14 Mitsubishi Estate 8802 Strong real estate uptrend BUY 15 JR East 9020 Uptrend following pullback BUY 16 Chubu Electric Power 9502 Power stock occasionally shows strong BUY
| No | Stock | Code | Comment |
|---|---|---|---|
| 1 | Kikkoman | 2801 | Down move completed → reversal BUY |
| 2 | Asahi Kasei | 3407 | Bottom formation then reversal BUY |
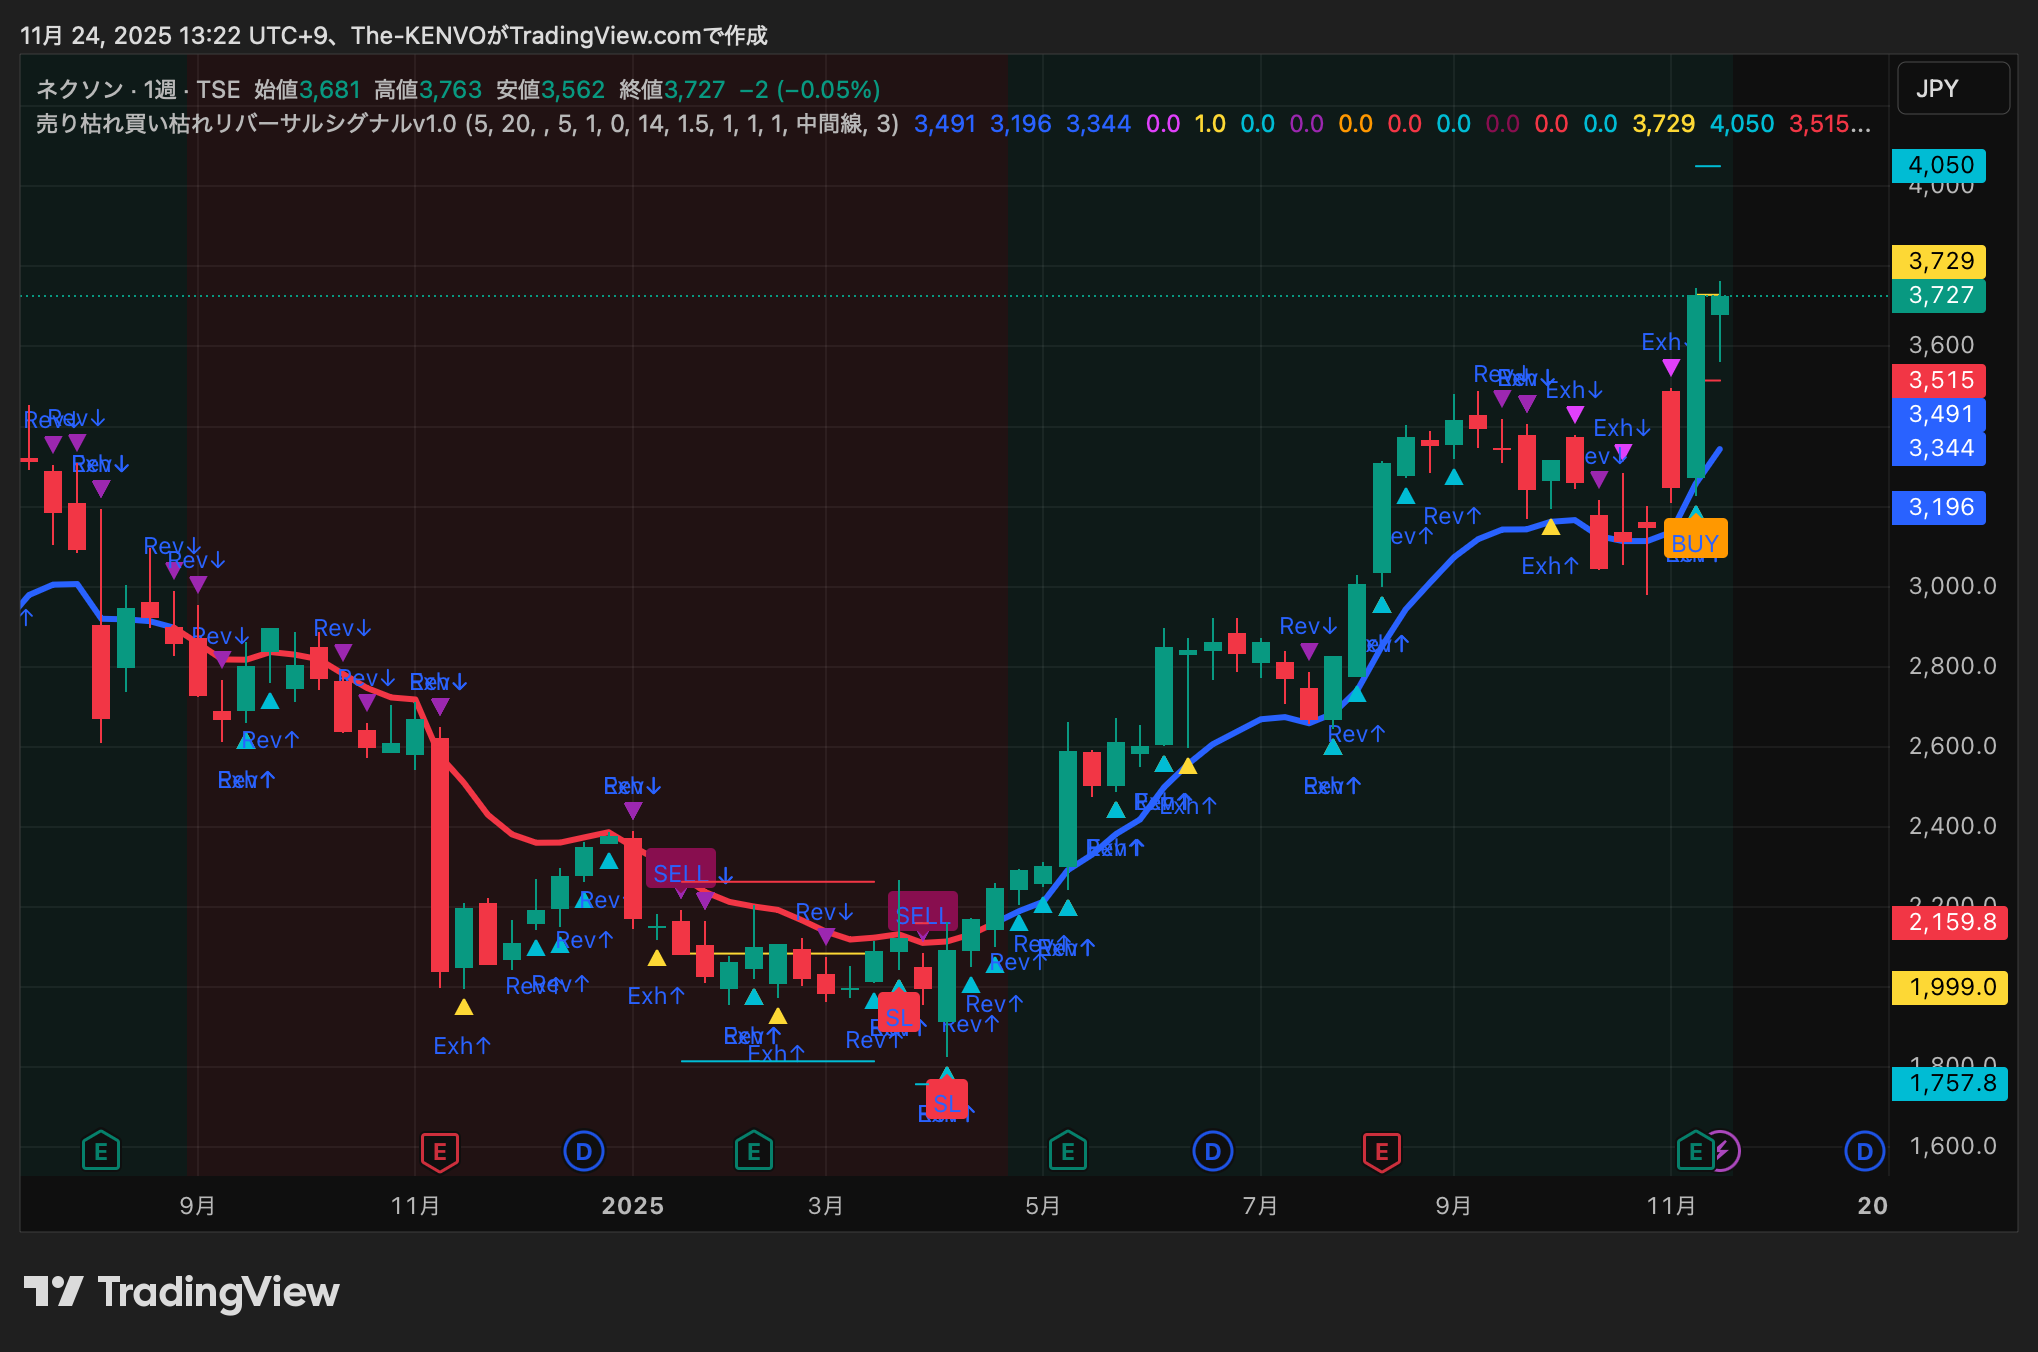
| 3 | Nexon | 3659 | Re-acceleration BUY from pullback |
| 4 | Otsuka Shōkai | 4768 | Candle under/over reversal → BUY |
| 5 | AGC (formerly Asahi Glass) | 5201 | Reversal BUY |
| 6 | Komatsu | 6301 | Late-cycle but strong pullback BUY |
| 7 | Daikin Industries | 6367 | Ideal reversal BUY |
| 8 | Sony Group | 6758 | Pullback BUY in an uptrend |
| 9 | Kyocera | 6971 | BUY on EMA bounce |
| 10 | Japan Post Bank | 7182 | Stable pullback reversal BUY |
| 11 | Nissan Motor | 7201 | Rebound off box lower boundary BUY |
| 12 | SCREEN Holdings | 7735 | Semi reversal BUY |
| 13 | Daiwa Securities Group | 8601 | After adjustment rebound BUY |
| 14 | Mitsubishi Estate | 8802 | Strong real estate uptrend BUY |
| 15 | JR East | 9020 | Uptrend following pullback BUY |
| 16 | Chubu Electric Power | 9502 | Power stock occasionally shows strong BUY |
?SELL Signals (2 stocks)
No Stock Code Comment 1 Daito Trust Construction 1878 Buy Exhaustion → Reversal → SELL 2 Capcom 9697 Buy Exhaustion at high level → SELL
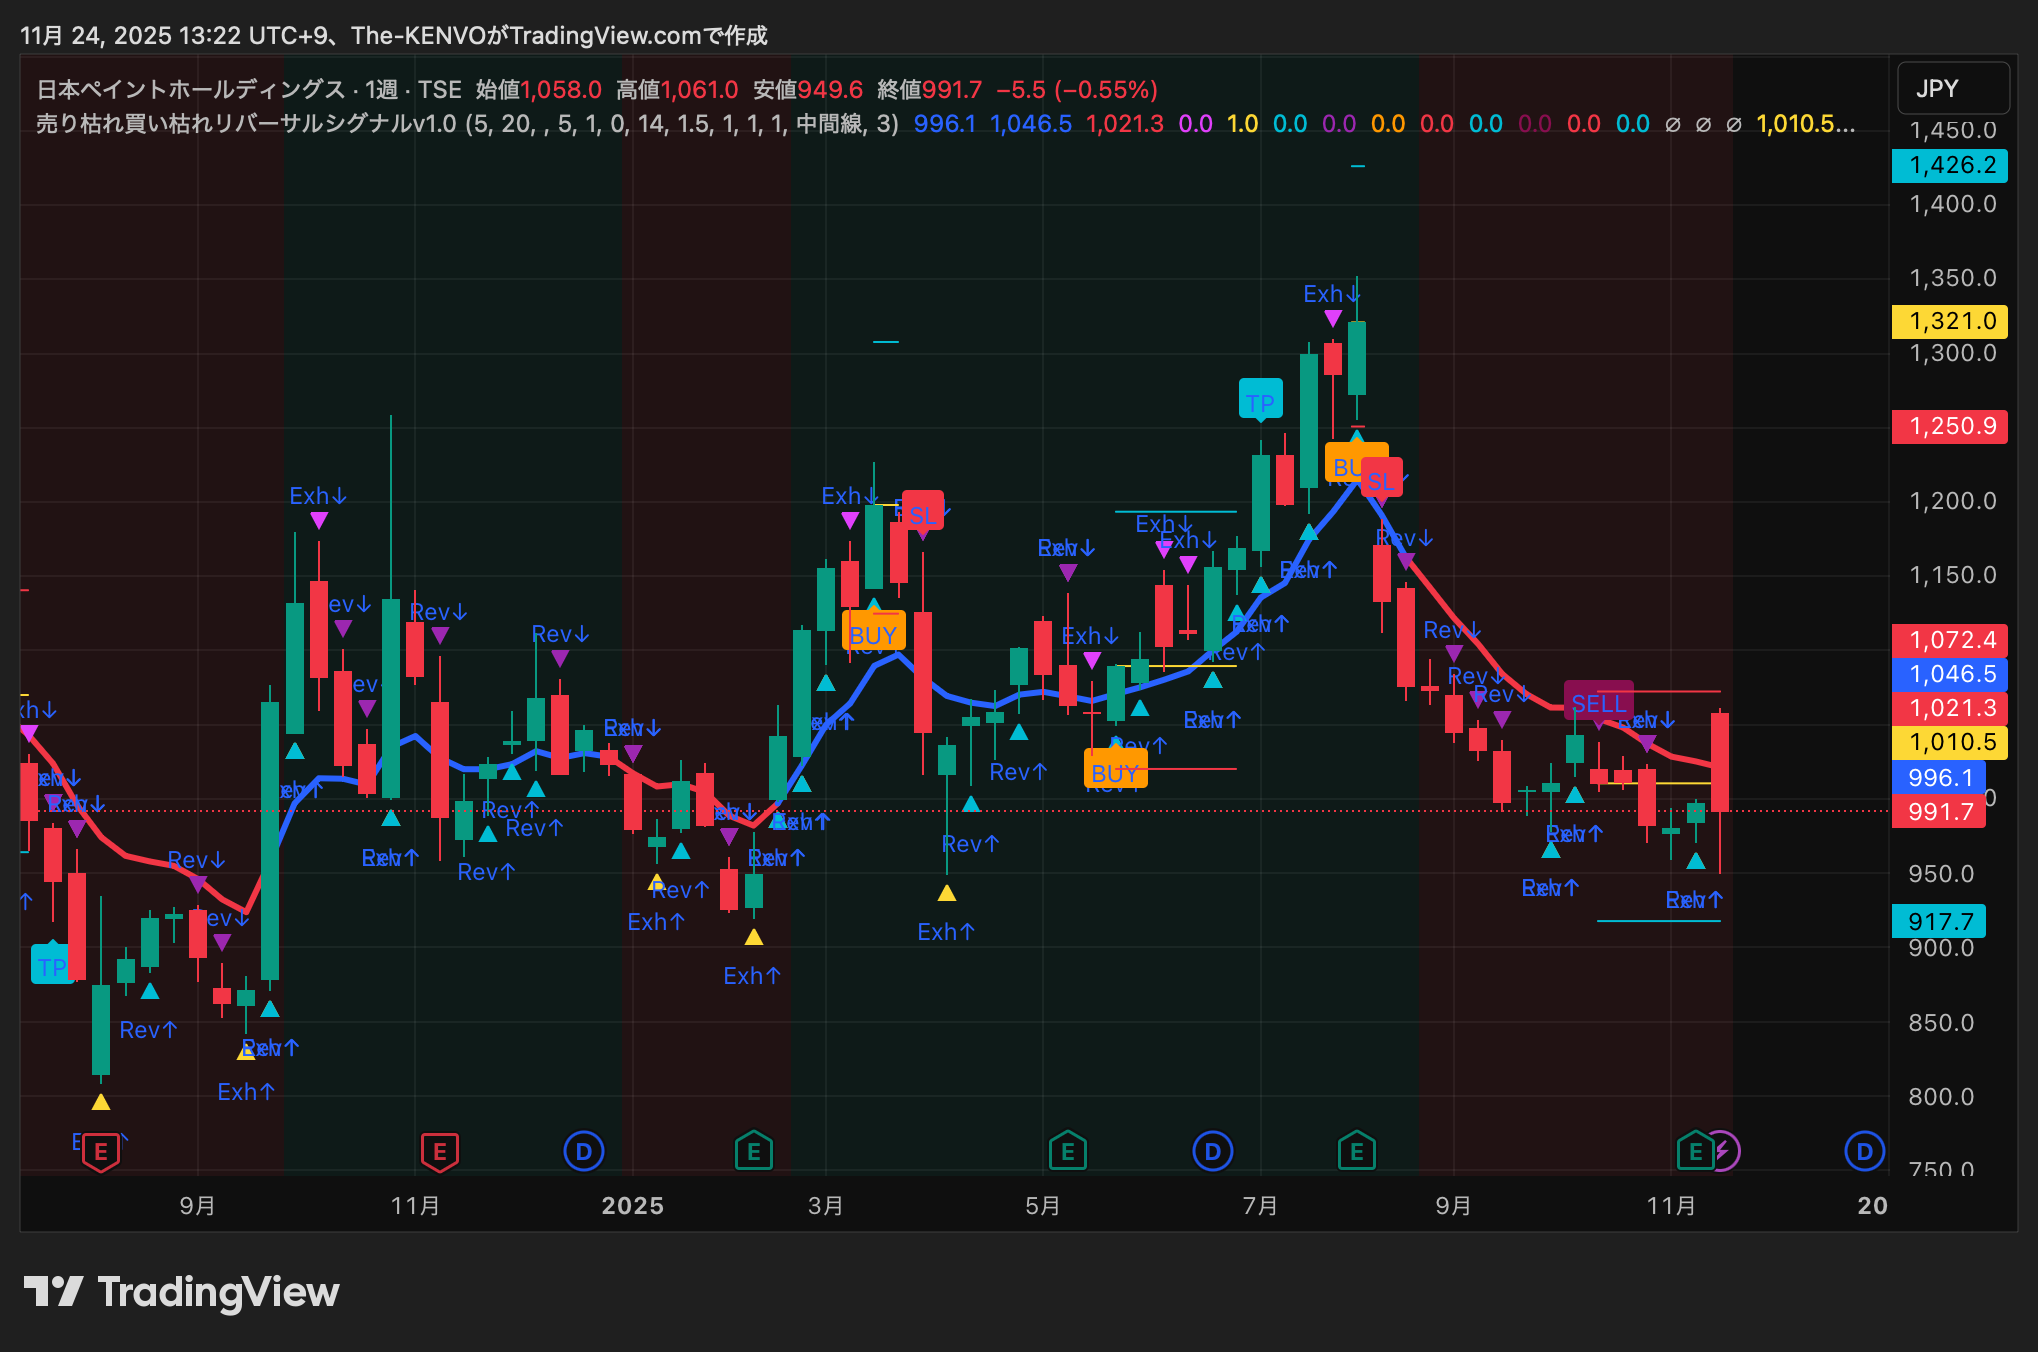
3Nippon Paint Holdings4612
SELL
| No | Stock | Code | Comment |
|---|---|---|---|
| 1 | Daito Trust Construction | 1878 | Buy Exhaustion → Reversal → SELL |
| 2 | Capcom | 9697 | Buy Exhaustion at high level → SELL |
| 3Nippon Paint Holdings4612 |
?Indicator Logic
? Sell Exhaustion (Exh↑)
A position where downside energy has exhausted.
→ Foundation for a reversal.
? Buy Exhaustion (Exh↓)
A position where upward momentum has exhausted.
→ Foundation for a downside reversal.
? Reversal Signal (Rev↑/Rev↓)
Engulfing patterns, pin bars, real body reversals.
→ A decisive turn in direction.
? Trend Filter (EMA5/EMA20)
EMA5↑ = short-term uptrend
EMA20↑ = mid-term uptrend
EMA5 > EMA20 → Buy favorability
?Overall 19 Stock Summary
? Frequent BUY → Market condition improving
? Reversal on weekly charts tends to have higher mid-term reliability
? Broad sector buybacks progressing
------------------------------------
Next, proceed to stock-by-stock "Detailed Analysis + Future Price Movement Projections"
------------------------------------
■ 19 Stocks List (BUY 16 stocks / SELL 3 stocks)
BUY (16 stocks)
2801 Kikkoman
3407 Asahi Kasei
3659 Nexon
4768 Otsuka Shōkai
5201 AGC
6301 Komatsu
6367 Daikin Industries
6758 Sony Group
6971 Kyocera
7182 Japan Post Bank
7201 Nissan Motor
7735 SCREEN Holdings
8601 Daiwa Securities Group
8802 Mitsubishi Estate
9020 JR East
9502 Chubu Electric Power
SELL (3 stocks)
1878 Daiwa Toyo Construction
9697 Capcom
4612 Nippon Paint Holdings
■ Individual Stock Detailed Analyses (19 Stocks)
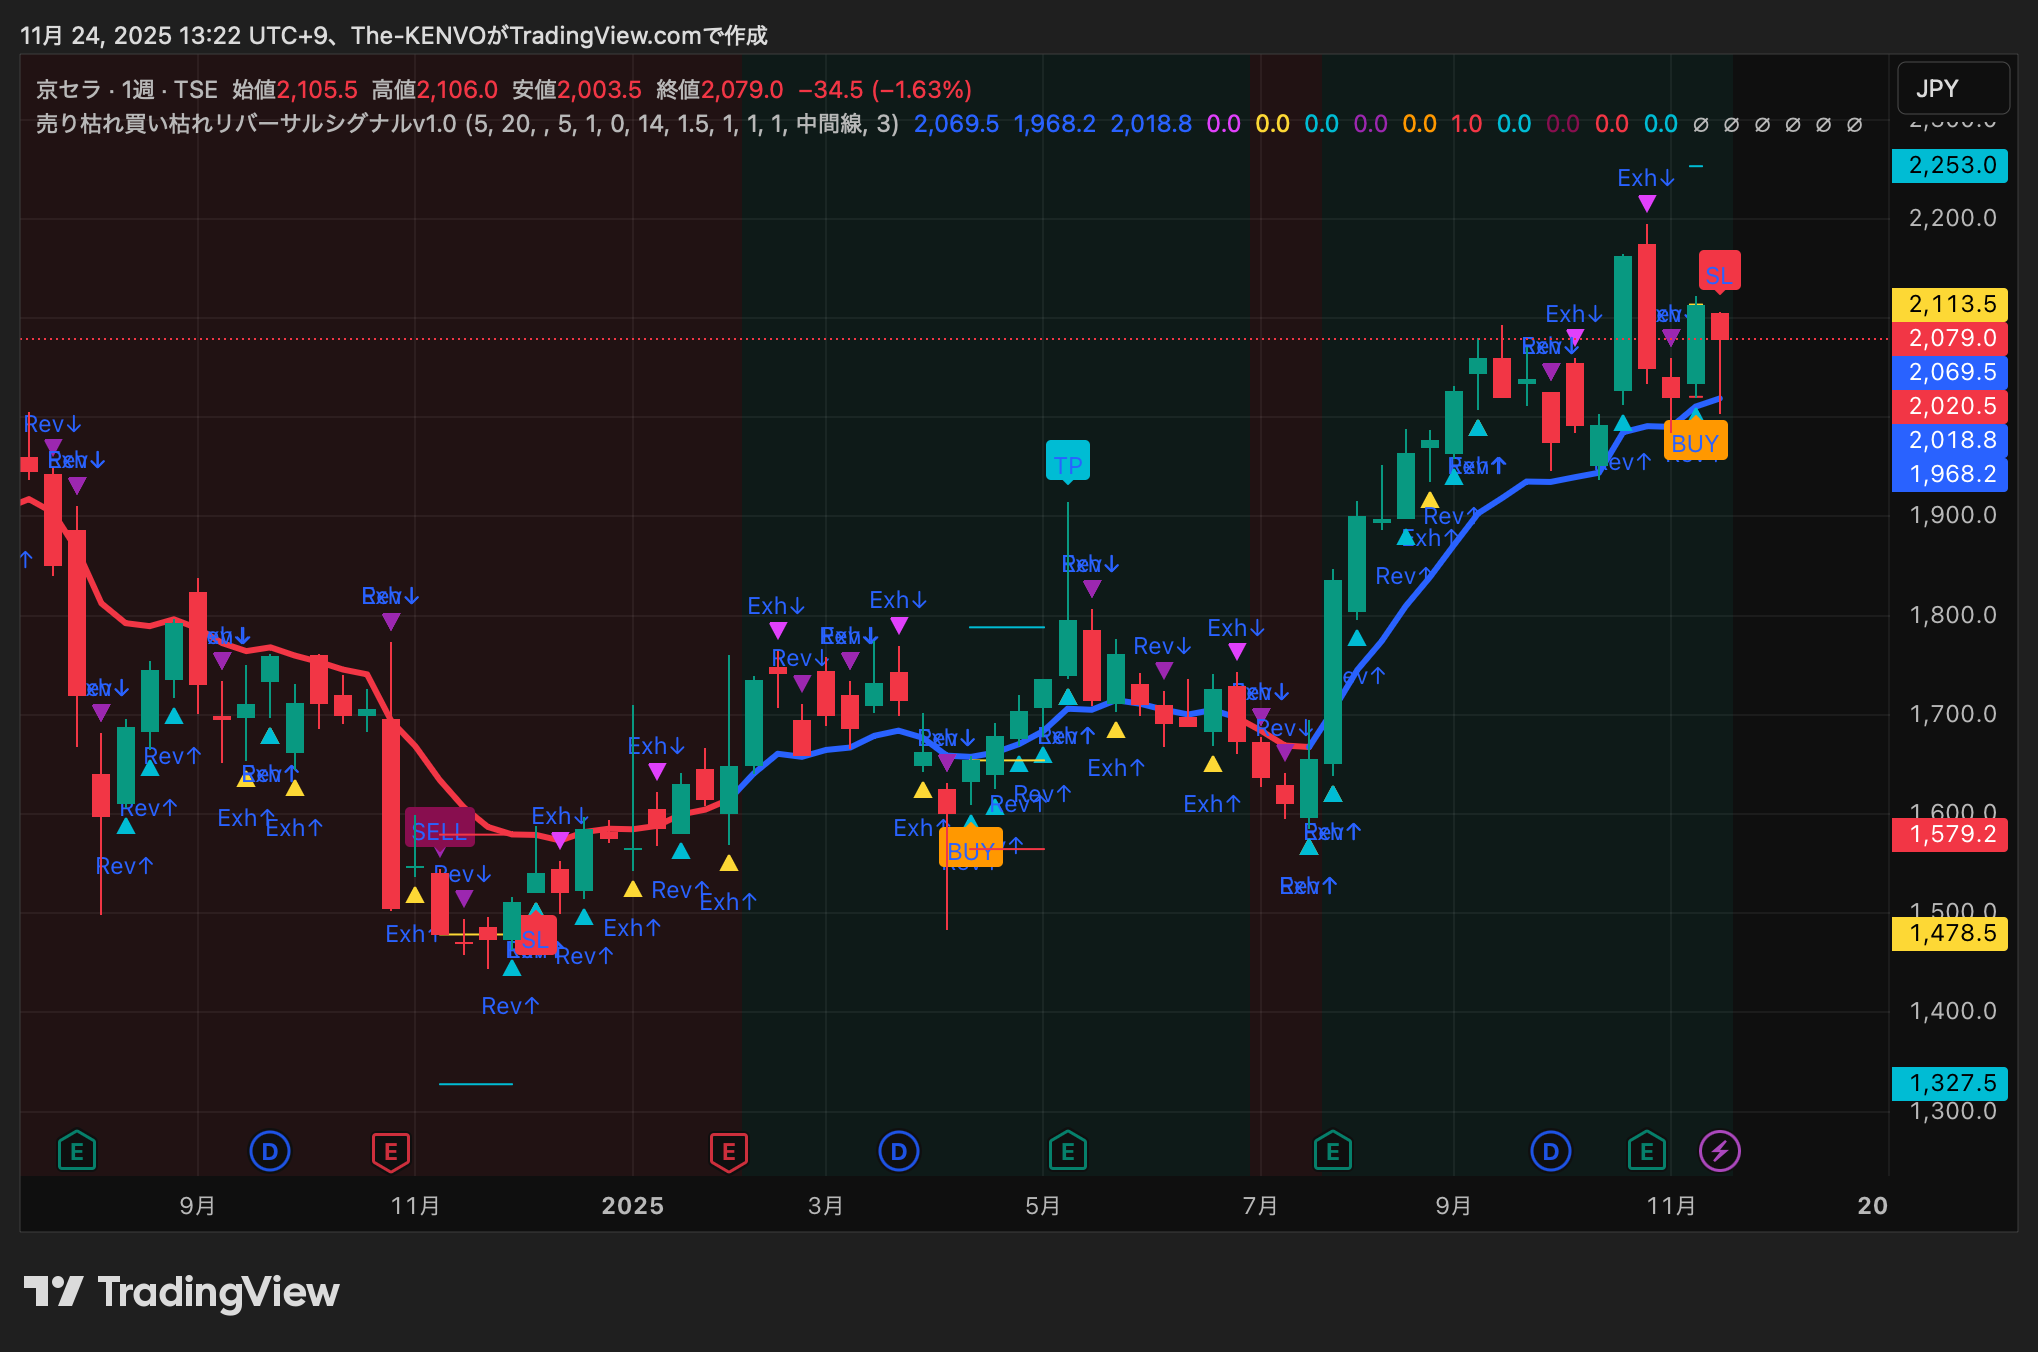
① Kyocera (6971) — BUY
The recent rise occurred in July–August, followed by a consolidation in September–October; on weekly charts, the price has been making higher lows, maintaining a clearly upward trend. During the consolidation, multiple occurrences of Sell Exhaustion (Exh↑) appeared, indicating easing selling pressure. At the same time, candlesticks often show long lower wicks, signaling strong buying support. The decisive trigger for the reversal was the consecutive Rev↑ and BUY appearances, with a bullish candle wrapping above EMA20. The stock is currently in a stage of rising again after a pullback, and the trend regression is clearly up.
Outlook:
Bullish: target new highs around 2,250; breaking that could reach the 2,350 area. Neutral: 2,020–2,150 range. Bearish: if EMA20 breaks, expect a pullback toward ~1,950.
② Japan Post Bank (7182) — BUY
This stock shows an exceptionally stable upward trend on a weekly basis, with a clear higher low progression through Nov–Dec and aligning with overall market improvement. Several Exh↑ during a pullback indicate weakness in downside, and a subsequent reversal signal (Rev↑) confirms a solid floor. The latest BUY appears with a rebound at EMA20, supporting a continued mid-term uptrend. Candlesticks show shrinking real bodies, signaling waning selling pressure.
Outlook:
Bullish: aim for a new high above 1,850; Neutral: 1,720–1,800; Bearish: break below 1,650 could trigger a pullback.
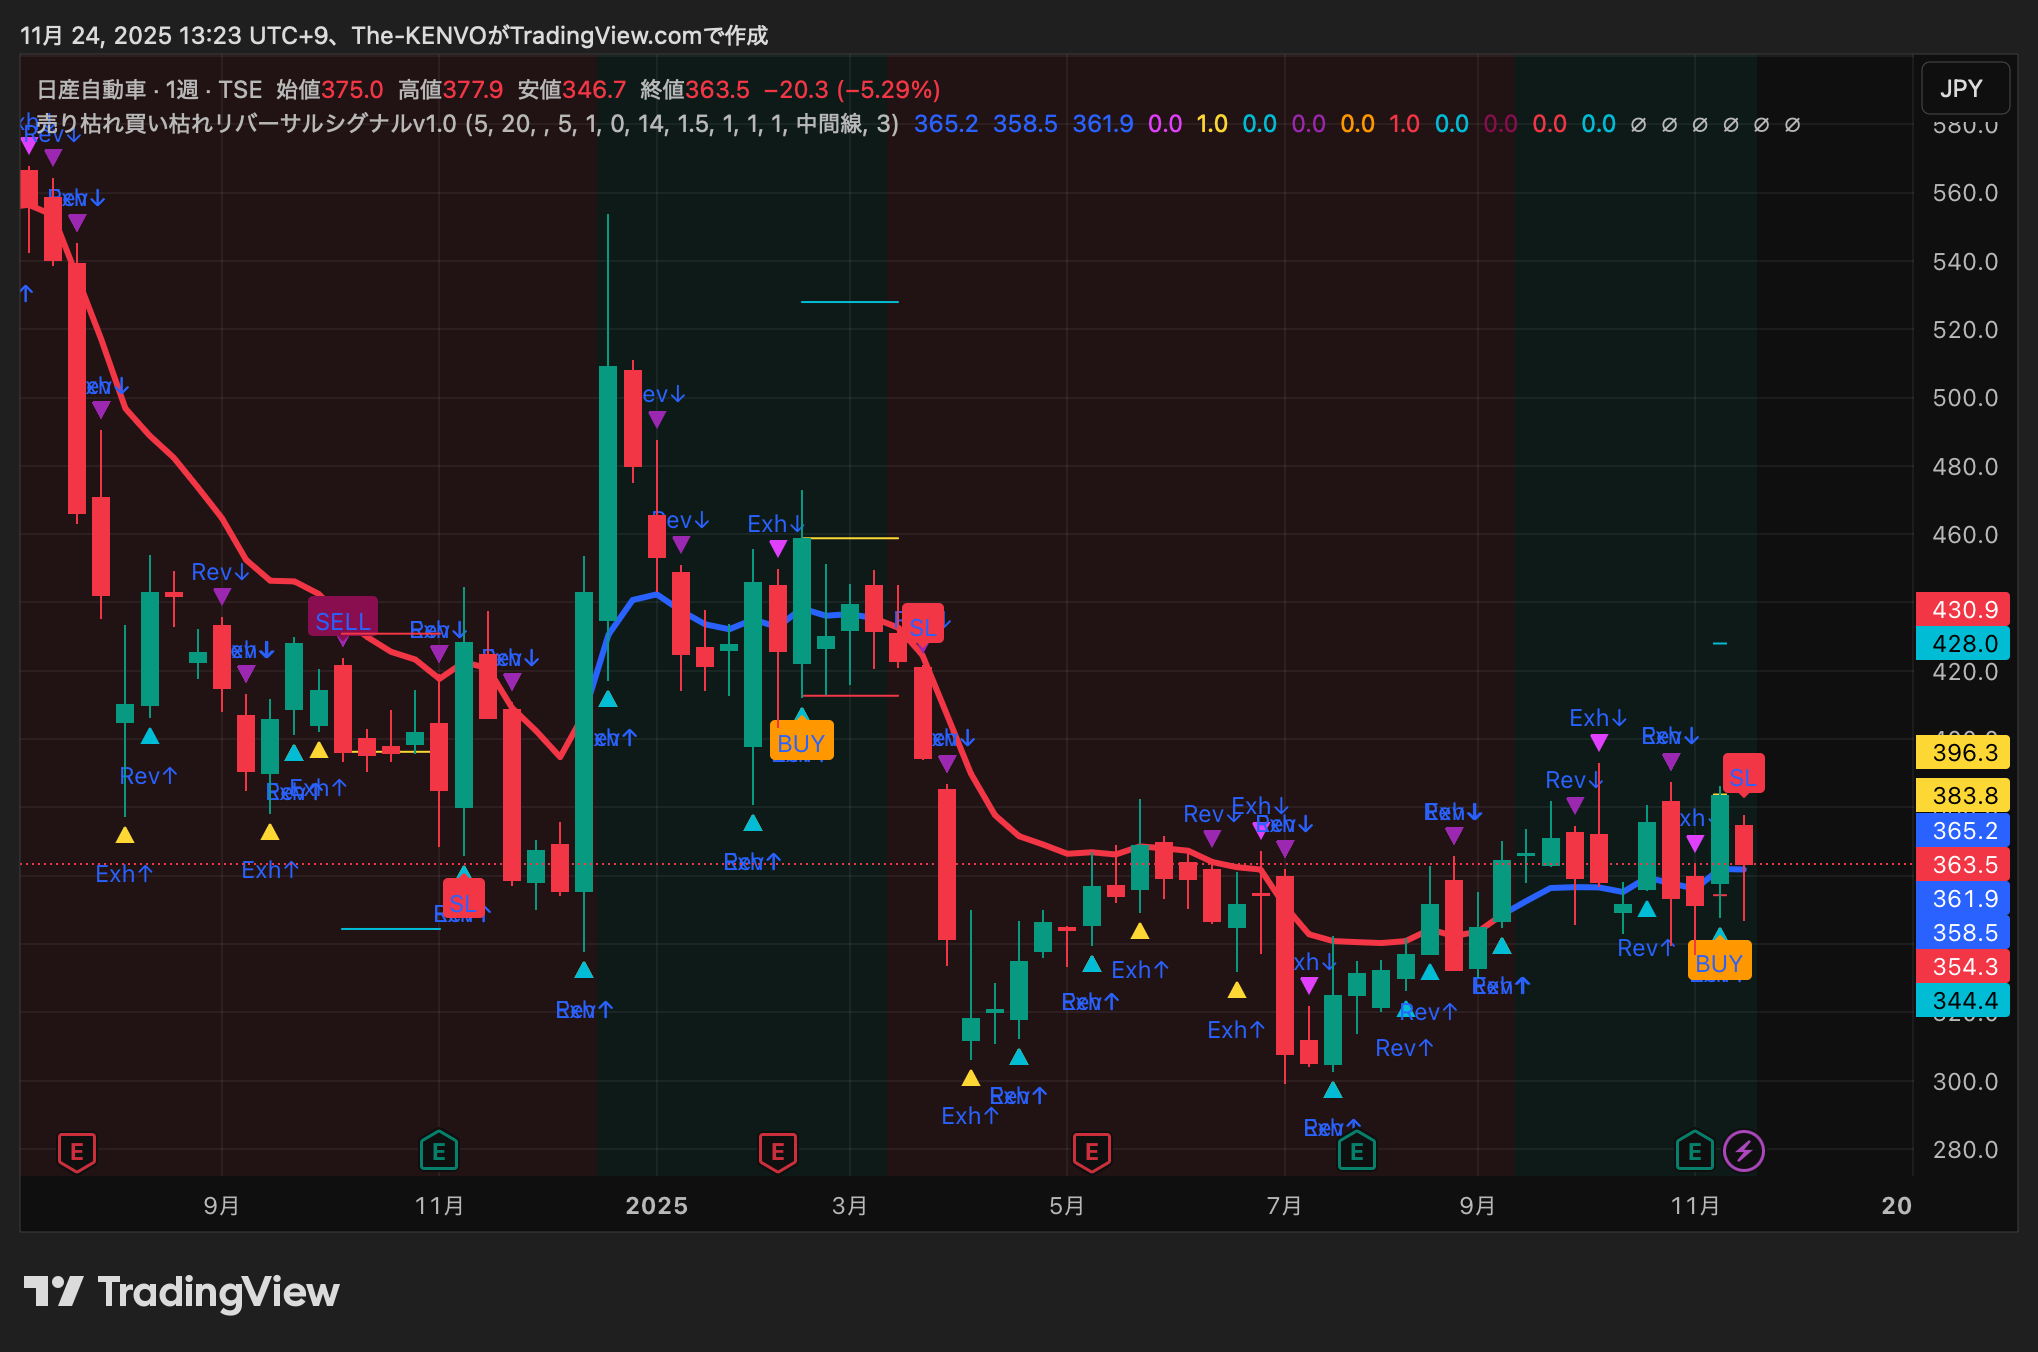
③ Nissan Motor (7201) — BUY
Nissan had a long-standing box pattern with unclear direction, but recently a reversal pattern emerged from the lower edge of the box. Exhaustion signals (Exh↑) appeared around the bottom, signaling selling pressure fatigue. After Rev↑, BUY lighting confirms, and energy to move higher strengthens as downward pressure subsides. The MA gap is small, so reversal confidence is relatively high.
Outlook:
Bullish: break above 1,000; Neutral: 880–950 range; Bearish: fall below 850 renewed downside search.
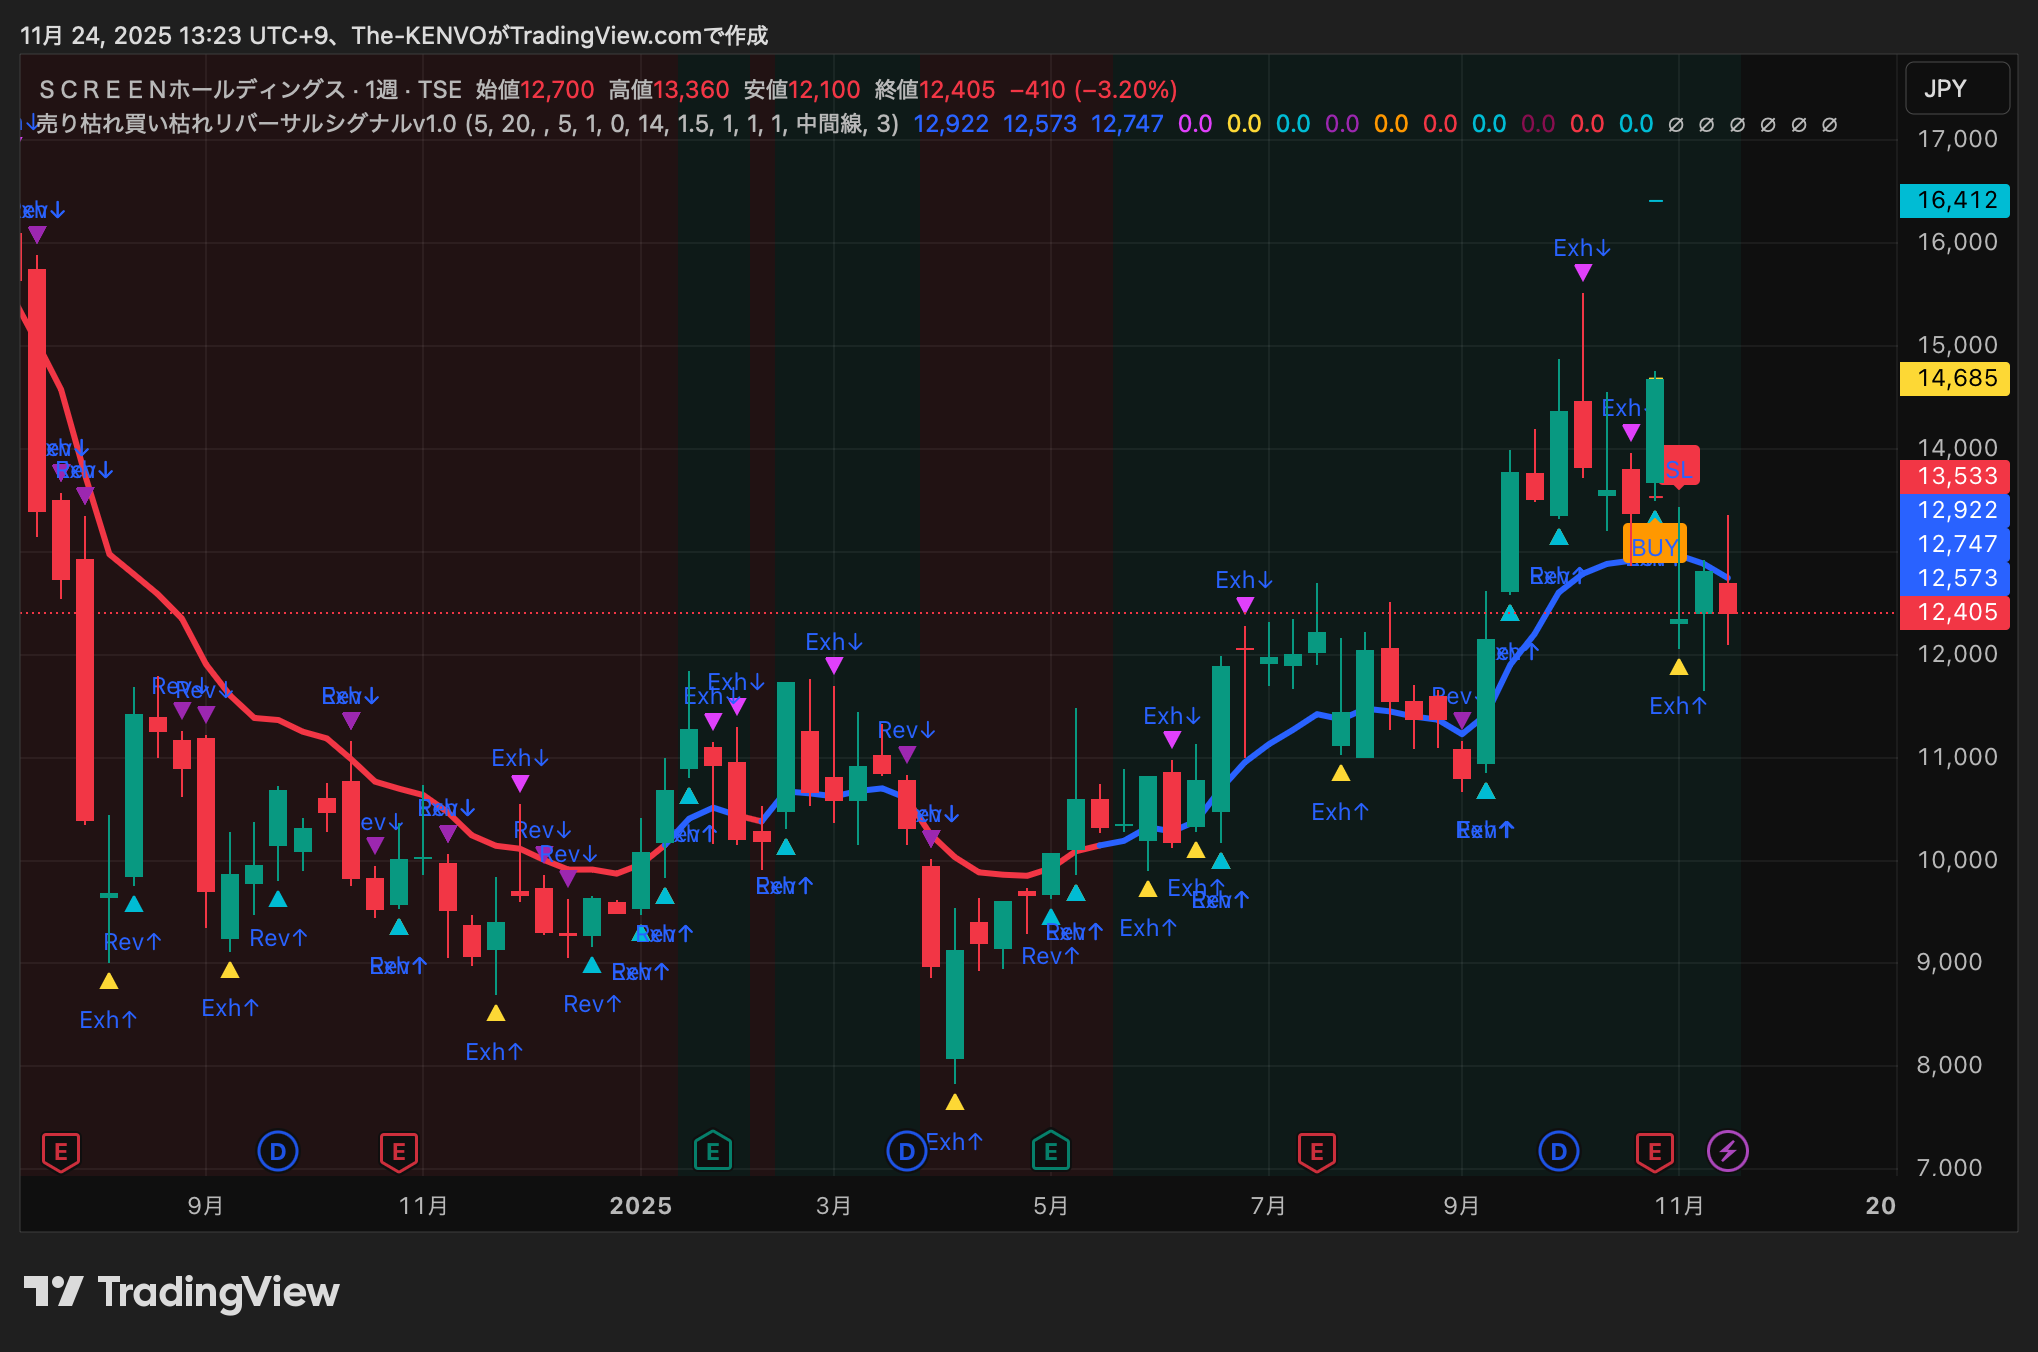
④ SCREEN Holdings (7735) — BUY
Within the broader semiconductor sector's weakness from Aug–Oct, SCREEN formed a mid-term consolidation. However, after November, long lower wicks in Exh↑ reduced selling momentum, and Rev↑ with BUY above EMA20 confirmed a clear reversal. Sector-wide improvement in semiconductors contributed to a strong rebound for this stock.
Outlook:
Bullish: aim to exceed 14,200; Neutral: 12,300–13,200 range; Bearish: drop below 12,000.
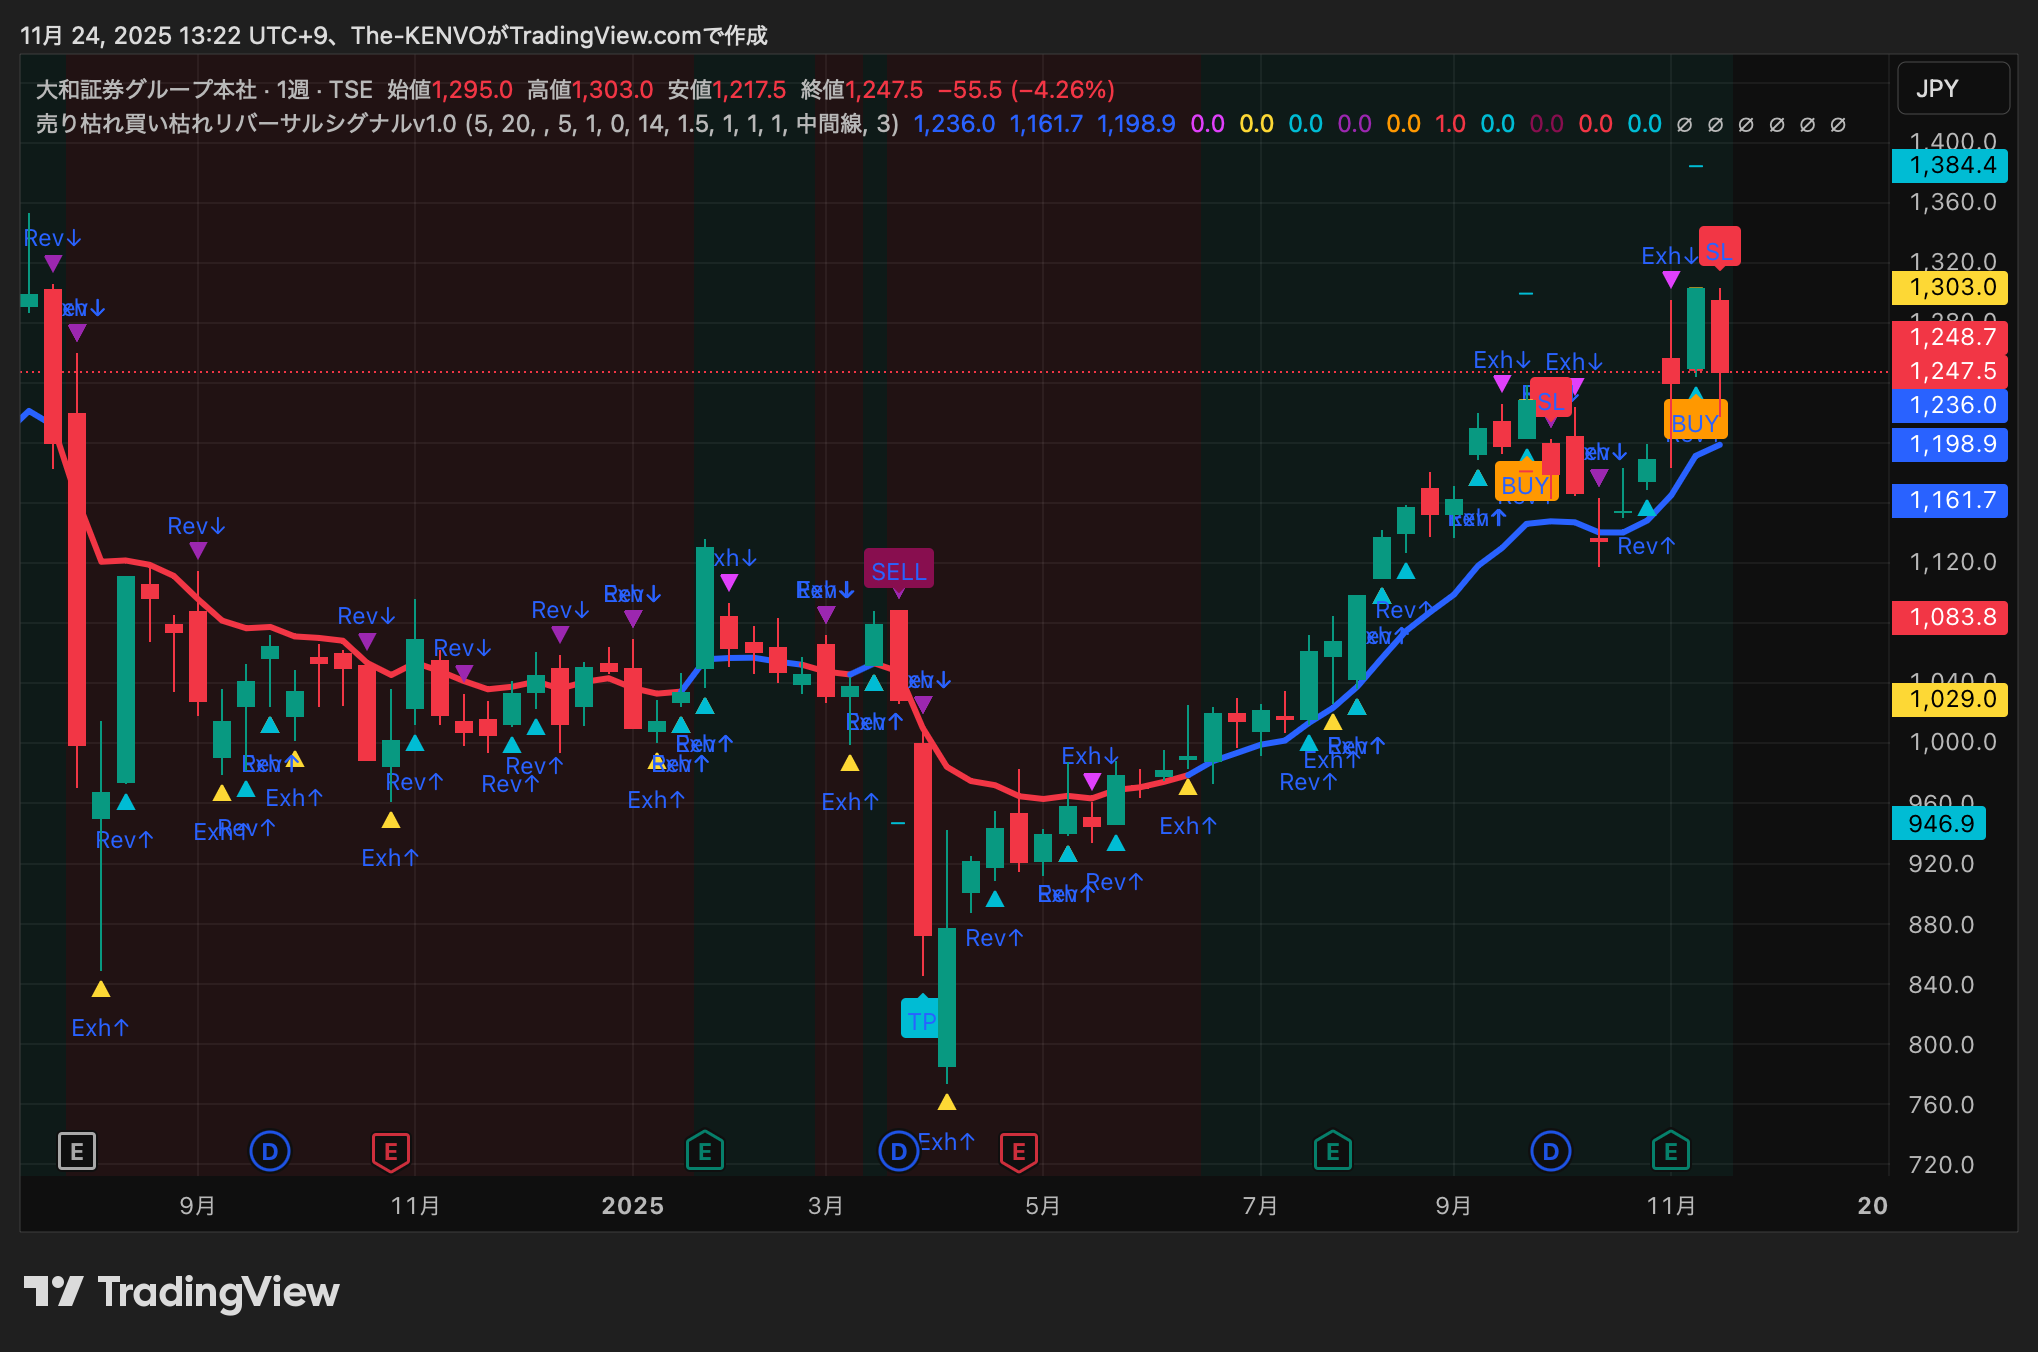
⑤ Daiwa Securities Group (8601) — BUY
Securities stocks are sensitive to market sentiment, but this stock has shown strong rise since summer, with EMA5 and EMA20 both trending up. Consecutive Exh exhaustion during recent pullback showed price floor support. BUY lighting overlapped with EMA5 breakout, signaling strong pullback demand. Long-term uptrend channel is maintained.
Outlook:
Bullish: break through 1,330; Neutral: 1,200–1,260; Bearish: below 1,160.
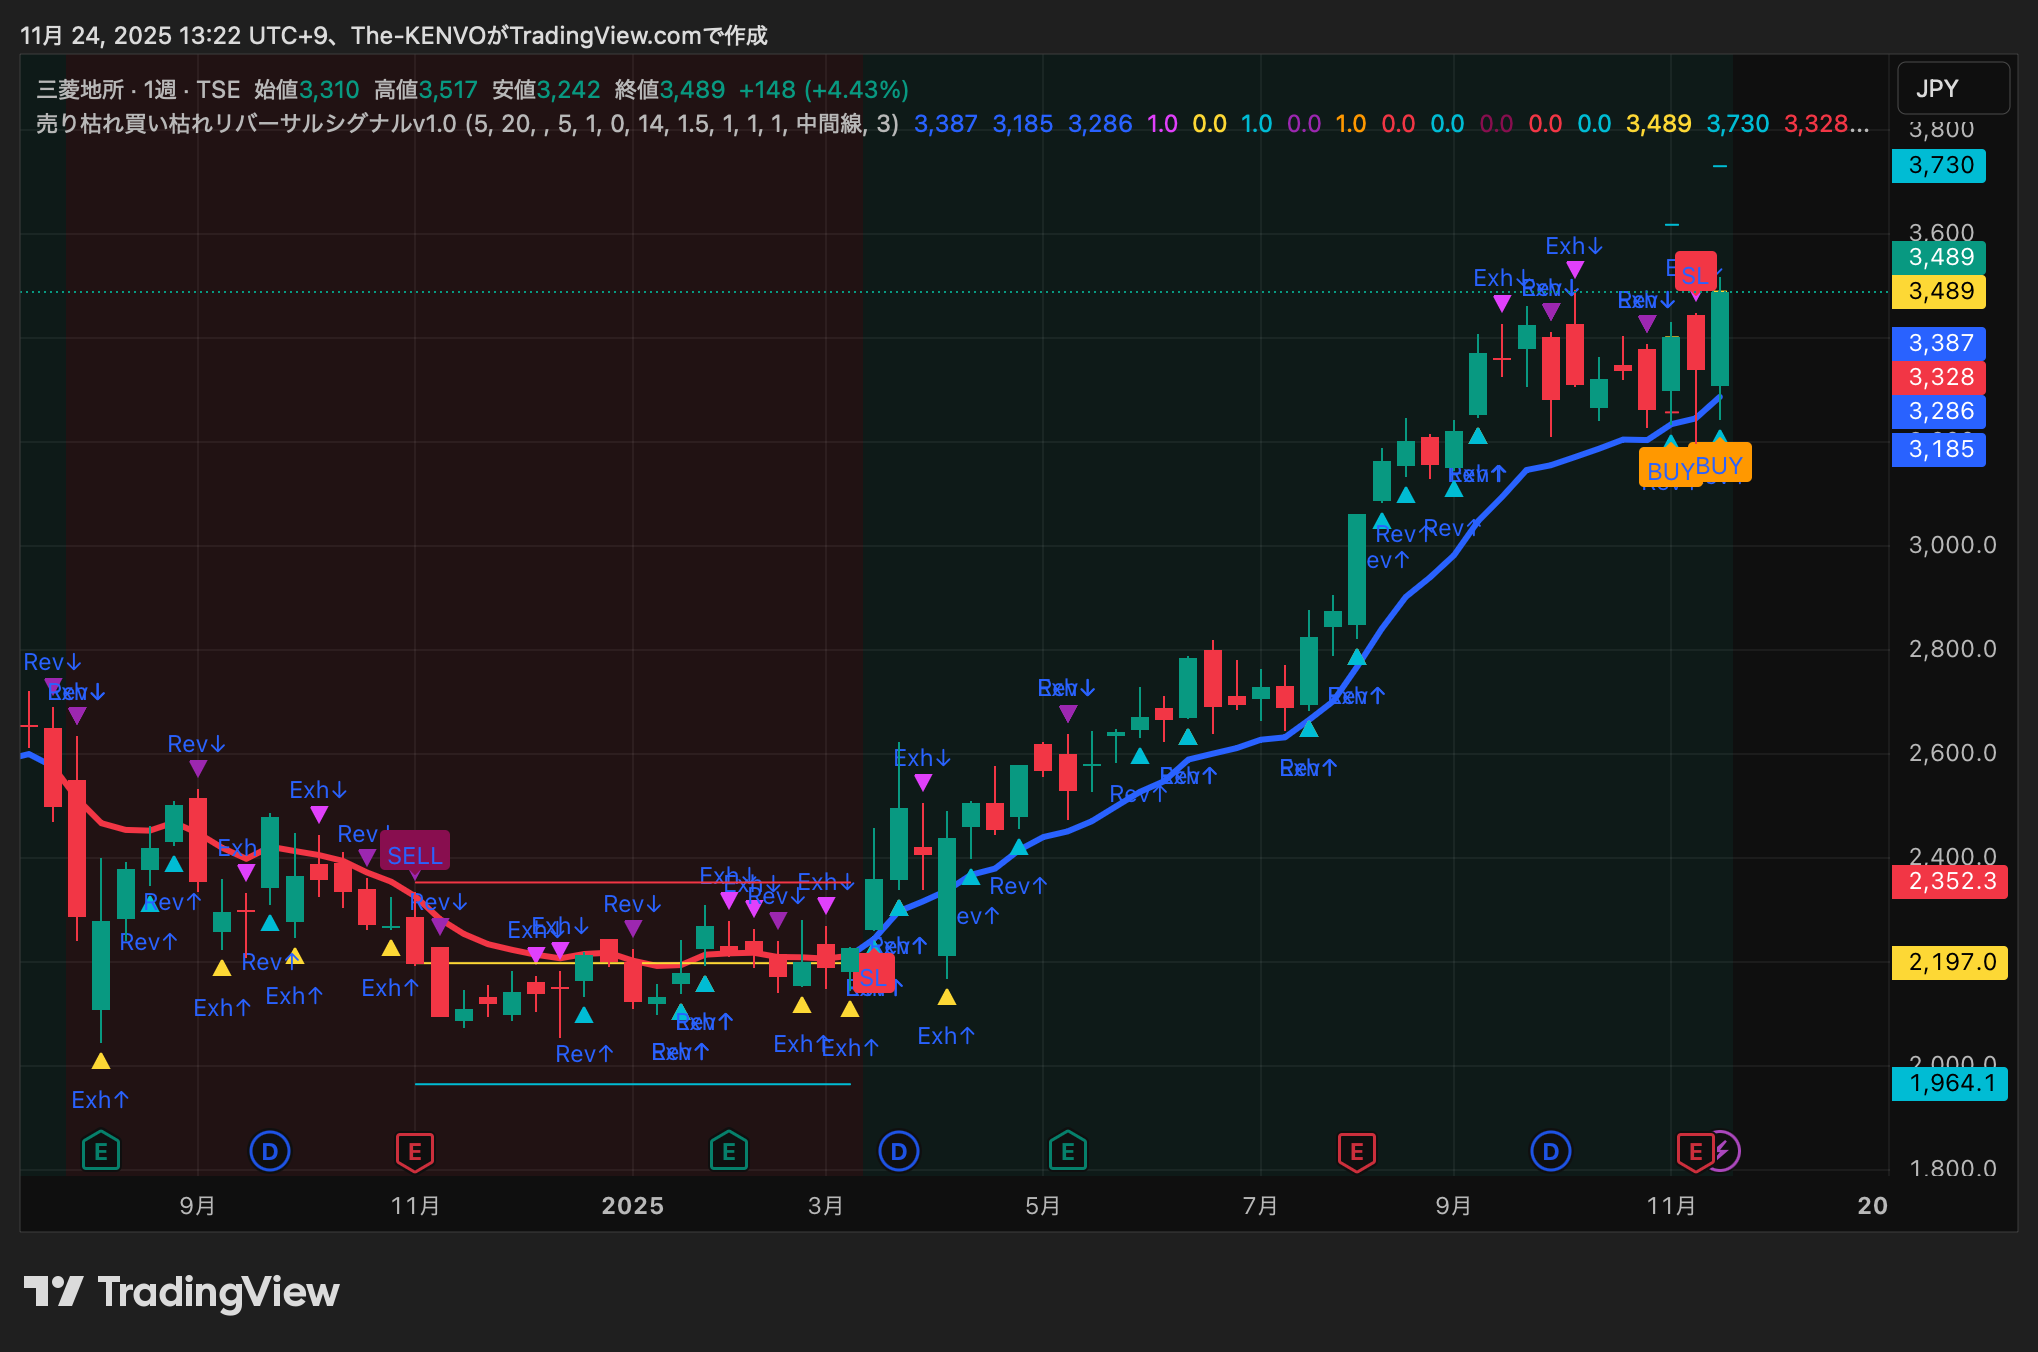
⑥ Mitsubishi Estate (8802) — BUY
One of the strongest real estate uptrends, weekly chart forming a clean trend channel with shallow pullbacks. After exhaustion, buying resumed reliably. BUY lighting occurs at a point confirming rebound from EMA20, indicating high-quality pullback.
Outlook:
Bullish: new highs beyond 3,650; Neutral: 3,300–3,450; Bearish: adjust to below 3,200.
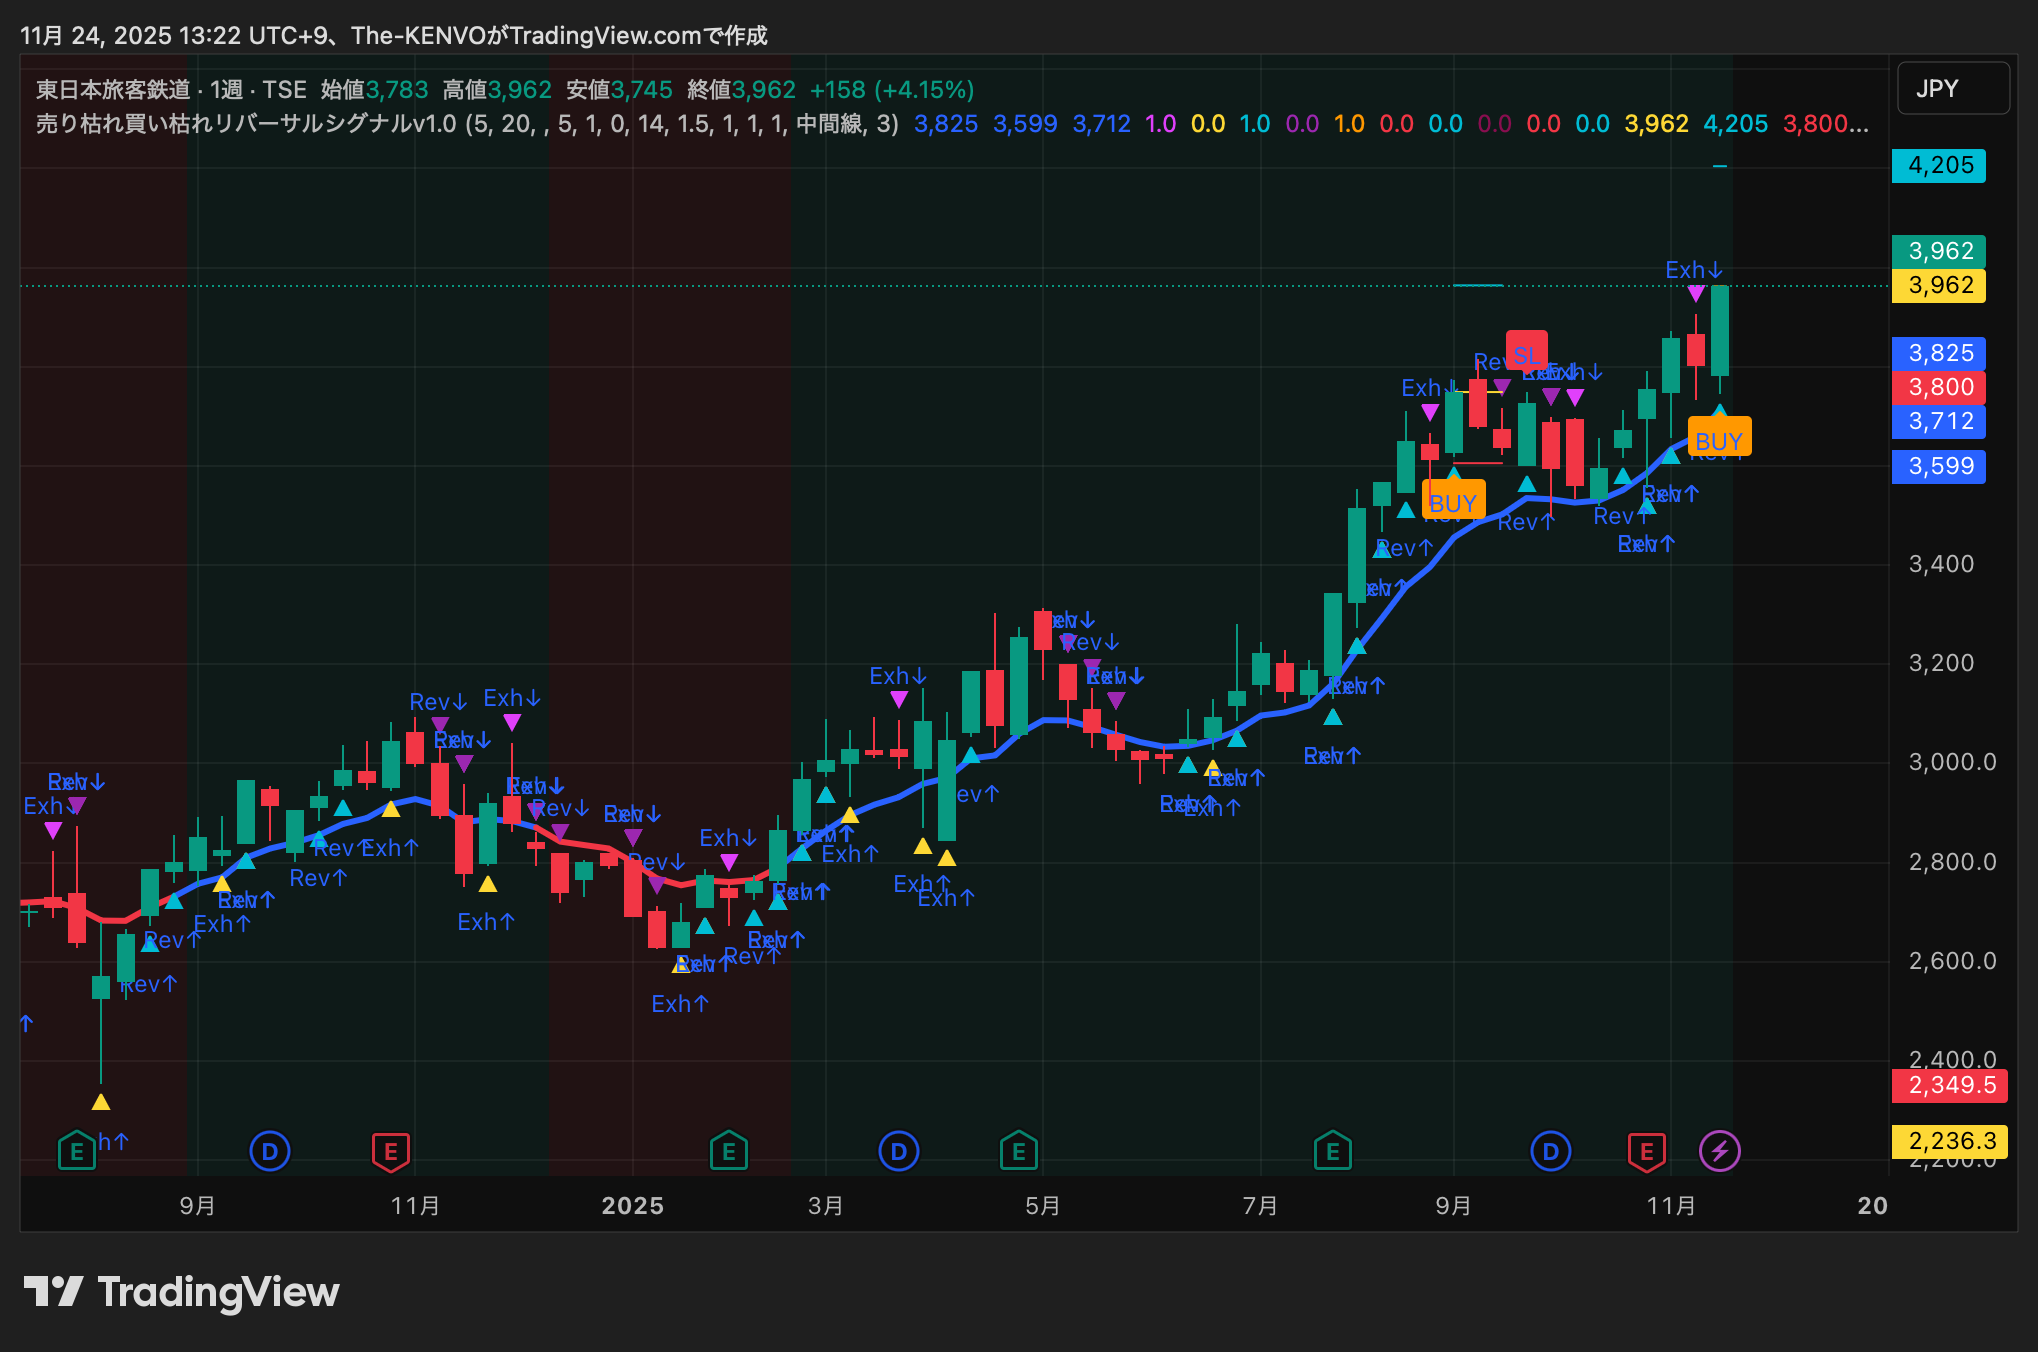
⑦ East Japan Railway (9020) — BUY
Continued recovery in travel demand reflected in earnings and stock price, forming a consistent weekly uptrend. Pullbacks with shallow Exh↑ show resilience, and EMA20 remains strongly upward, signaling trend stability. BUY lighting is a signal of trend re-acceleration.
Outlook:
Bullish: break through 4,200; Neutral: 3,850–4,000; Bearish: below 3,700.
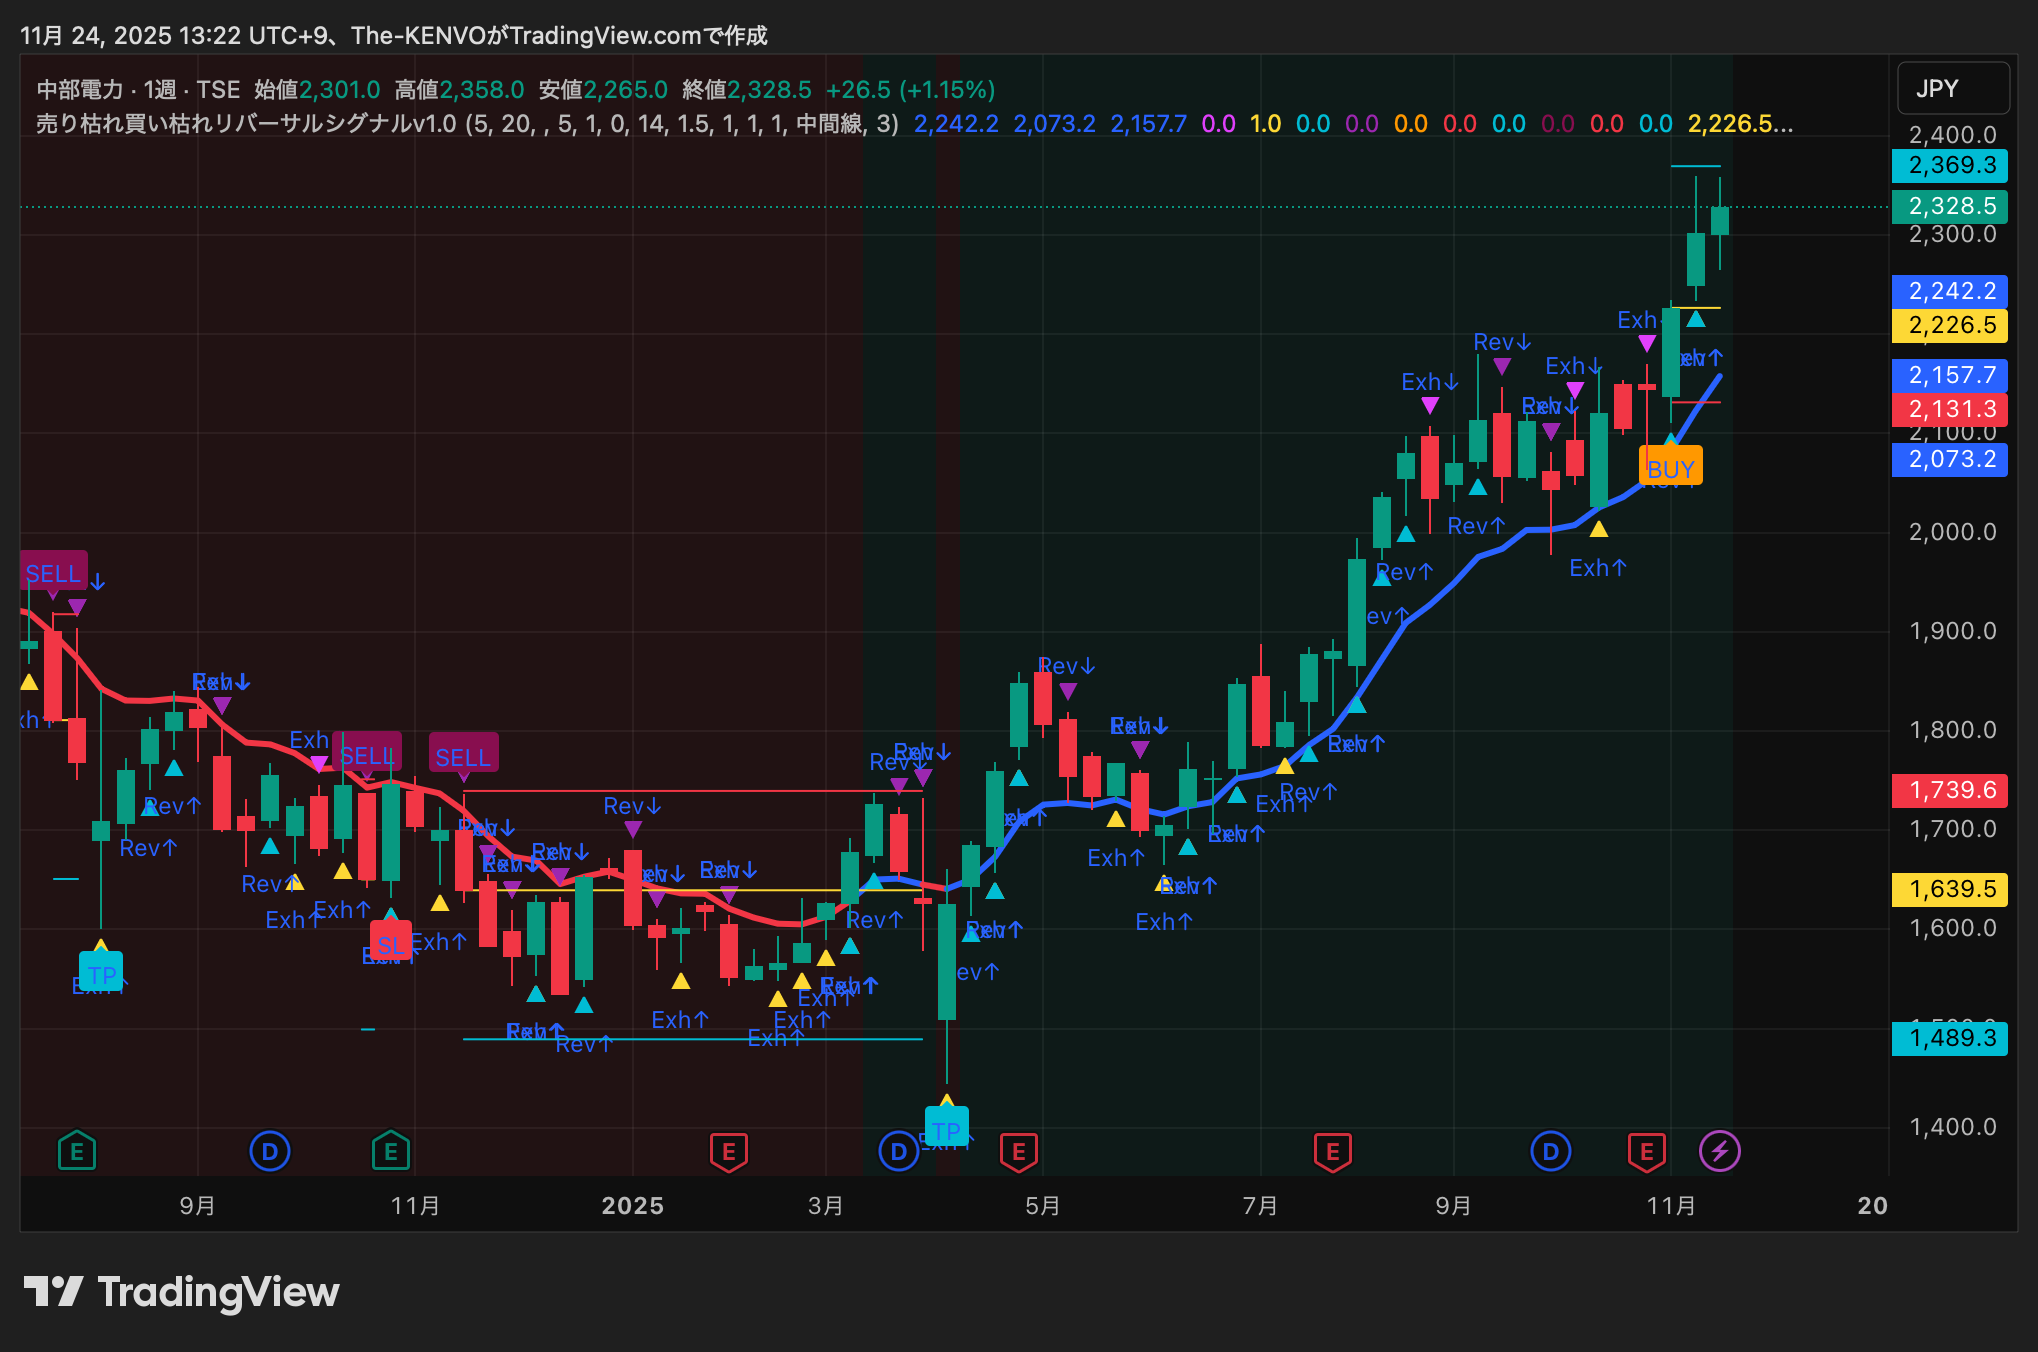
⑧ Chubu Electric Power (9502) — BUY
Unusually strong upward channel for a utility stock, with right-shoulder gains since June. Exh↑ during pullbacks and a recent rebound supported by EMA20 confirm the uptrend. Long lower wicks indicate substantial buying support.
Outlook:
Bullish: in the 2,400s; Neutral: 2,200–2,300; Bearish: below 2,150.
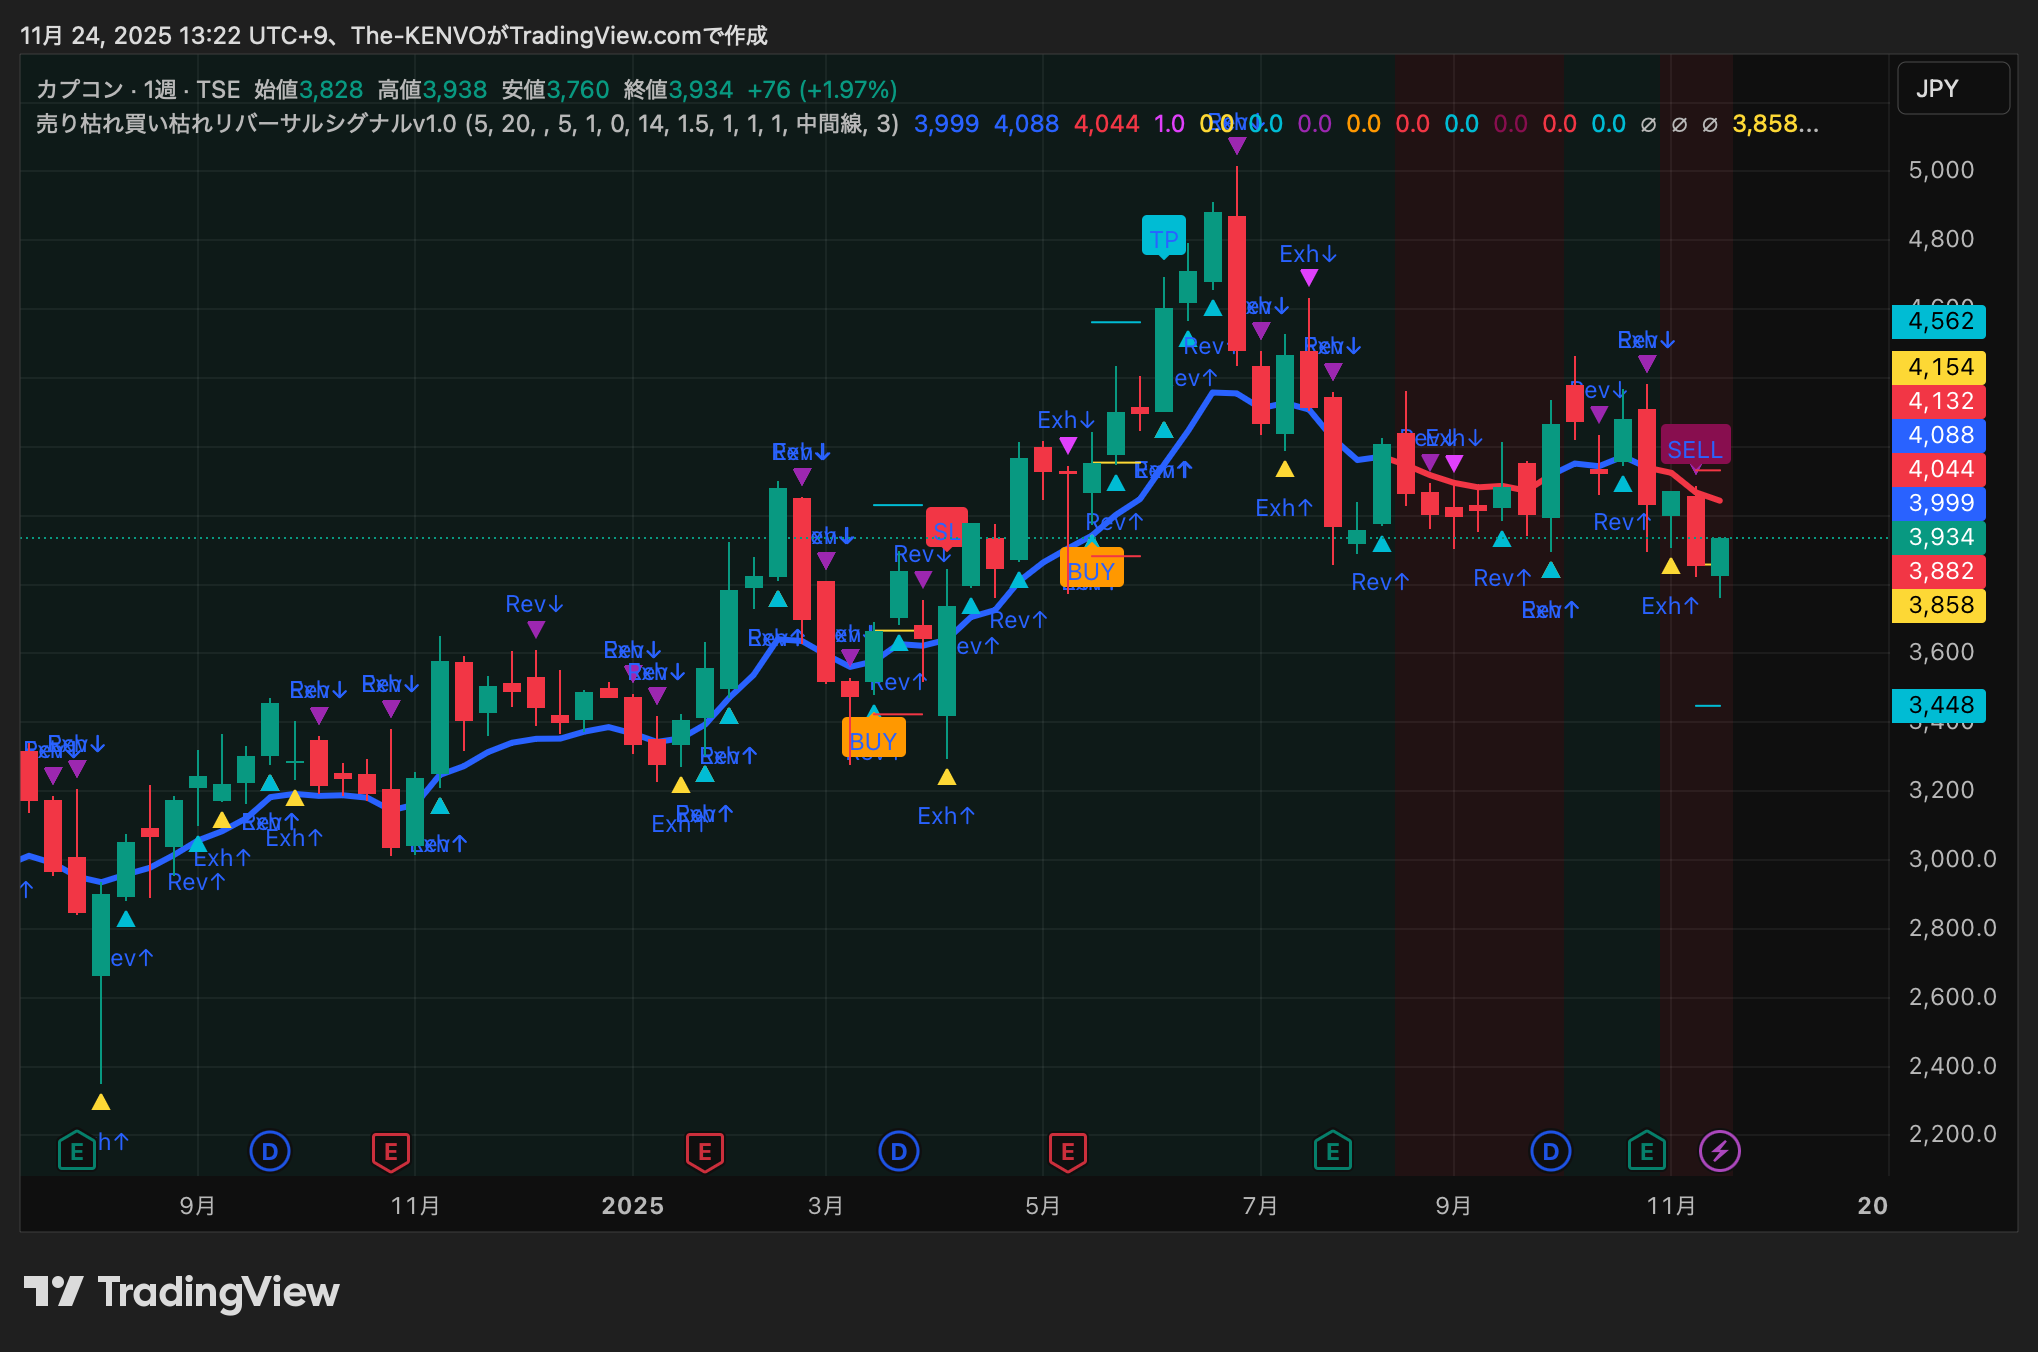
⑨ Capcom (9697) — SELL
Only SELL stock. Gaming sector momentum waned since summer; Capcom showed consecutive Sell Exhaustion at high levels, followed by Rev↓, confirming a real body reversal. EMA5 turned downward, indicating a trend reversal contrary to BUY signals.
Outlook:
Bearish: 3,700→3,500; Neutral: around 3,800±50; Bullish: EMA20 recovery required.
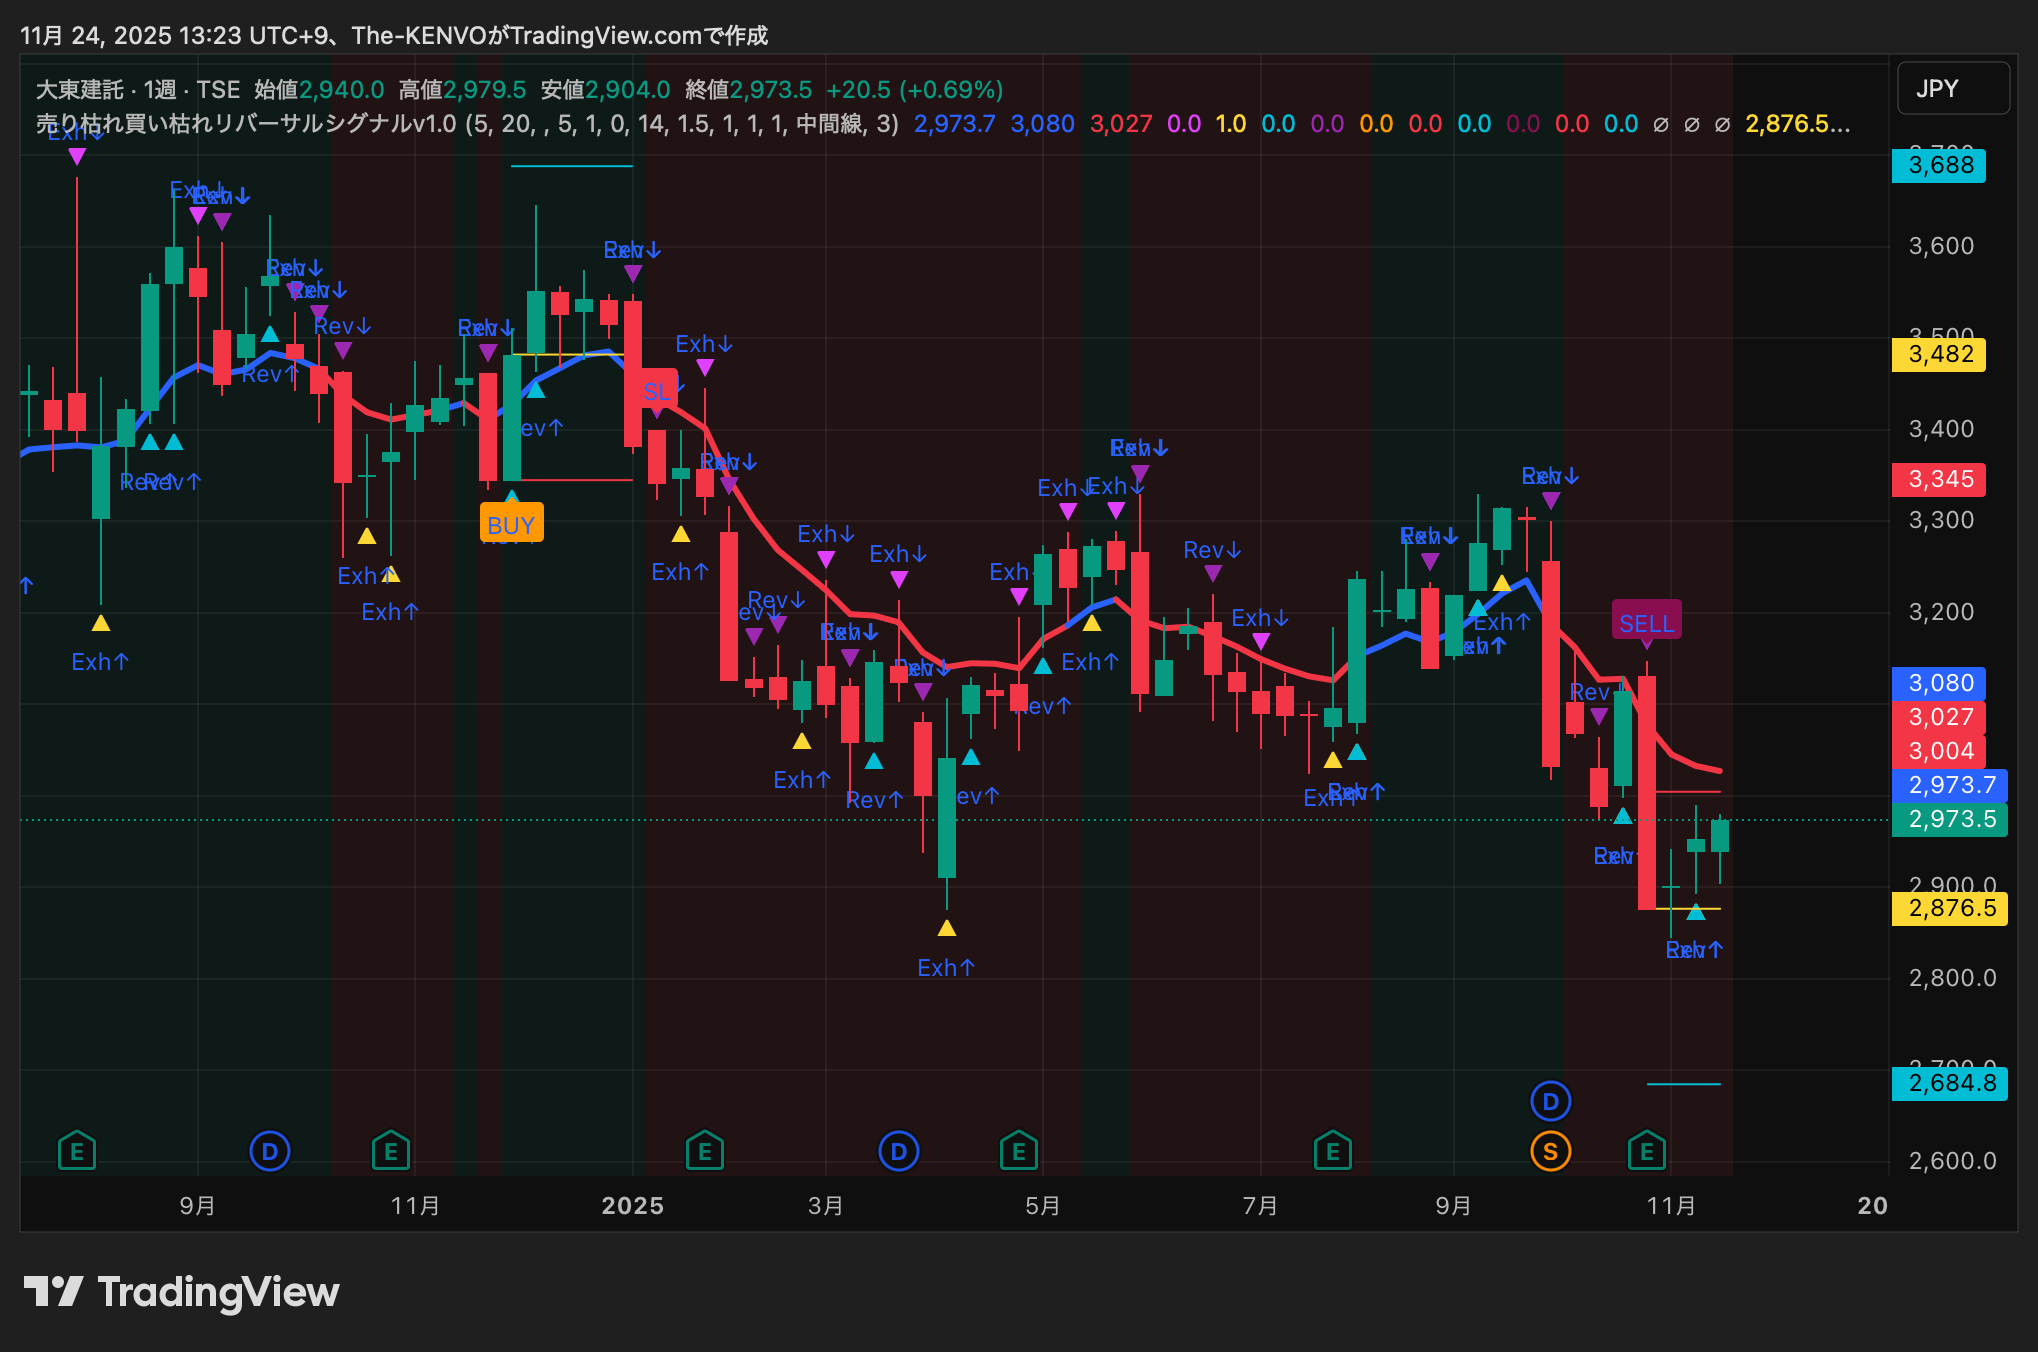
⑩ Daiwa Construction (1878) — SELL
Recent weekly chart shows a shift from long-term uptrend to a mostly downward correction from Sep–Nov, with lower highs. The latest candles show small real bodies even when bullish, indicating weak rebound. Sell Exhaustion (Exh↓) occurred repeatedly, signaling waning upside pressure, and a reversal foot (Rev↓) formed, triggering SELL signal. EMA5 fully down, EMA20 sloping down, mid-term downtrend in effect. Rebound selling likely; investor sentiment shifting to “sell the rally.”
Outlook:
Bullish scenario: unlikely unless price exceeds 2,150 and EMA20 is regained.
Neutral: 1,900–2,050 range.
Bearish: break below 1,850 opens further downside to 1,750.
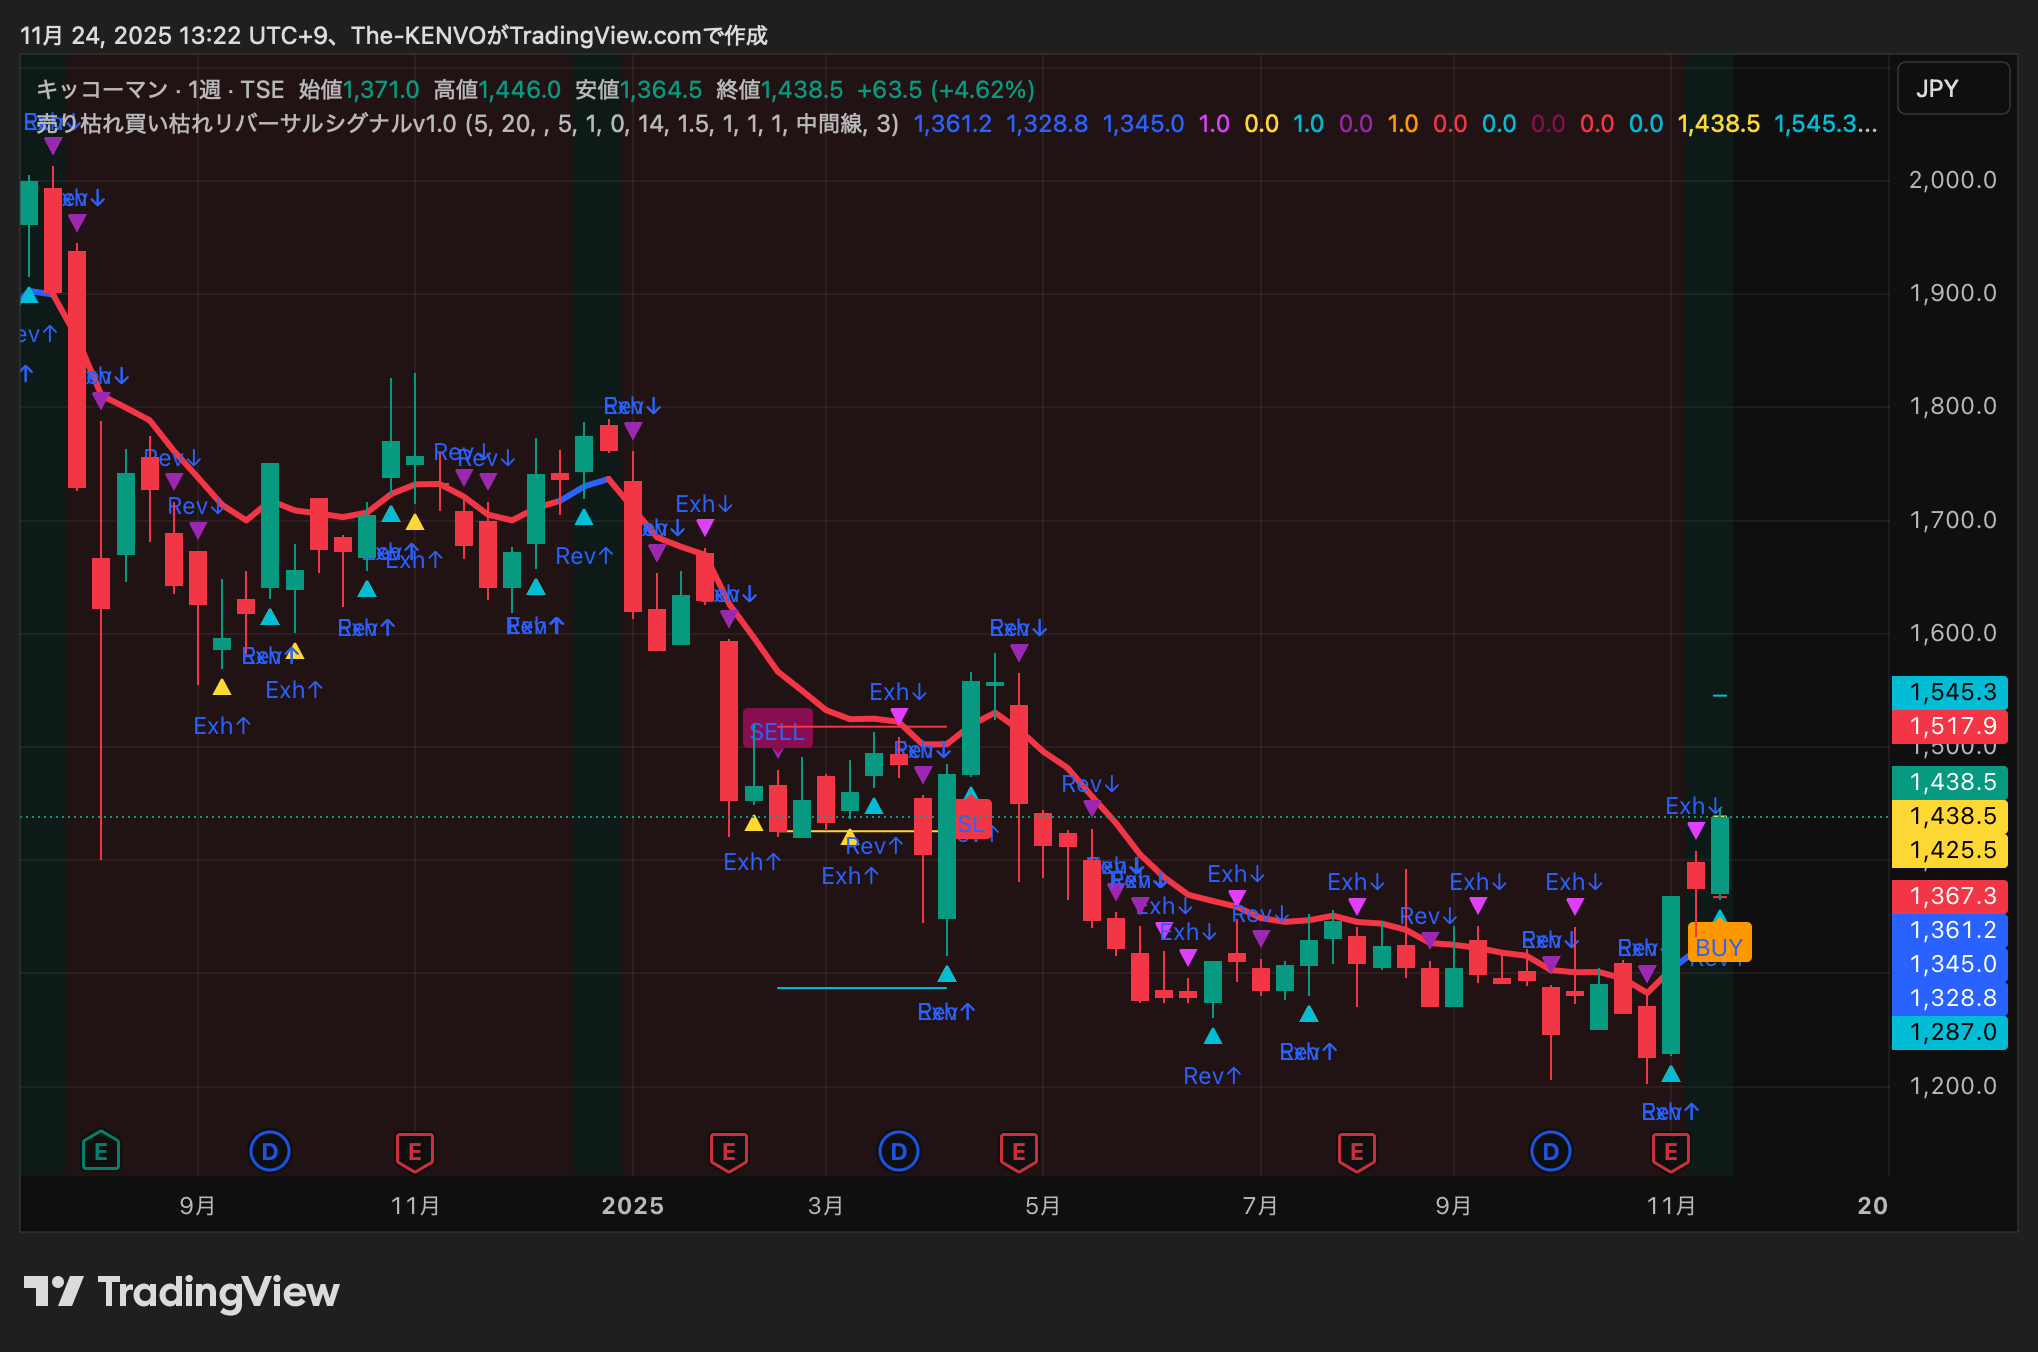
⑪ Kikkoman (2801) — BUY
After a down phase through Aug–Oct, momentum slowed and weekly lows began to edge higher from Oct onward. Multiple Sell Exhaustion (Exh↑) signals emerged, indicating selling pressure has exhausted. BUY lighting occurs when a bullish engulfing candle forms, aligning with EMA5 turning upward from a flat to rising trajectory. Food stocks tend to be less affected by market mood, making reversal signals more reliable.
Outlook:
Bullish: target a new high above 9,000.
Neutral: 8,200–8,600 flat range.
Bearish: pullback toward around 7,800 if EMA20 breaks.
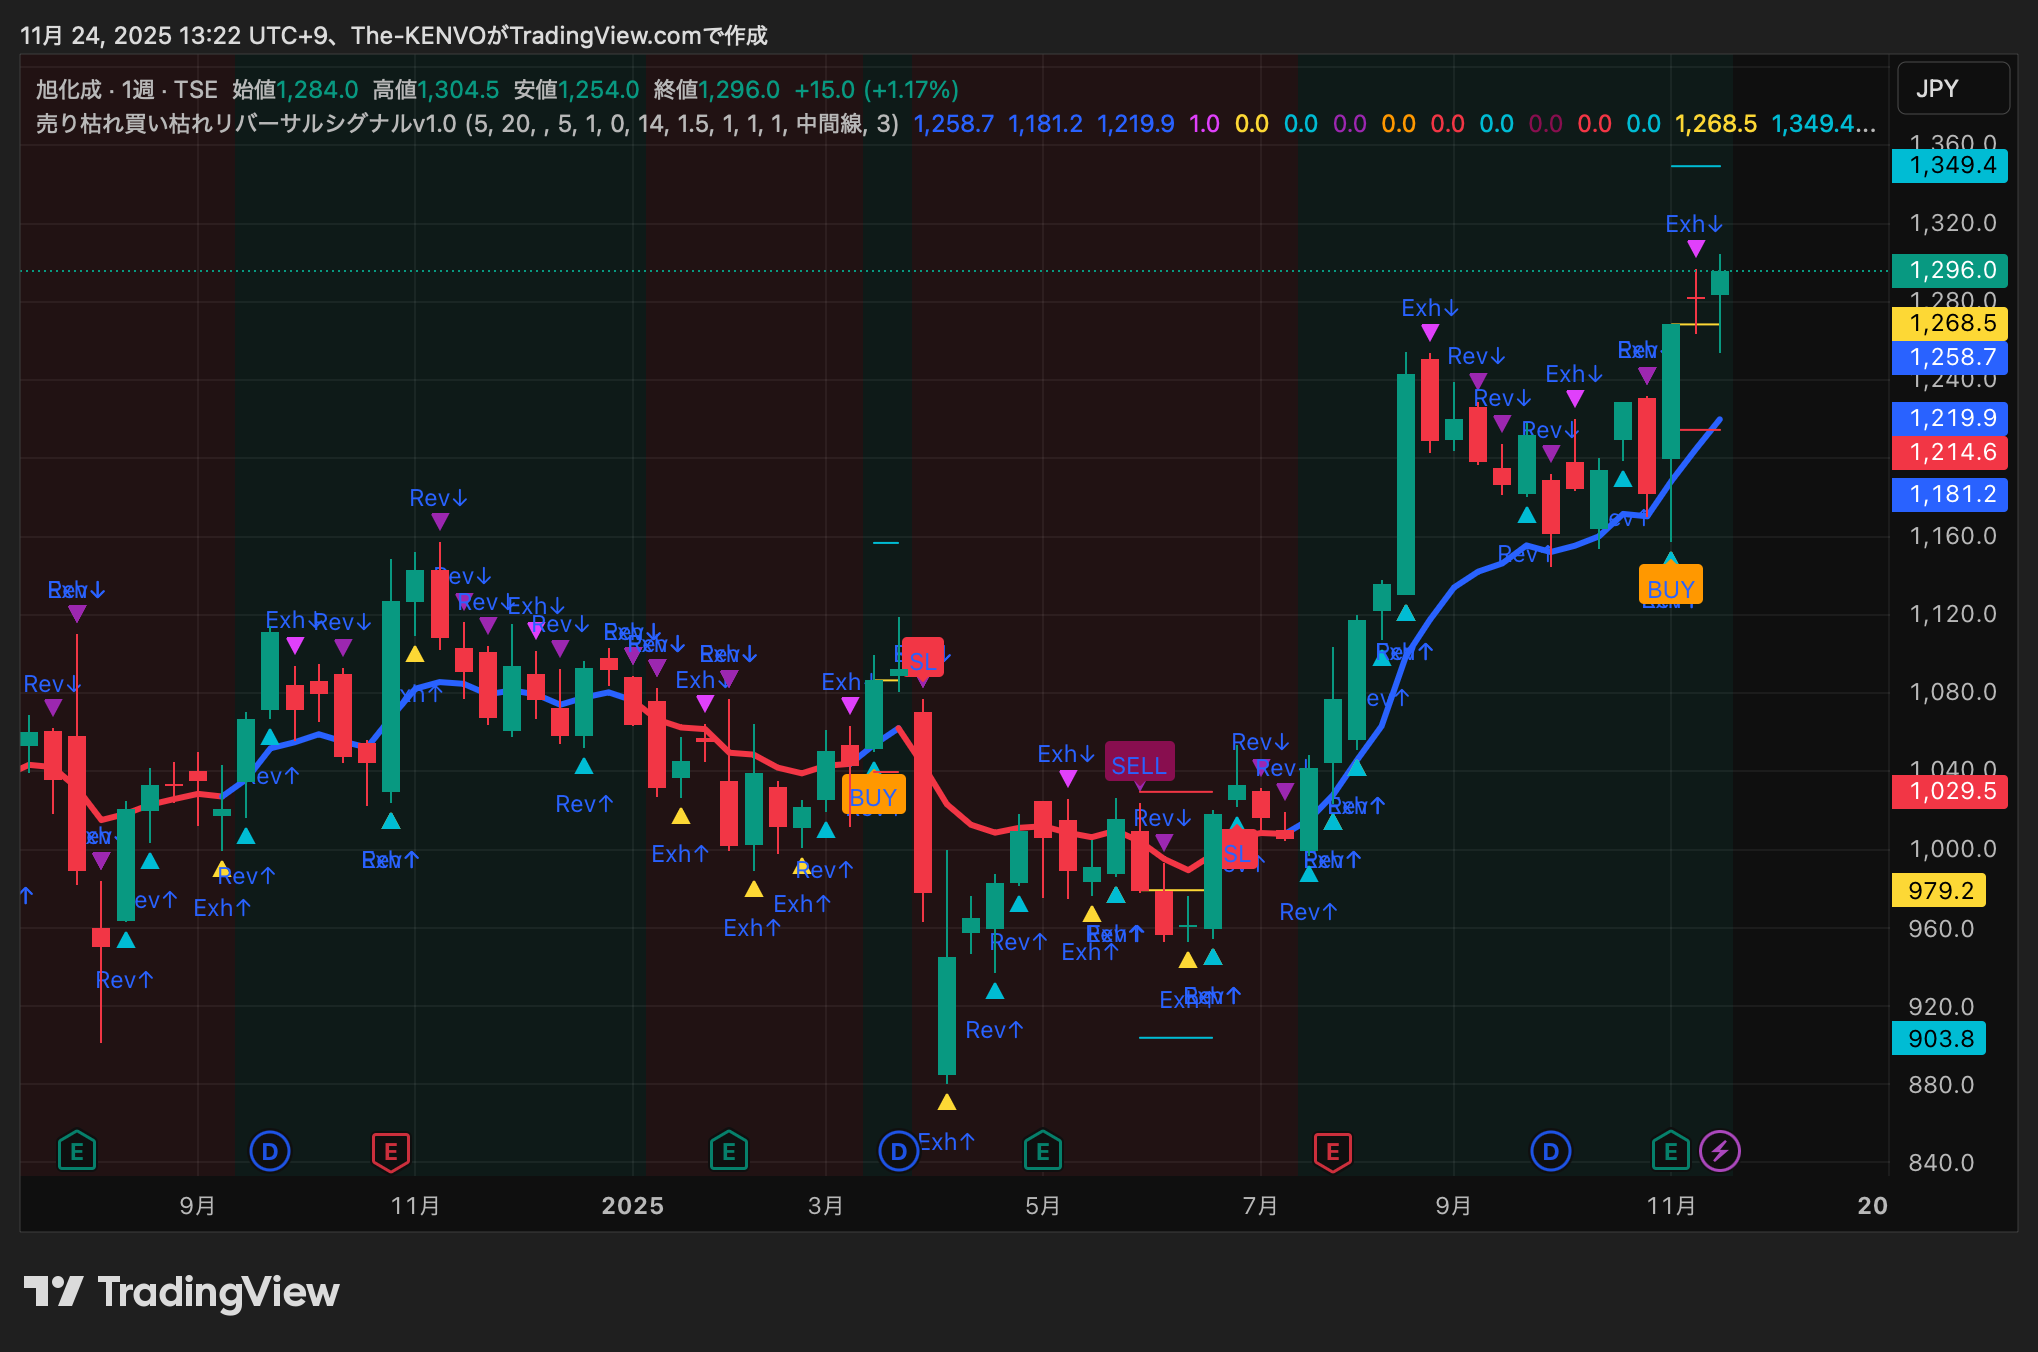
⑫ Asahi Kasei (3407) — BUY
Chemical sector weakness gave way to a clear Exh↑ at the bottom; long lower wicks indicate selling pressure has ended. Rev↑ → BUY flow suggests consolidation of the recent declines. EMA5 already up; EMA20’s downward angle is easing, indicating early-stage trend reversal.
Outlook:
Bullish: break through 1,050.
Neutral: 950–1,000 in a range.
Bearish: break below 900 possible.
⑬ Nexon (3659) — BUY
Game sector remains resilient relative to Capcom; since October, a sequence of Sell Exhaustion → Reversal → BUY has functioned clearly, demonstrating a strong uptrend with pullbacks buying support. Weekly moves often near highs, but EMA20 provides downside support, thick layer of pullback buyers. BUY lighting signals trend re-acceleration and persistence of upside.
Outlook:
Bullish: reach 3,000 and break to 3,200.
Neutral: 2,700–2,850.
Bearish: break below 2,600 changes scenario.
⑭ Nippon Paint Holdings (4612) — SELL
Weekly chart showed a potential breakout from a range, but recently multiple Sell Exhaustion (Exh↓) signals appeared, clearly slowing upside momentum. After reversal patterns such as engulfing and long lower wicks, bullish candles failed to continue, showing slowing velocity with shrinking bodies and more bearish candles.
Even though EMA5 and EMA20 had continued upward, their slopes have recently flattened, and EMA5 may cross below EMA20. Taken together, the uptrend may be losing steam, suggesting an imminent reversal or consolidation.
Outlook:
Bullish: if EMA20 is broken to the upside again, a mid-4xx/ mid-400s reversal could occur.
Neutral: range bound around 360–390 with no clear direction.
Bearish: break below 350 could confirm a downtrend.
⑮ Otsuka Shōkai (4768) — BUY
Among IT services stocks, this stock shows strong trend stability; during tight corrections, Sell Exhaustion (Exh↑) was frequent. The recent reversal (Rev↑) with a bullish engulfing candle is a textbook example of a successful buy signal. EMA20 is upward-sloping, sustaining a pullback-biased weekly environment.
Outlook:
Bullish: reaccelerate toward the 9,500s.
Neutral: 8,700–9,100.
Bearish: drop below 8,500 triggers correction.
⑯ AGC (5201)
Outlook:
Bullish: break through 5,300 with a view to 5,500.
Neutral: 4,900–5,200 range.
Bearish: below 4,850 may negate the setup.
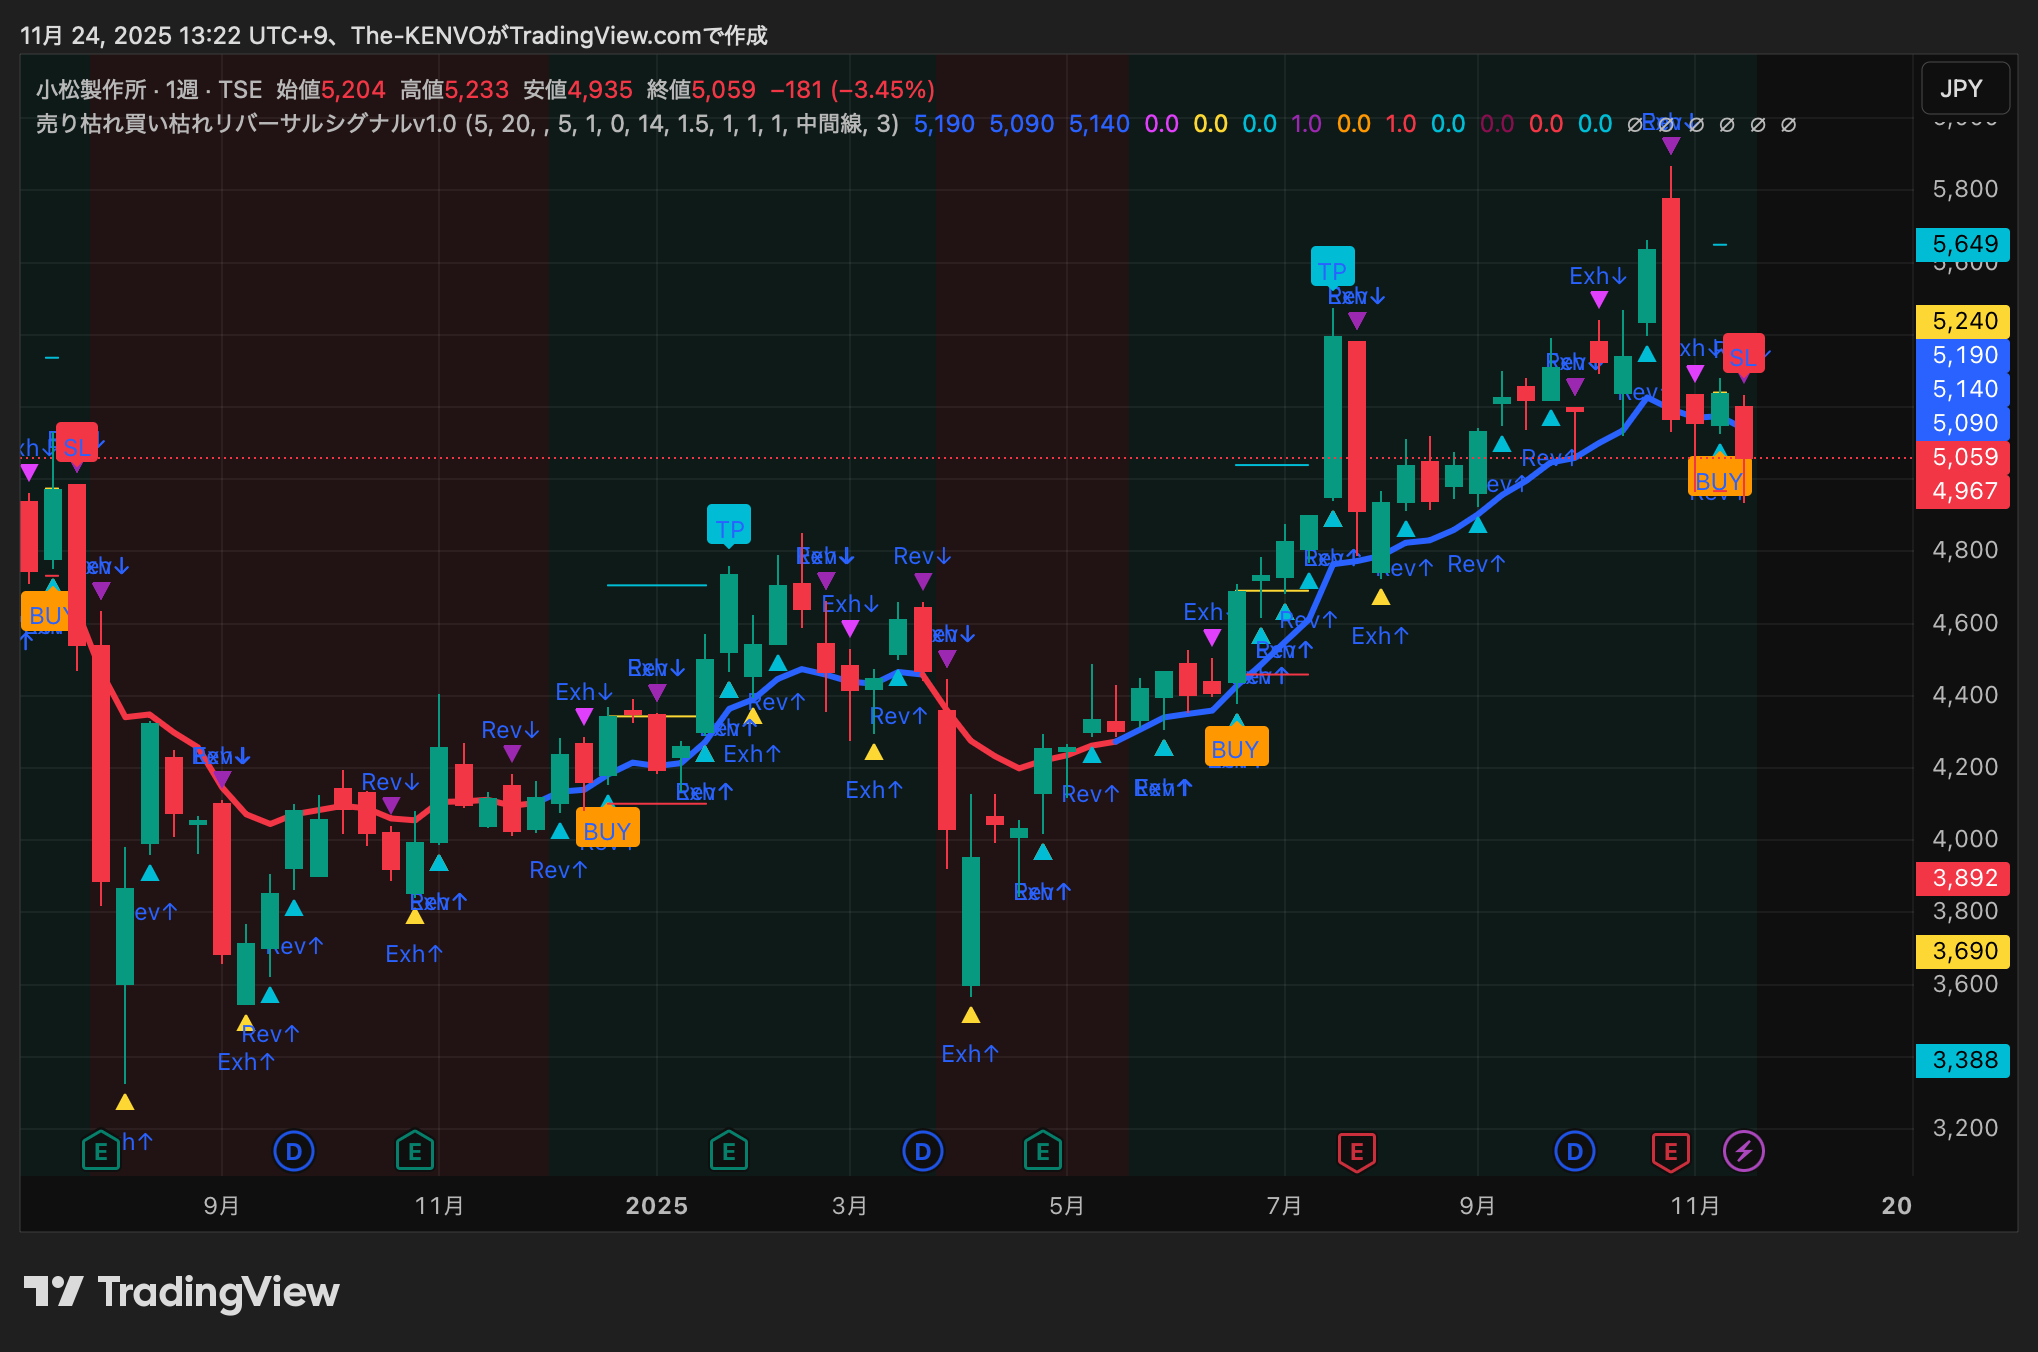
⑰ Komatsu Ltd. (6301) — BUY
Heavy machinery stock with cyclical sensitivity; pullbacks in consolidation are limited, with Exh↑ providing downside support. Rev↑ wrapped around recent bearish candles, confirming a removal of downside pressure. EMA20–aligned upward trend continues.
Outlook:
Bullish: new highs beyond 4,200.
Neutral: 3,800–4,000 range.
Bearish: below 3,750.
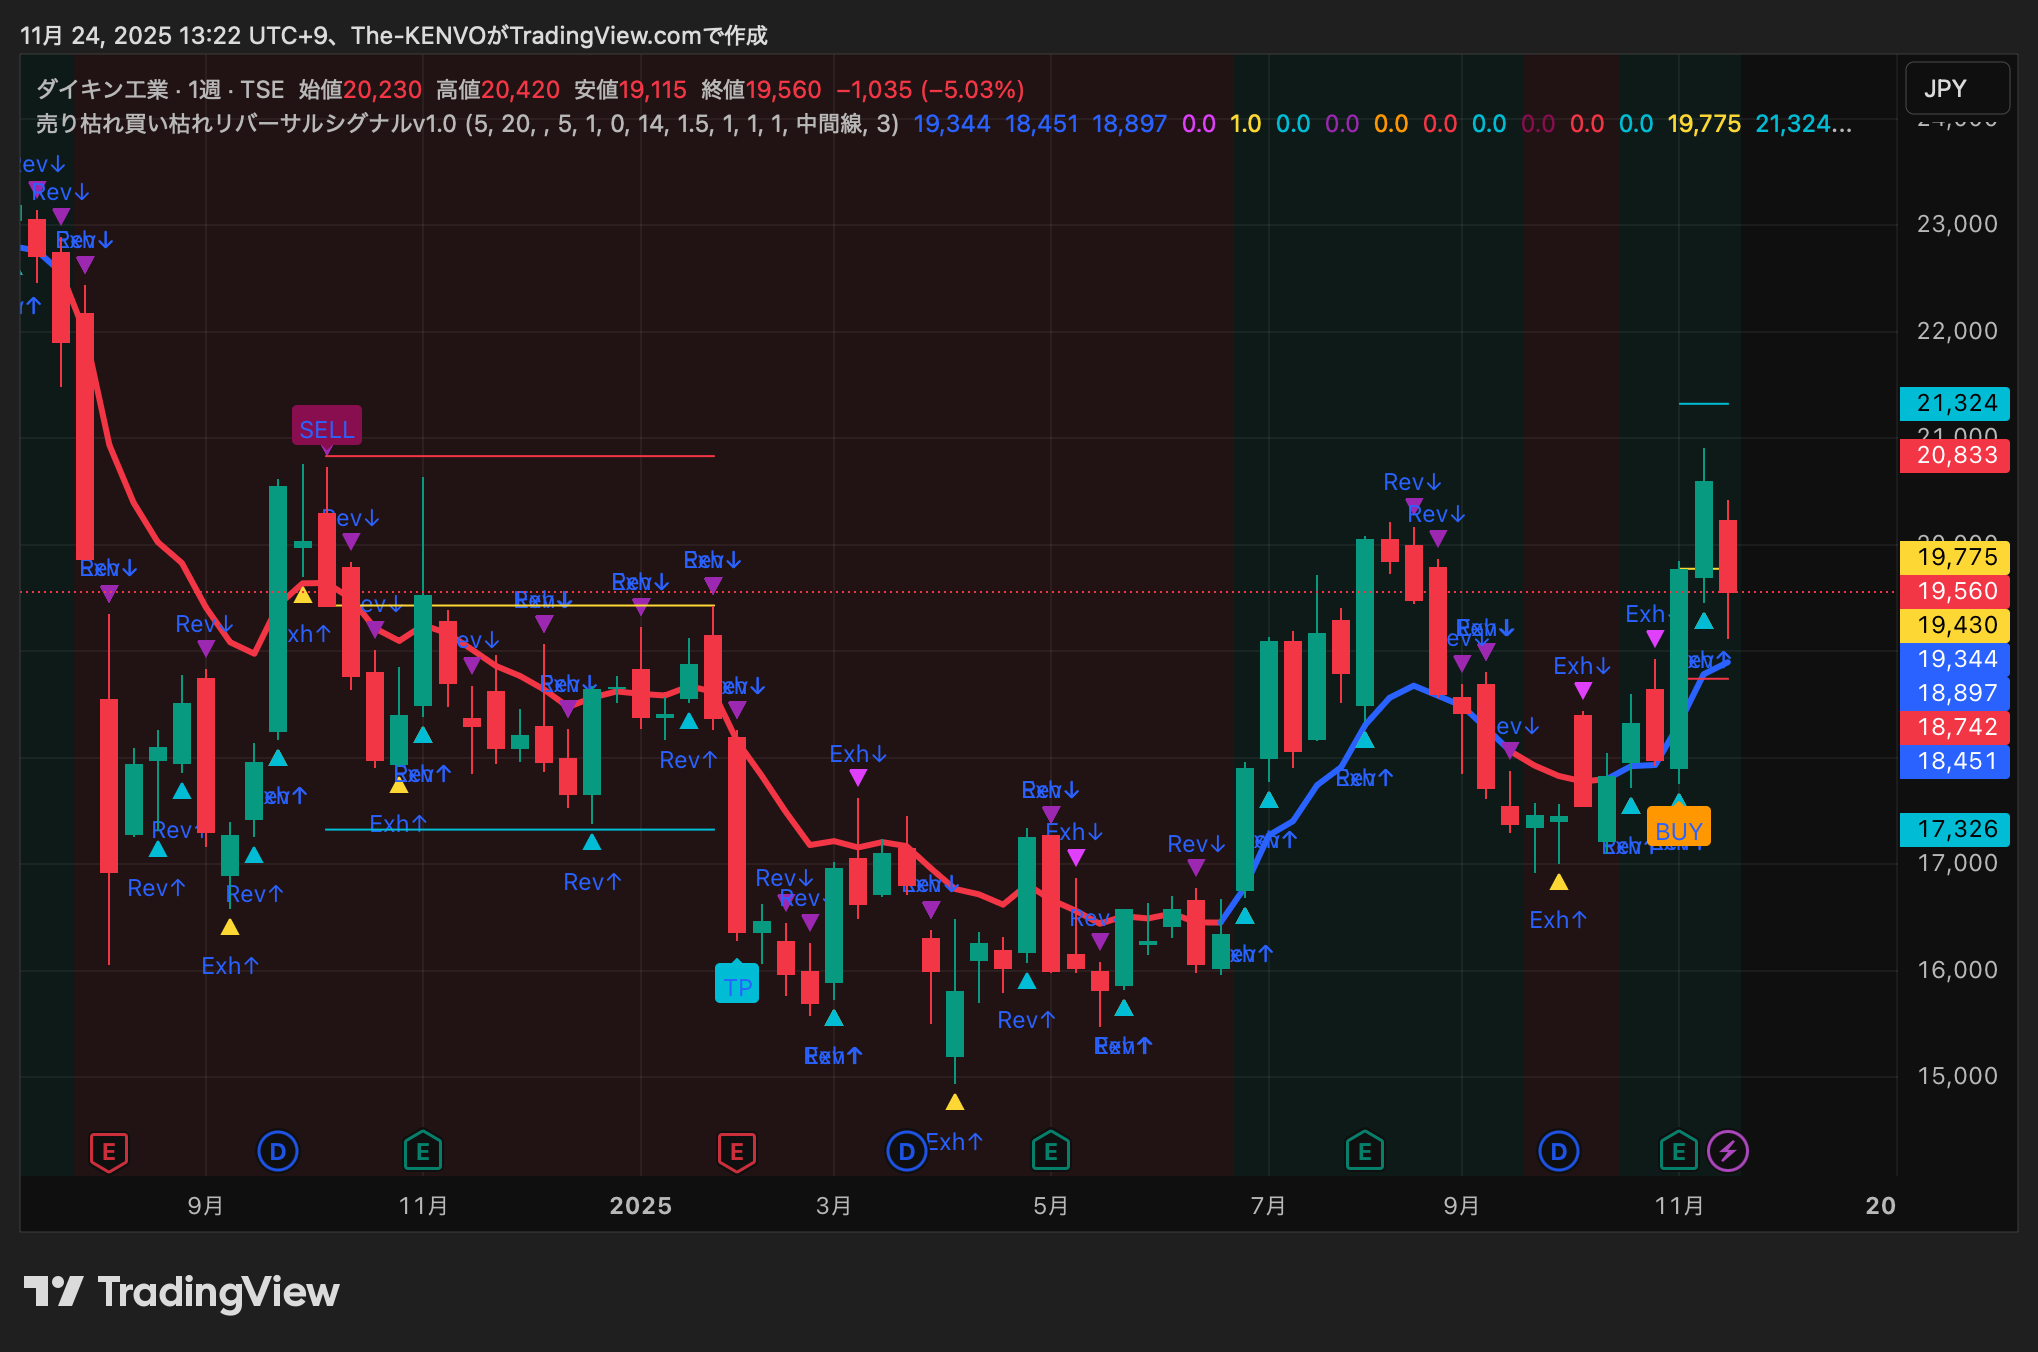
⑱ Daikin Industries (6367) — BUY
The world’s largest air conditioning maker saw continued softness due to global capex slowdown, but during the downside in Sep–Oct, several Exh↑ occurred showing clear limit to downside. Recent weekly Rev↑ formed as a bullish engulfing candle, and BUY lighting indicates a trend reversal. EMA5 turned up, EMA20’s downward tilt slowed, signaling a clear sign of trend change. For a large-cap stock, this is a textbook reversal with high likelihood of further gains.
Outlook:
Bullish:突破 21,500 to challenge the high of the year.
Neutral: 19,800–20,800 range.
Bearish: below 19,500 risks a downtrend resumption.
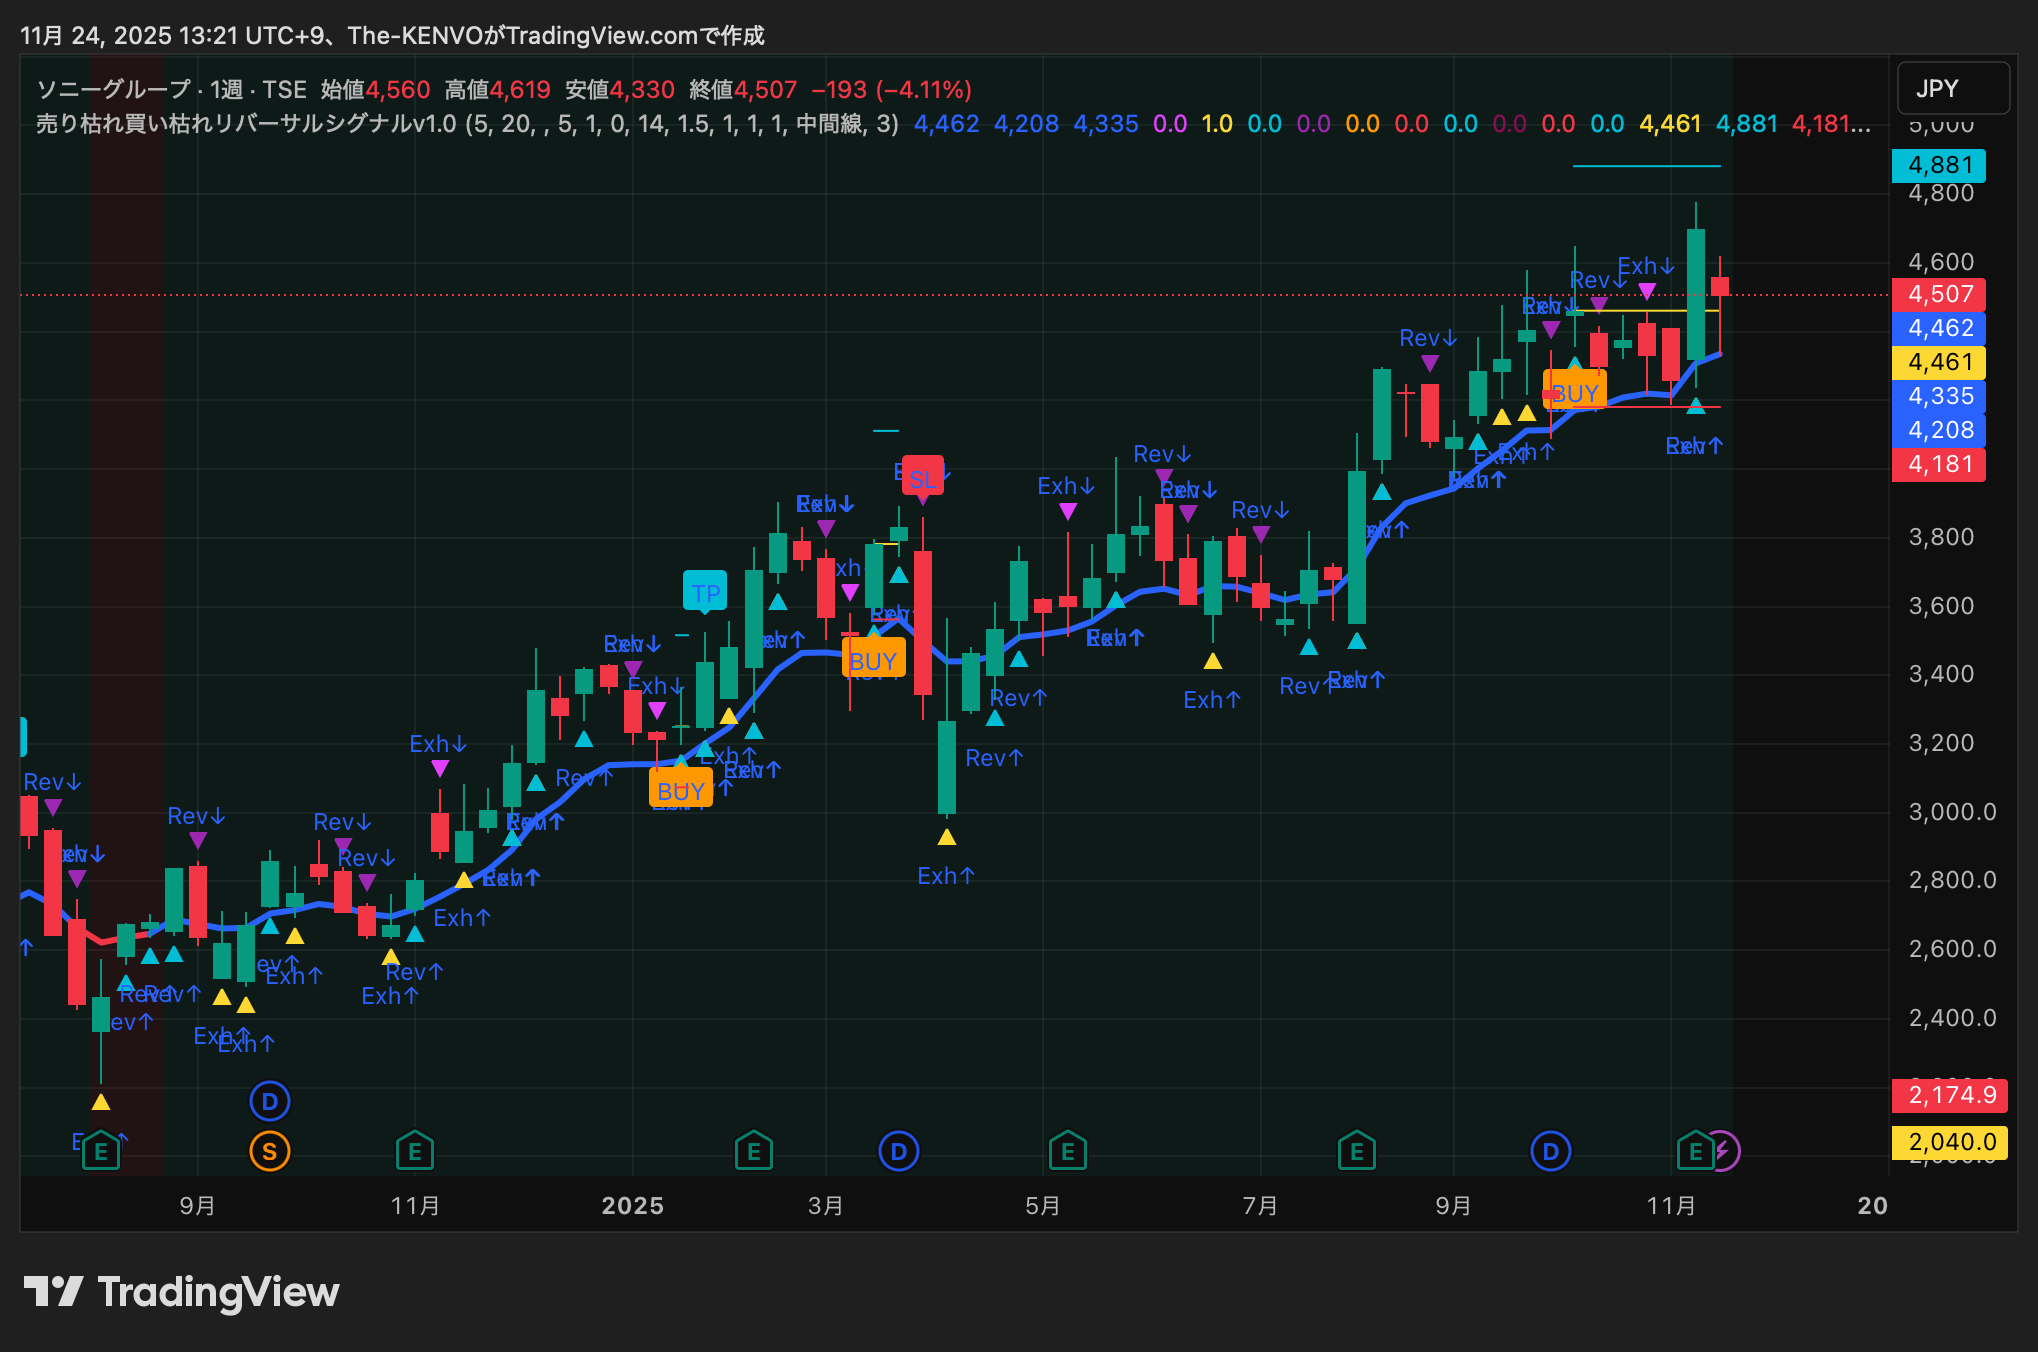
⑲ Sony Group (6758) — BUY
Pullback in an uptrend is clearly forming; multiple Exh↑ during consolidation support the BUY lighting. EMA20 provides sturdy support, and recent bullish candle engulfs several prior bearish candles, signaling a strong reversal. With strengths across gaming, music, and semiconductors, and positive fundamental outlook, buying pressure remains favorable.
Outlook:
Bullish: attempt to reach 15,500.
Neutral: 14,000–14,800.
Bearish: below 13,700 could see selling pressure.
【Summary】
This time, screening the top 200 TSE Prime stocks by weekly charts for the “Sell Exhaustion Buy Exhaustion Reversal Signal v1.0” yielded an extreme tilt toward reversals: 16 BUYs and 3 SELLs. This is not mere coincidence; multiple sectors showed a common structure of “Sell Exhaustion → Reversal → Trend resumes,” implying a potential shift toward mid-term uptrends on weekly charts.
What stood out is that Sell Exhaustion (Exh↑) and Reversal (Rev↑) aligned to produce clear BUY signals on many large caps, which were often supported by EMA20. This is not just a rebound; it reflects a structure that captures the early stage of a trend.“The early movement” captured by this indicatoris common among the stocks.
And precisely to capture this early movement, this article uses Sell Exhaustion Buy Exhaustion Reversal Signal v1.0
Most standard indicators aim for “bottom-finding” or “high-price warning” by looking at extreme price levels. This indicator, however, combines
Fatigue of multiple consecutive bearish/ bullish candles
Contraction of real bodies
Reversal structures like engulfing patterns
Conformity with trend direction
and judgments are integrated so it focuses on the moment the reversal first confirms without forcing a bottom guess.
Even in this 19-stock BUY cluster, every signal lit up at a moment that was not too early nor too late, aligning with weekly trend changes with high precision. This precision is the core value of using this indicator.
Also, Capcom—one of the SELL stocks—showed strong Sell Exhaustion (Exh↓) and Reversal (Rev↓), signaling danger signals that diverged from the broader market, underscoring that the indicator does not miss downside in rising markets.
In the future, whether the market moves higher or whether each stock takes its own path—this is where practical analysis begins.
What will happen to the 19 stocks after this screening?
Are the weekly chart reversals “genuine,” or is a mid-term pullback forming?
Next article will detail “How those 19 stocks moved after the BUY/SELL signals appeared.”
We will report on price movements after signals, how uptrends surges or stall, and where the indicator demonstrates power, using actual charts.
This screening is the first step.
Please look forward to what results the sequel will yield.
【Sell Exhaustion Buy Exhaustion Reversal Signal v1.0】Strengths — 5 Key Points
① Not “bottom guessing,” but designed to capture the initial reversal
Many contrarian indicators react when price hits a local bottom, often triggering entries too early.
This indicator combines Exhaustion (Sell) and Reversal to illuminate signals in two stages: elimination of selling pressure → reversal confirmation
In this 19-stock screening, almost all stocks reversed one or two candles after the bottom, supporting practical accuracy.
② Uses statistically strong points that align with past typical patterns
This indicator is validated by past charts and uses
Fatigue of consecutive bearish/bullish candles
Contraction of real bodies
Reversal structures with engulfing or long wicks
Relative positions to EMA5/EMA20
and other typical trend-reversal patterns
Rather than rely on single condition, it extracts only high-probability situations where multiple conditions align, reducing false signals on weekly and daily timeframes.
③ Works across sectors and has high reproducibility for trend reversals
The 19 stocks include real estate, utilities, finance, semiconductors, consumer goods, and manufacturing—representing broad sectors.
Large-cap stocks across sectorswere included.
The cluster of BUYs across the board occurred because the market-wide Sell Exhaustion → Reversal → Trend resumes structure appeared in common.
In short, this indicator
Performs well on trendful stocks
Works on stocks prone to post-earnings volatility
Applies to cyclical stocks
Still reliable on defensive stocks
as it captures the market's breathing
and is strong for multi-stock detection
④ It can assess not just “reversal and end” but the quality of trend continuation after reversal
When BUY/SELL lights up, the direction of EMA5/EMA20 and the candle alignments affect the probability of continued trend.
In this run, many of the 18 BUY signals were patterns where the mid-term uptrend was supported by EMA20.In other words, this indicator does not merely judge reversal accuracy but also evaluates the quality of subsequent upside, making it applicable to weekly and daily mid-term swings.
⑤ It brings consistency to investment decisions and greatly reduces complex discretionary judgment
When capturing the initial stage of a trend reversal, decisions become complex: which candles to prioritize, how much decline constitutes sell exhaustion, which reversal candles are reliable, and whether the trend direction aligns. This complexity can lead to inconsistent trading results.
Reduces discretion drift
Stabilizes entries
Enables reproducible asset management
as a practical value.
? Final Word
What the 19-stock screening showed is
“Sell Exhaustion Buy Exhaustion Reversal Signal v1.0 delivers its strongest performance on weekly charts.”
And, precisely which stocks actually moved after this signal is shown below.
In the next article, we will report how those signals fared subsequently.
If after reading this article you think, “I want to use this signal in my watchlist,” this indicator is worth implementing.
The sequel will provide the answer.
Stay tuned.
Disclaimer
This article is not investment advice but an educational, practical explanation. Please make investment decisions at your own risk.
? Purchase / Details here
This indicator is listed on GogoJungle.
There are options to try easily, including【Monthly Version】 and【One-Time Purchase Version】.
【Monthly Version】 3,000 yen/month
【One-Time Purchase】30,000 yen