

Utilization of “Visualization Indicators” (Part 226)
Utilization of the "Visualization Indicator" (its226)
1. Further evolve the "28 Currency Pair List Indicator" into an indicator
"8CPVisualization Indicator"to drawGBPUSD.
The "8CPVisualization Indicator" includesOceania version,London version,NewYork version,AnyCP version. This time, we used theLondon version.
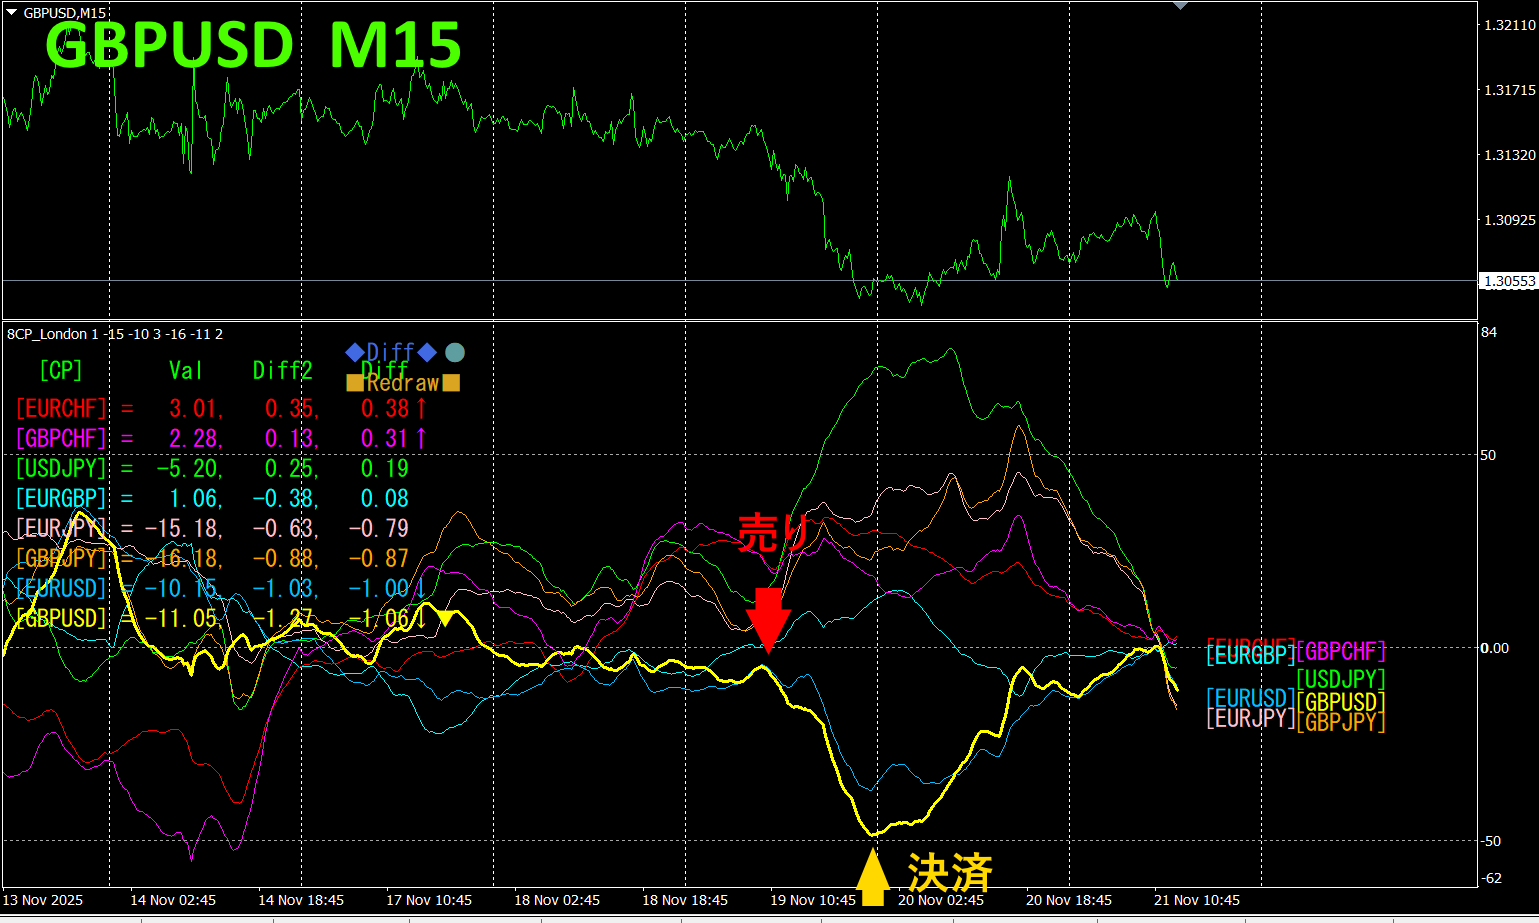
The upper half is theGBPUSD 15-minute chart. The lower half is from the8 CP visualization indicator, where the yellow bold-line graph corresponds to GBPUSD.
On Wednesday, the GBPUSD graph fell below the other graph group, so we traded sell. On that day, we sold at the bottom to close the position. Profit was about75 pips.
Currency Strength/Weakness Graph
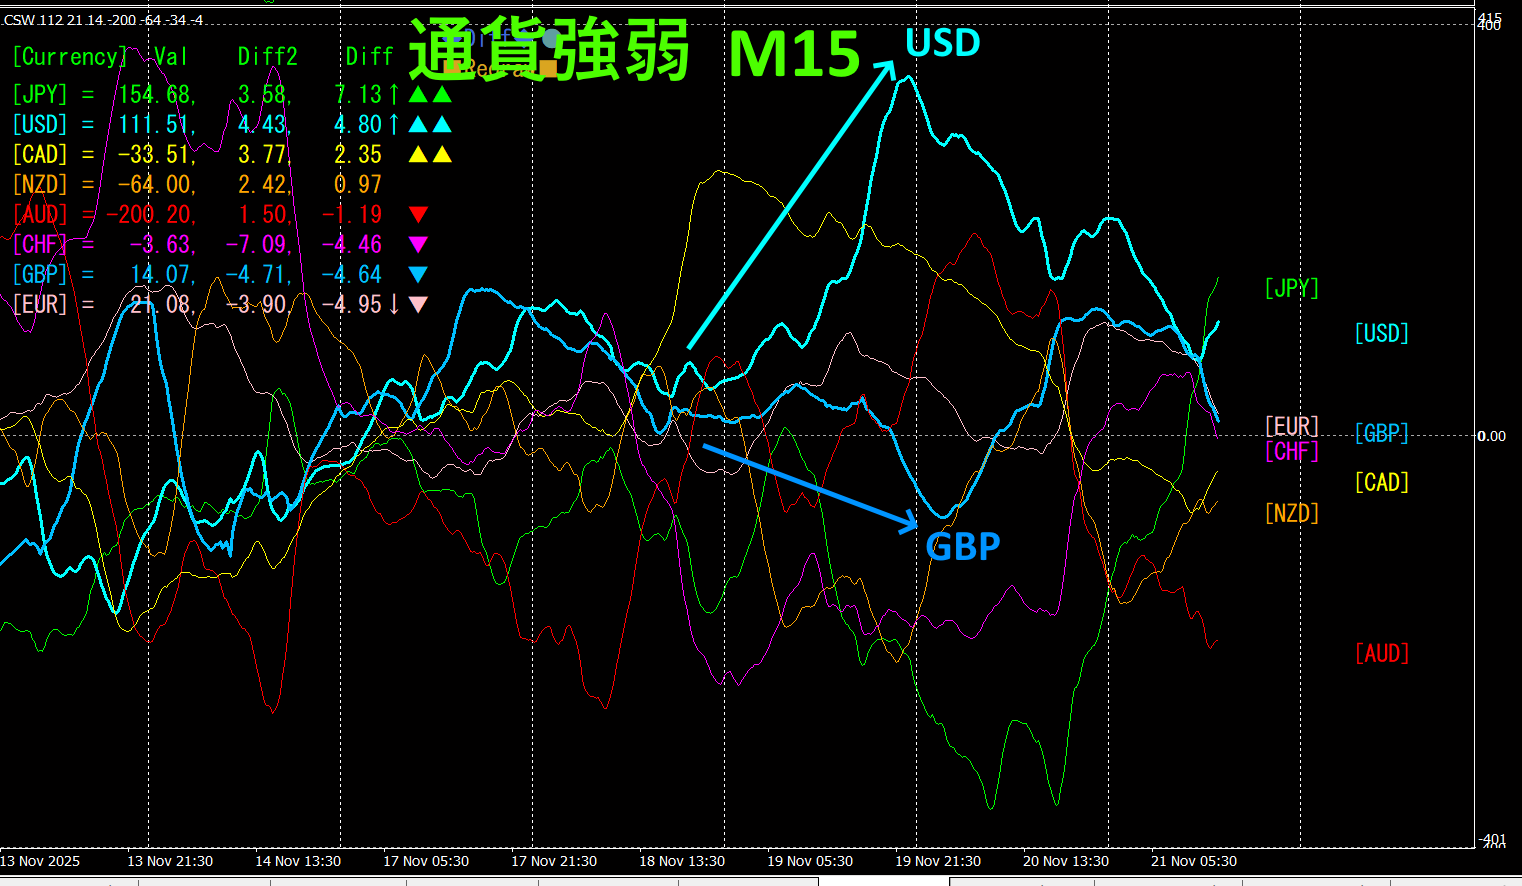
Looking at the 15-minute currency strength/weakness graph,USD andGBP show a remarkable inverse correlation.USD andGBP relationship is such thatUSD >GBP,USD andGBP broadened. Focus only on the parts where the vectors forUSD andGBP widen, and trade GBPUSD selling. If the graph fluctuates in the middle, keep the position while the USD and GBP vectors widen.
In FX, choose the currency pair that is currently expanding the most with inverse correlation and trade accordingly; the results will follow naturally.
“Aim for the Currency Strength Inverse Correlation!” isFX's iron rule.
If you use theTrendLine-EX, entries and settlements can be automated by crossing diagonal trendlines. You can leave it as is for easy trading. TheTrendLine-EX is a semi-automatic EA that can auto-sell on a break below the trendline and auto-settle on a break above it.
2. Best Select Try the Indicator
The below image is a screenshot from2025 year,11 month20 day, 00:27 (JST).
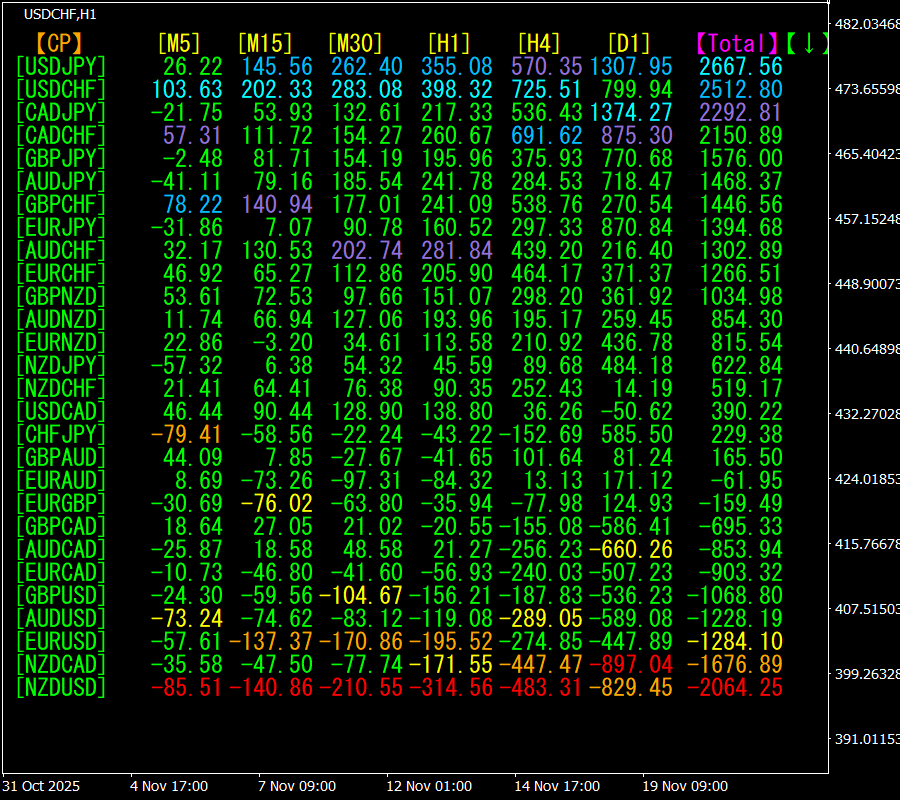
[Total]Numbers are arranged in descending order. The lowest entry,NZDUSD, is red across all timeframes.Total value is-2064.25, a large negative figure.NZDUSD indicates a descending trend is present.
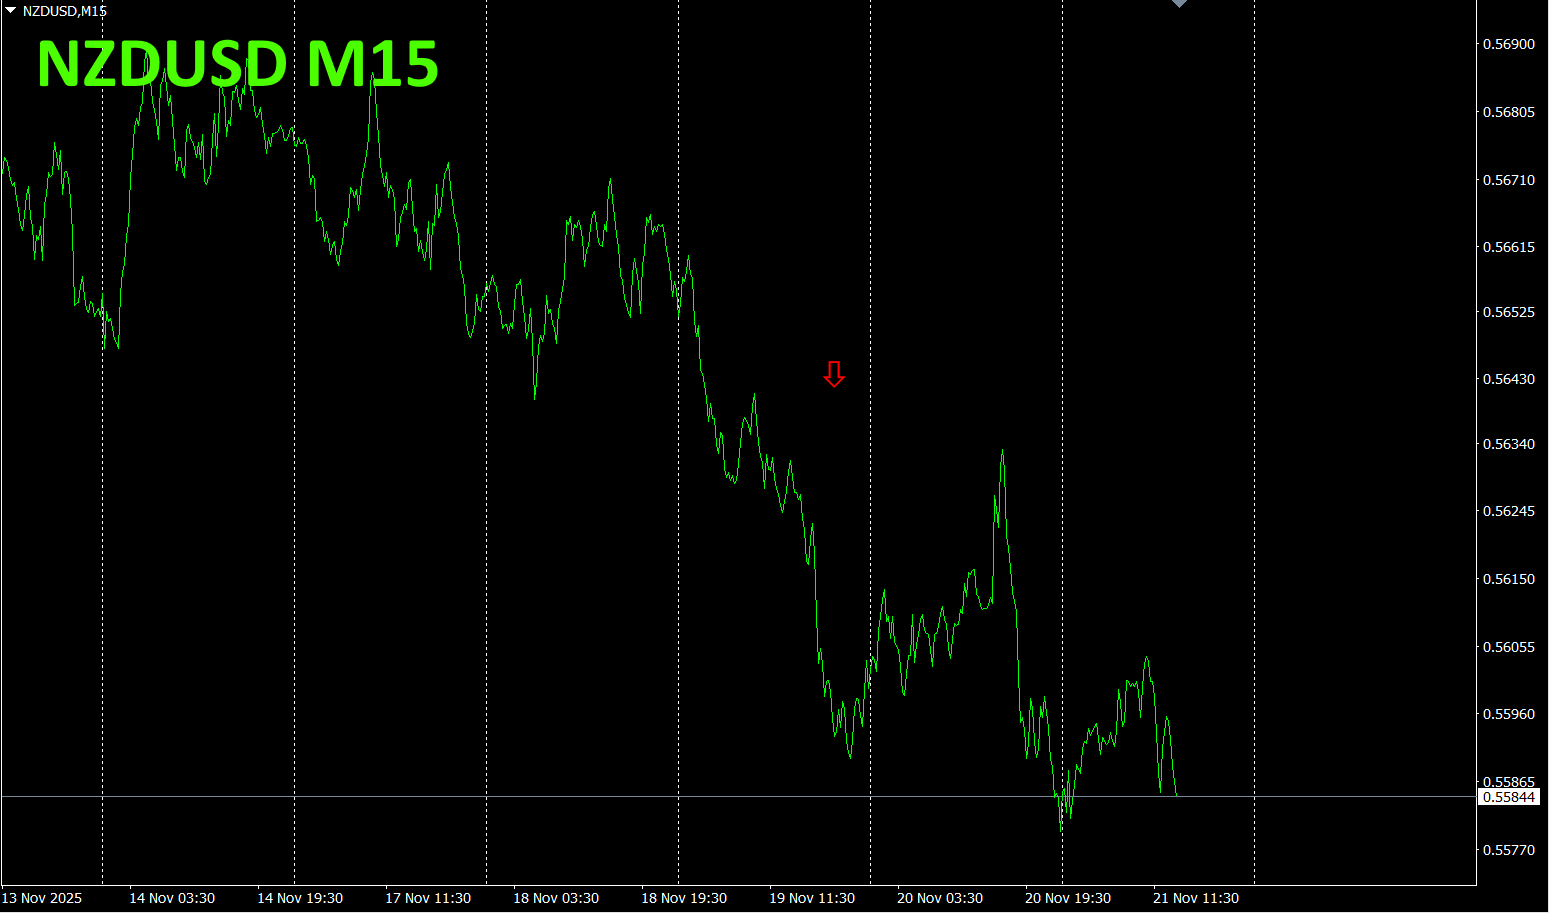
Now, let's look at the NZDUSD chart.
The red arrows indicate the position where the screenshot was captured. It captures the rapid rise section.
The“ currency pairs Best Select indicator allows you to easily identify which pair has the strongest trend among 28 currency pairs. It also tells you, with numbers and colors, whether you should trade now. It is an excellent indicator that lets you judge all currency pairs at a glance.
“28 currency pairs Best Select indicator”
https://www.gogojungle.co.jp/tools/indicators/35128
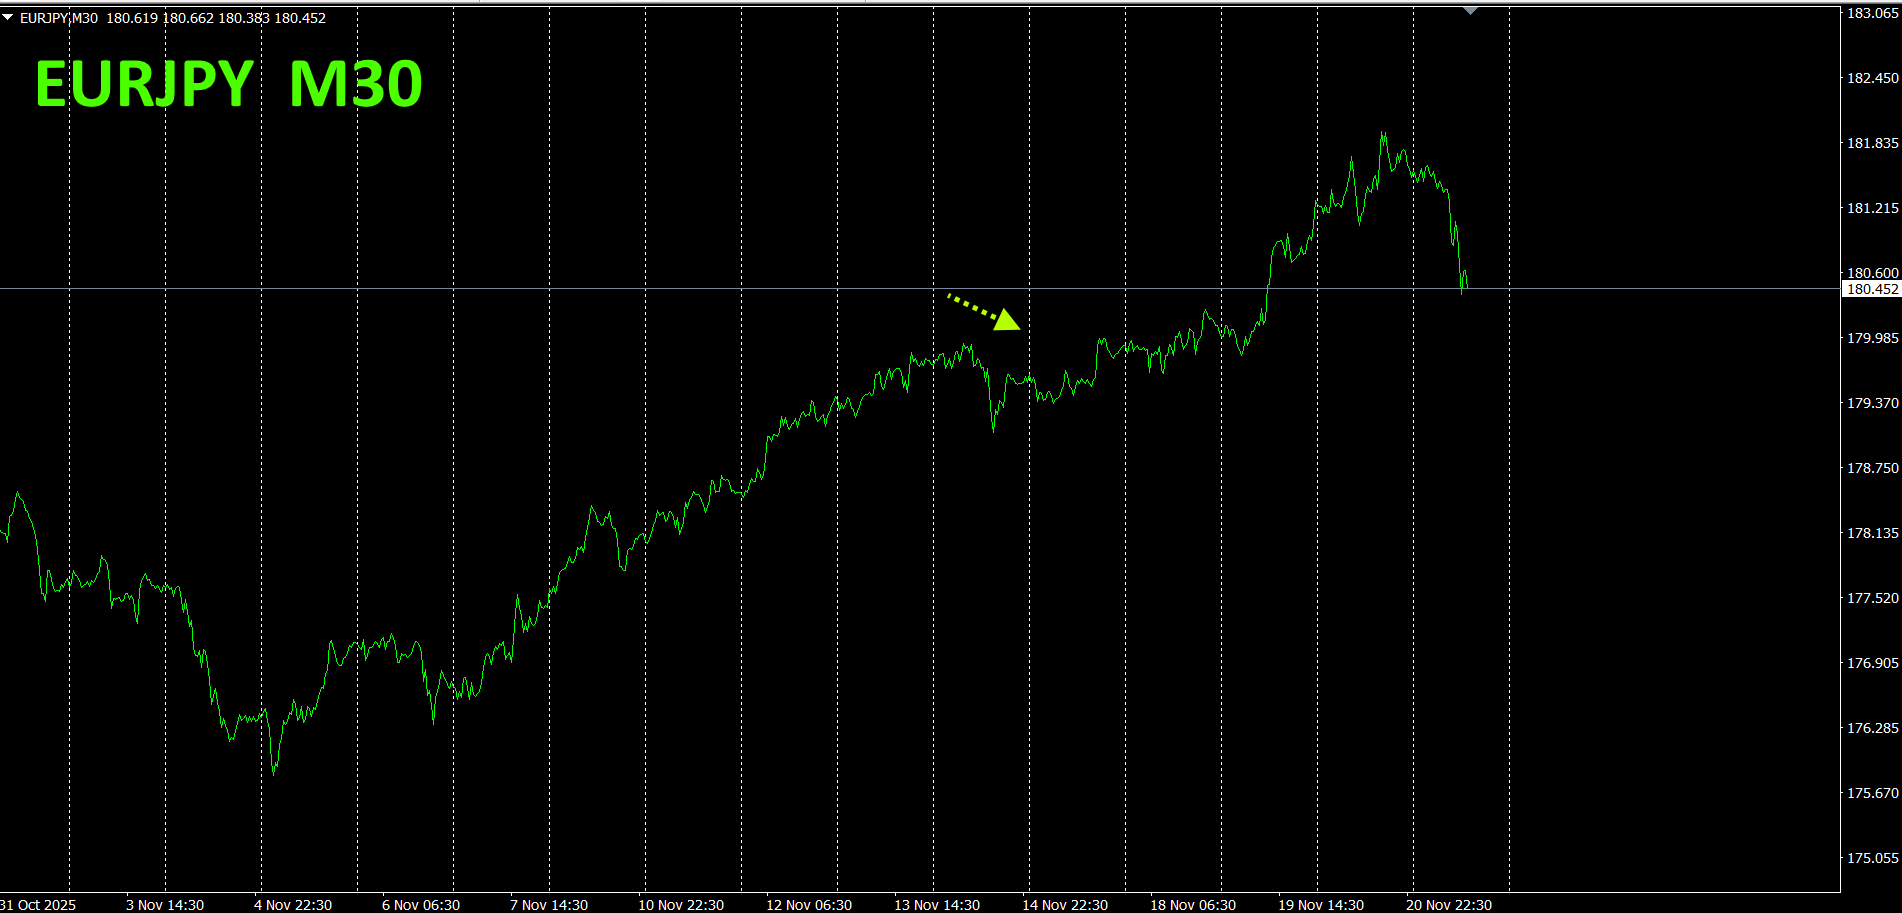
3. 2021 year5 month began tracking EURJPY movement. What happened?
year5 month moved EURJPY movement.
To view the overall trend, a 30-minute chart shows approximately the last30 minutes/ weeks.
Last time, I wrote the following.
Pink showsEUR, green showsJPYEURJPY rise was due to the weakness of theJPY. Looking ahead,EUR. Last week's is slightly down,JPY slightly up, soEURJPY is expected to trend slightly downward.
As predicted, it did not fall; instead it rose.
30 minutes currency strength chart.
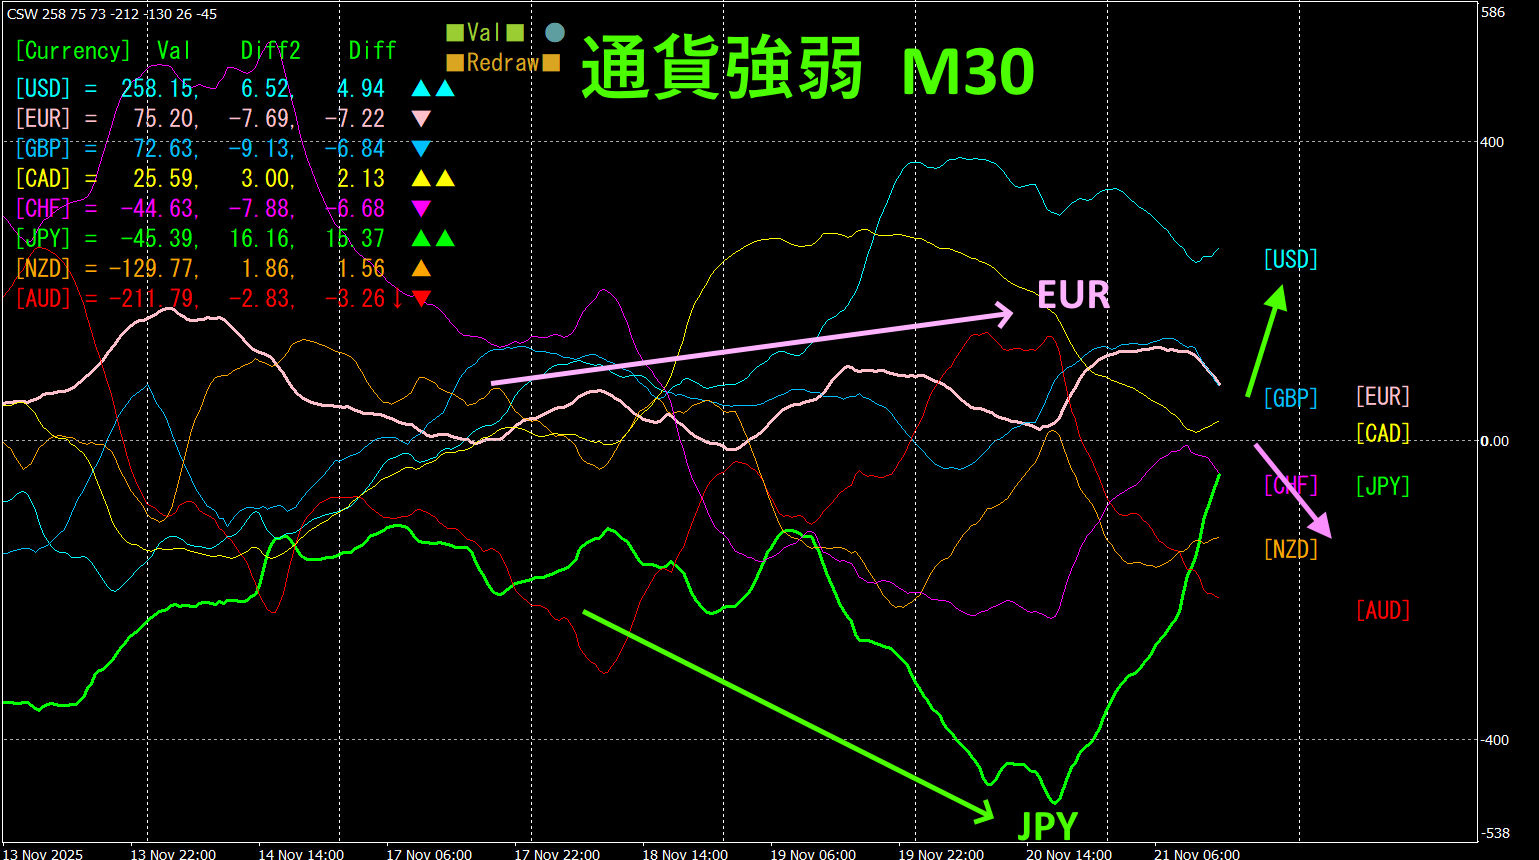
Pink showsEUR, green showsJPY. Last week'sEURJPY rise was due to the weakness of theJPY. Looking ahead,EUR downward,JPY firmly upward, soEURJPY is expected to trend downward.
4.New IndicatorDual_MACD_Trend_Indicator is availablenow
New indicator "Dual_MACD_Trend_Indicator" details below.
MT4 version:https://www.gogojungle.co.jp/tools/indicators/62199
https://www.gogojungle.co.jp/tools/indicators/62202
This indicator clearly indicates the trend direction with colors. If the color bars areLime then buy,Red then sell; it is easy for beginners to use. If the bars are green, uptrend; red, downtrend, and if no color, no trend. Because it uses color display, you can grasp the trend at a glance.
I have introduced this indicator to GBPUSD on the timeframe.
The red sell zone and the green buy zone are clearly separated, making trades easy to execute at a glance. Overall a downtrend, so you only trade sells in the area circled with a white circle in the above image. The point where the indicator color turns red is an ideal selling point. This lets you focus on the part where the trend is about to extend and trade accordingly.
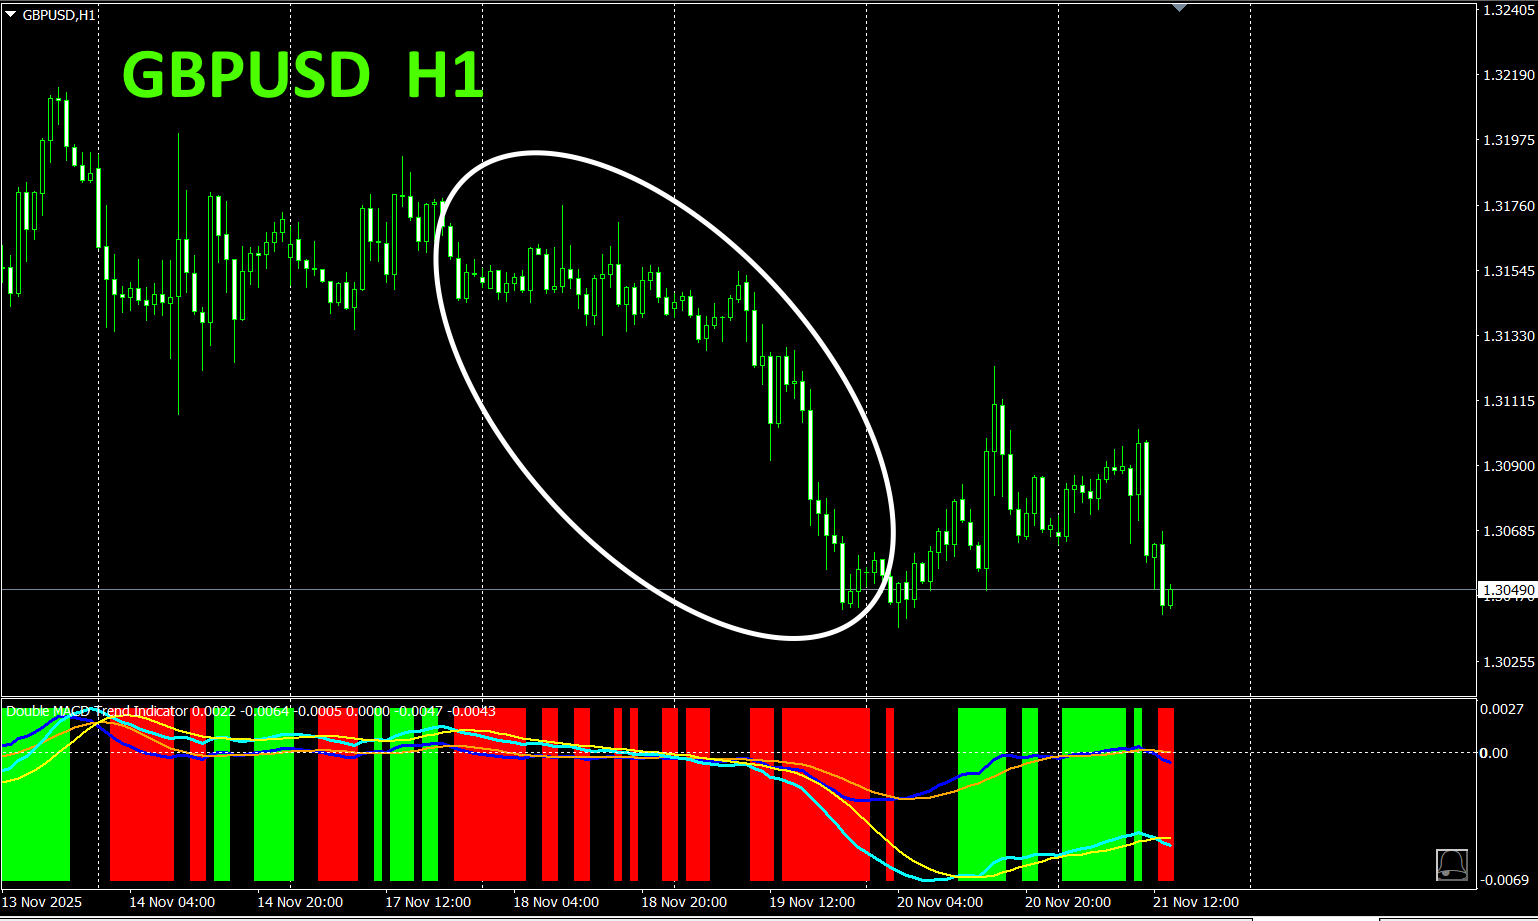
With theDual_MACD_Trend_Indicator, the rule is simple: buy in the green zone, sell in the red zone, and do not trade otherwise.
UsingDual_MACD_Trend_Indicator eliminates any doubt about trade direction.
5.
“Hyper-CSW” has been released
“Hyper-CSW” is a high-performance indicator that visualizes the strength of the eight major currencies at a glance. It records the strongest currency and score in the current timeframe, accurately capturing trend duration and turning points. In addition,,,H1H4,D1,W1 provide multi-timeframe analysis (top4 currencies) with scores. Its highly legible color lines and separate window display empower you to gauge market flow.
For details, see the following link.
https://www.gogojungle.co.jp/tools/indicators/65082
※ Recommended Indicator
“8CFD Visualization IndicatorAny version”
https://www.gogojungle.co.jp/tools/indicators/32288


“Toretore Indicator”
https://www.gogojungle.co.jp/tools/indicators/50115
“TrendLine-EX”
https://www.gogojungle.co.jp/tools/indicators/42257

“8C Currency Strength Visualization Indicator” please refer to the following pages.

version https://www.gogojungle.co.jp/tools/indicators/39150
version https://www.gogojungle.co.jp/tools/indicators/39159
【My Listed Products】


