

【EA版バックテスト公開】1日で+660,000円を叩き出したレンジブレイクEA「Break Hunter」の衝撃実績
Introduction: The “Miracle of a Day” Shown by This EA
To be honest.
When I saw these results, I couldn’t help saying, “Seriously…?”
+660,000 yen in one day. Win rate 93.33%.
Profit Factor 7.72.
Moreover, the logic is ultra simple.
“Draw the range, jump on breakout. That’s all.”
This time, we will publish the backtested results of thisRange Break EA.
Test Conditions
| Item | Content |
|---|---|
| Currency pair | USDJPY |
| Timeframe | M1 (1-minute chart) |
| Period | October 20–24, 2025 (5 days) |
| Initial capital | $200,000 (about 30 million yen) |
| Lot size | 20.0 |
| Spread | 5 pips |
5-Day Total Results
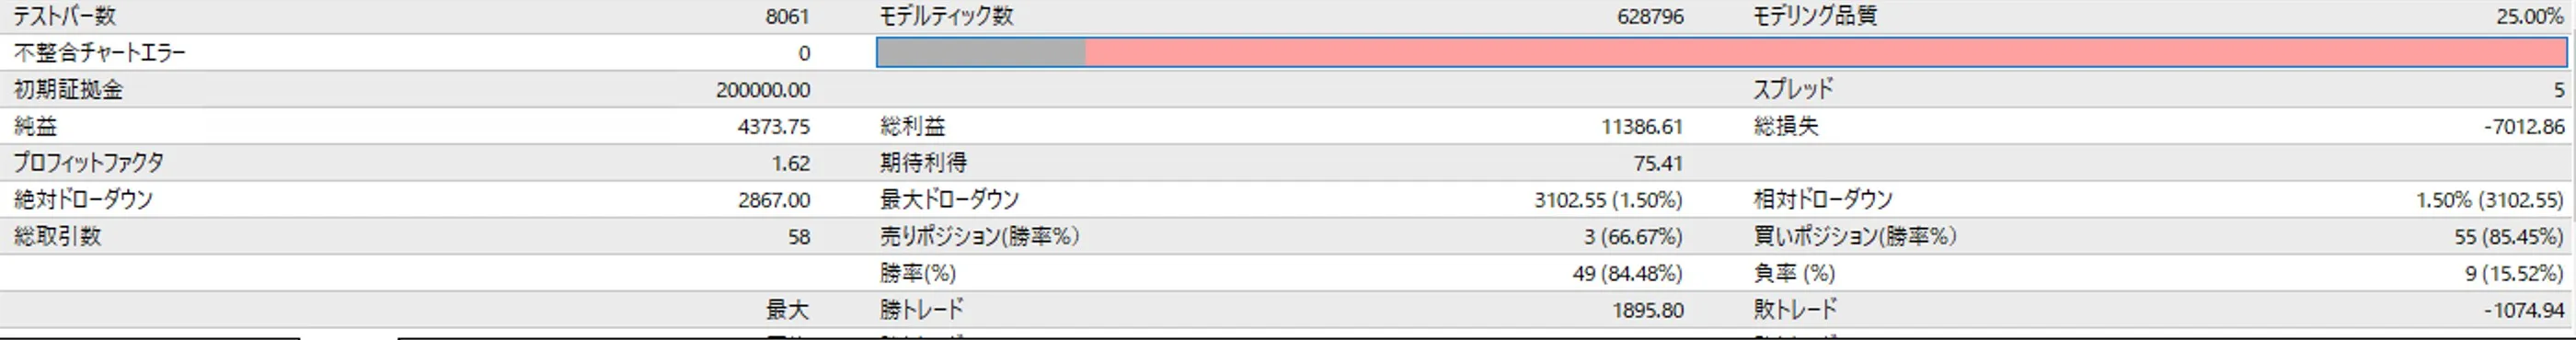
| Item | Value |
|---|---|
| Net profit | +$4,373.75 (about 660,000 yen)✨ |
| Gross profit | $11,386.61 (about 1,710,000 yen) |
| Gross loss | -$7,012.86 (about 1,050,000 yen) |
| Profit Factor | 1.62 |
| Win rate | 84.48% |
| Max drawdown | 1.50% |
| Total trades | 58 trades |
Profit of about 660,000 yen in just 5 days.
A Profit Factor of 1.62 is more than sufficient for a scalping EA.
Logic (Very Simple)
Entry
Calculate the most recent range (highs and lows) → jump on breakout
- Break above → BUY
- Break below → SELL
The essence of range breakout, the king of kings.
Stop loss / Take profit
Stop loss: on the opposite side of the range
- Cut quickly if price moves against you
Take profit: 1.5 times the stop loss
- Stop loss 3 pips → take profit 4.5 pips
- Risk-reward ratio 1:1.5
Protect with break-even stop
- When profits are positive, automatically move stop to break-even
- Prevent “profit then turning to loss”
Time Filter
Operates only from 17:00 to 02:00 Japan time
- The “sweet spot” when European and U.S. markets overlap
- A period of high volatility
Shocking Day: The Miracle of +660,000 yen
Day 2 (October 21) Results
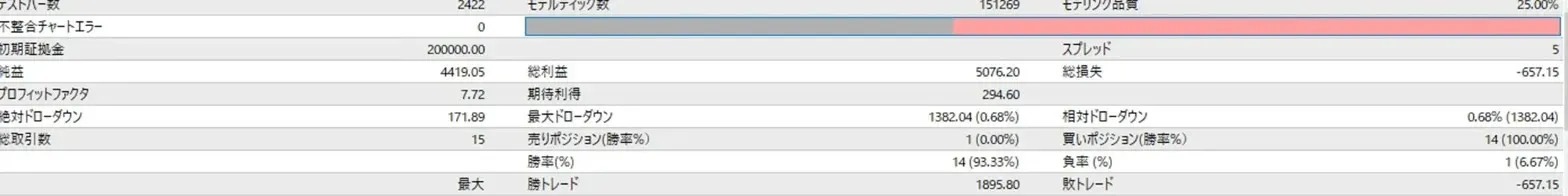
| Item | Value |
|---|---|
| Profit/Loss | +$4,419.05 (about 660,000 yen) |
| Win rate | 93.33% |
| Profit Factor | 7.72 |
| Largest winning trade | +$1,895.80 (about 280,000 yen) |
| Total trades | 15 trades (14 wins, 1 loss) |
Meaning of Profit Factor 7.72:
Even if you lose 100 yen, you’re earning 772 yen.
This is an anomaly. Such numbers are rarely seen in scalp EA.
Why did huge profits occur on this day?
Reason 1: Clear uptrend
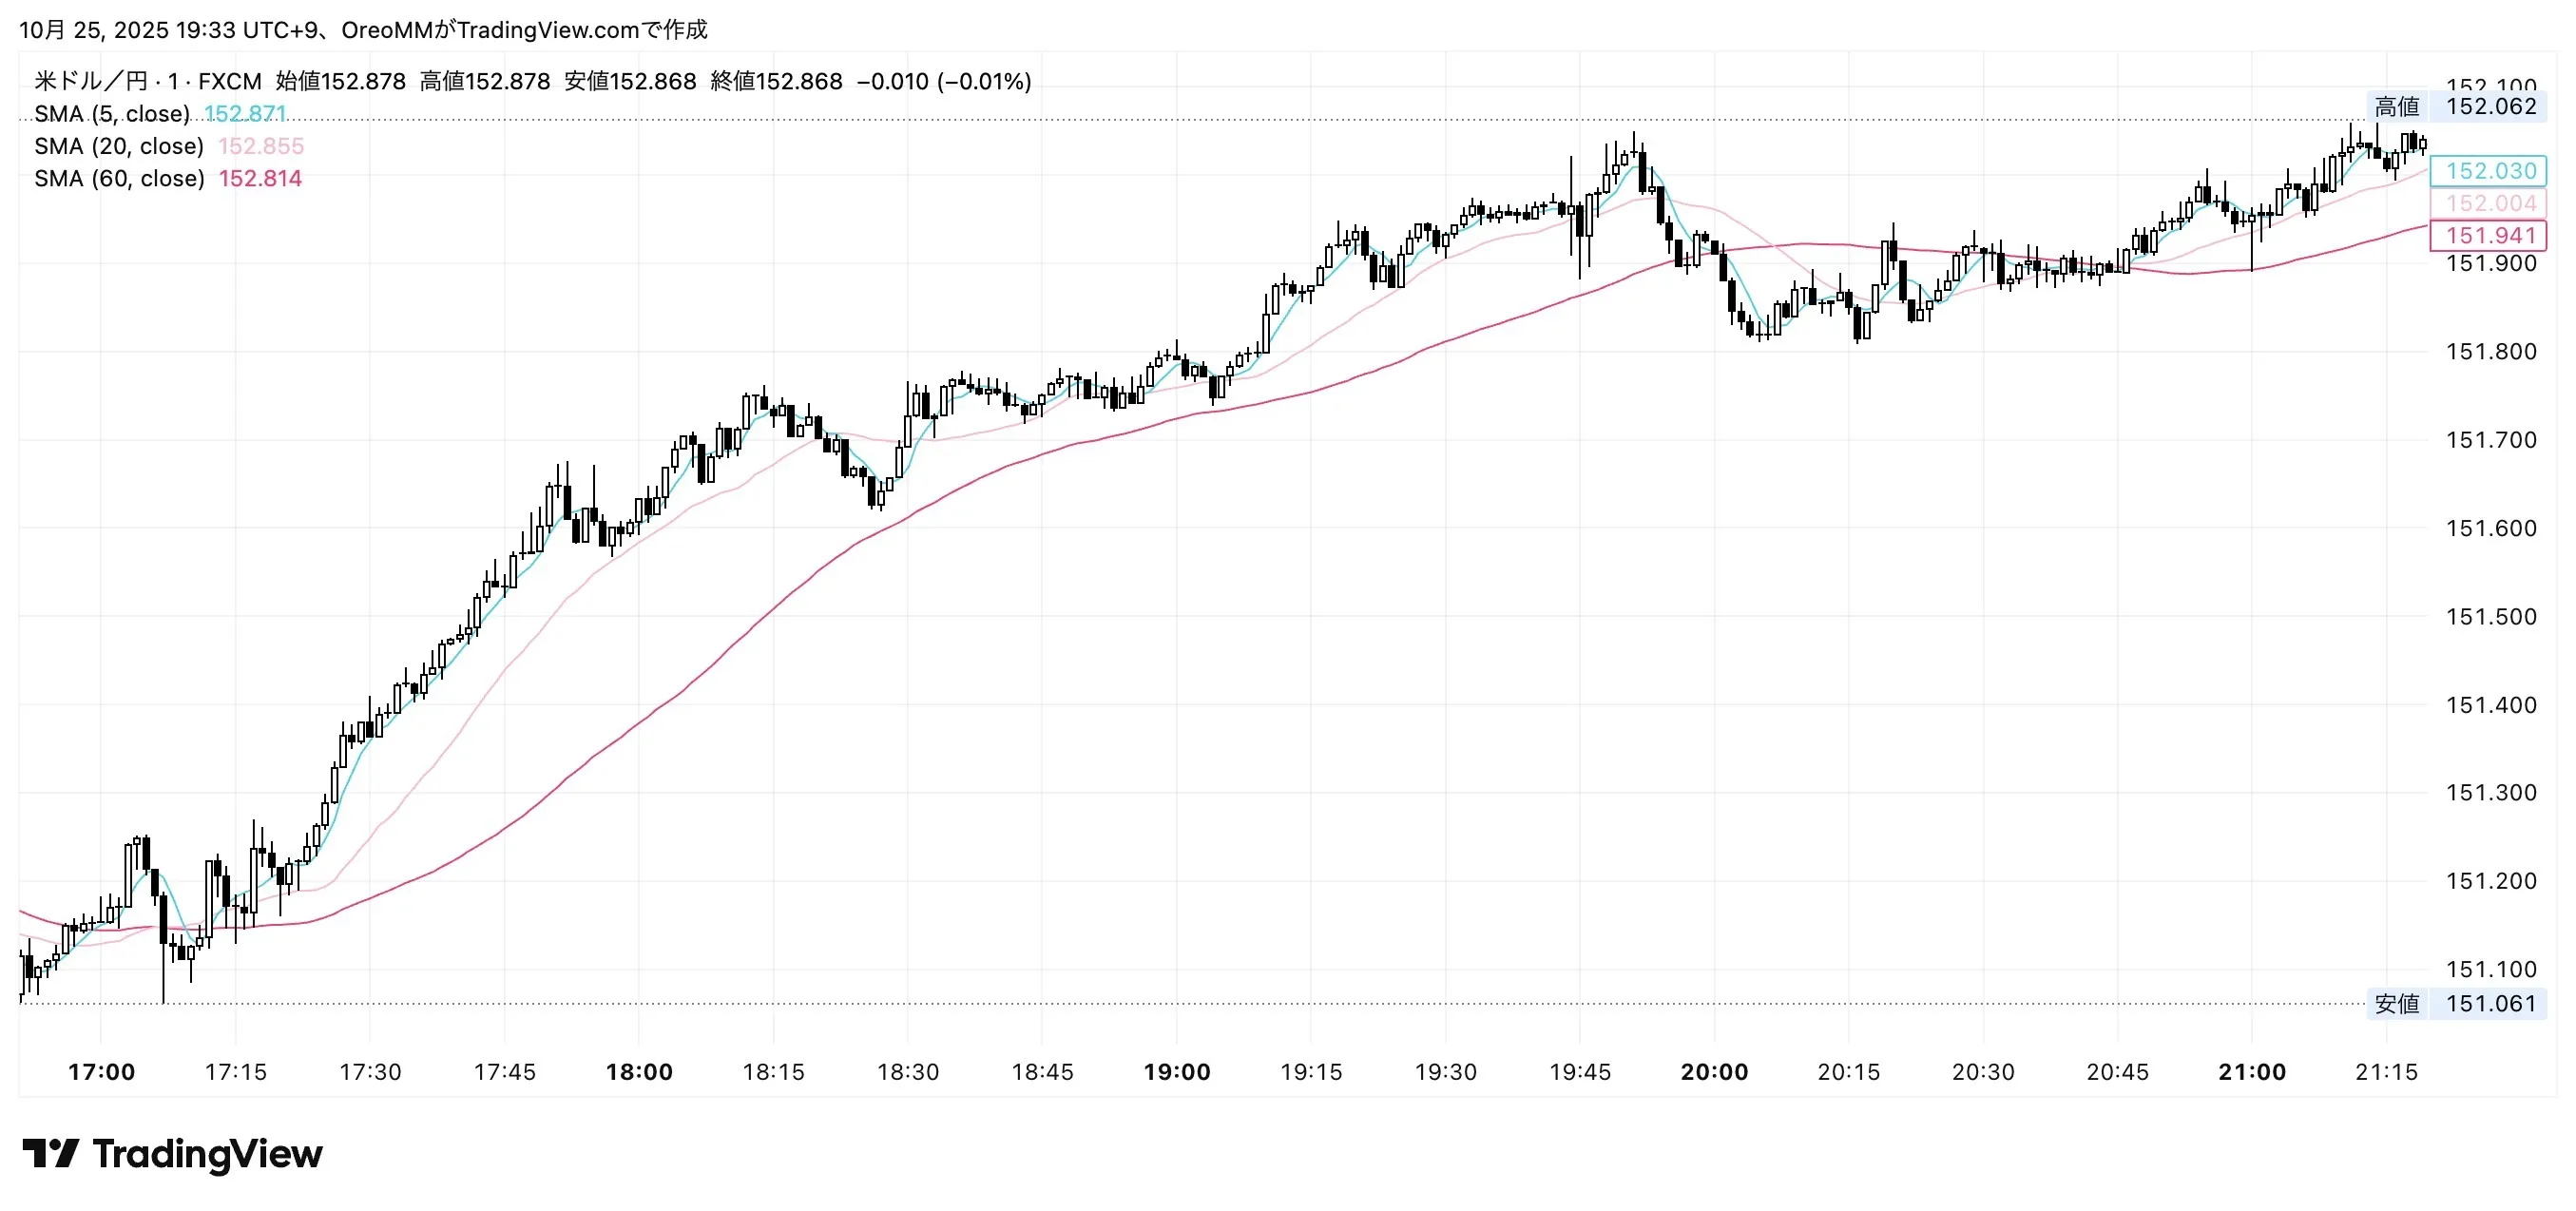
- About 100 pips up in the 17:00–22:00 window
- Ideal environment for a range breakout EA
- Buy entries succeeded one after another
Reason 2: Moderate volatility
- Not too fast, not too slow
- Profit range within what the range calculation can track
Reason 3: Break-even stop function is magical
- After profits accumulate, price continues to move higher
- Protects at break-even while letting profits run
Daily P/L for 5 Days
| Day | P/L | Win rate | PF |
|---|---|---|---|
| DAY 1 | -270,000 | 81.82% | 0.11 |
| DAY 2 | +660,000 | 93.33% | 7.72 |
| DAY 3 | +57,000 | 88.89% | 1.51 |
| DAY 4 | +220,000 | 76.92% | 1.79 |
| DAY 5 | -0.4万円 | 80.00% | 0.99 |
Total: +660,000 yen
Day 2’s huge profit greatly boosted the overall result.
This EA’s Strengths
① Simple, yet strong
No complex indicators at all.
- Range calculation
- Breakout detection
- Break-even stop
With just these, you get +66,0000 yen in 5 days.
Simple is best.
② Unmatched strength in trending markets
When a clear trend emerges, the power is real.
- DAY 2: PF 7.72, +660,000
- DAY 4: PF 1.79, +220,000
Since it’s a trend-following logic, you can ride the trend.
③ Break-even stop is excellent
Move profits to break-even as they accrue.
- Prevents “profit then turn into a loss”
- At worst, zero profit
Reason why the win rate stayed at 84.48% over 5 days.
This EA’s Weaknesses (To be Honest)
Weakness 1: It struggles in highly volatile markets
DAY 1: big loss of -270,000.
- Sudden up-down moves
- Breakouts followed by immediate reversals
- Extreme volatility
This kind of market doesn’t function well.
Weakness 2: A day with losses is possible even with high win rate
DAY 1: win rate 81.82% → -270,000
“Win small, lose big.”
Don’t judge by win rate alone. Profit factor matters more.
What We Can Learn from This EA
① Profit Factor is the key
Look at PF, not win rate.
- PF 1.5 or higher: sustainable long-term profitability
- PF 1.62: excellent
Why Day 1 (81% win rate) lost and Day 4 (76%) won?
② EAs “choose the market”
Markets where this EA works:
- Clear trend
- Moderate volatility
- Few false breakouts
Markets where this EA does not work:
- Sudden upside and downside moves
- Frequent false signals
- Extreme volatility
Understanding market conditions is key to EA operation.
From EA to Indicator
We turned this EA’s logic into an indicator. It’s Sign Indicator
That is, “Break Hunter M1.”

<<1 Hit 1,000,000 yen>> Break Hunter M1 Features
→ Details hereHere
Display signals on the chart with the same logic as the EA
Entry points judged by the EA are shown on the chart with arrows.
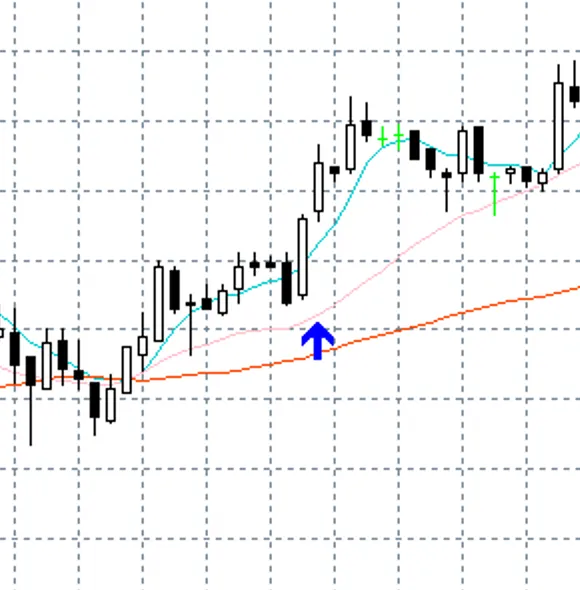
- ? Blue arrow: Buy signal
- ? Red arrow: Sell signal
You’ll be able to see how the EA thinks.
What you can decide
EA version:
- All signals automatically enter
- Cannot choose market environment
Indicator version (Break Hunter M1):
- Look at signals and decide yourself
- Can filter good vs. bad signals
- Flexibly respond to market conditions
“EA strength × discretionary flexibility”
Conclusion
This Range Break EA:
⭐️ 5 days: +$4,373.75 (about 660,000 yen) in profit
⭐️1 day: +$4,419.05 (about 660,000 yen) enormous profit
⭐️Win rate 84.48%
⭐️Profit Factor 1.62
⭐️Ultra-simple logic
has produced this remarkable performance.
And now you can verify that logic with an indicator.
That is,Break Hunter M1.
? Break Hunter M1 details here
Would you like to replicate the EA’s logic with your own hands?
?Break Hunter M1 introductory article here
Display arrows on the chart to experience the EA’s judgment.
⚠️ Disclaimers
This note is based on backtest results. Past performance is not a guarantee of future results. Please operate at your own risk.