

Is that market strong or weak? The Momentum Equalizer (MEQ) tells you in color

~ Visualize market momentum with color: a new analytical approach ~
In FX trading...
- “Is it strong or weak right now?”
- “Where should I target pullbacks/ reversals?”
- “Will the momentum continue, or is a reversal near?”
When there is variability in the speed of decision-making like this, the quality of entries tends to differ accordingly.
Momentum Equalizer (MEQ)is an MT4 indicator designed to intuitively capture market momentum and volatility strength through color.
It is designed to reduce the time spent glued to charts while making market flow easy to understand.
★ Momentum Equalizer (MEQ)
■ What you can understand with Momentum Equalizer (MEQ) (simple explanation)
MEQ expresses momentum changes in 5“Momentum Colors”.
- Strong rise
- Weak rise
- Range without clear direction
- Weak fall
- Strong fall
By simply looking at these 5 color transitions, you naturally see which way the current momentum is leaning and which direction the next scenario is likely to head.
In particular…
- ★ Upward ⇄ downward switching
- ★ Consecutive strong/weak changes
These points of momentum change are visually easy to grasp, making them a powerful aid for trading decisions.
■ Points you can clearly see with MEQ (feature details)
★ Momentum Color (5 levels)
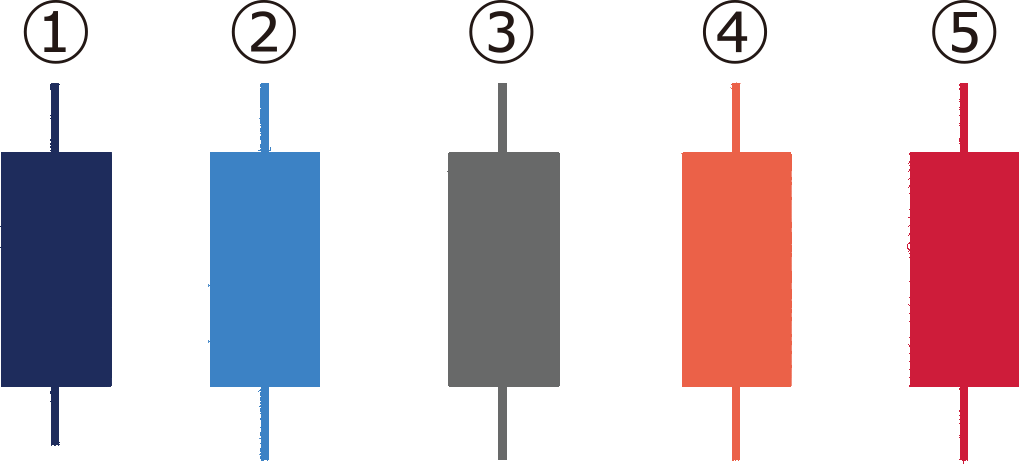
Displays market momentum with a 5-color bar, showing the flow from strong to weak at a glance.
- Is the upward momentum continuing
- Is it weakening and likely to pull back
- Is there signs of a rebound emerging
In either direction, there are times when seeing the “momentum change” makes judgment easier.
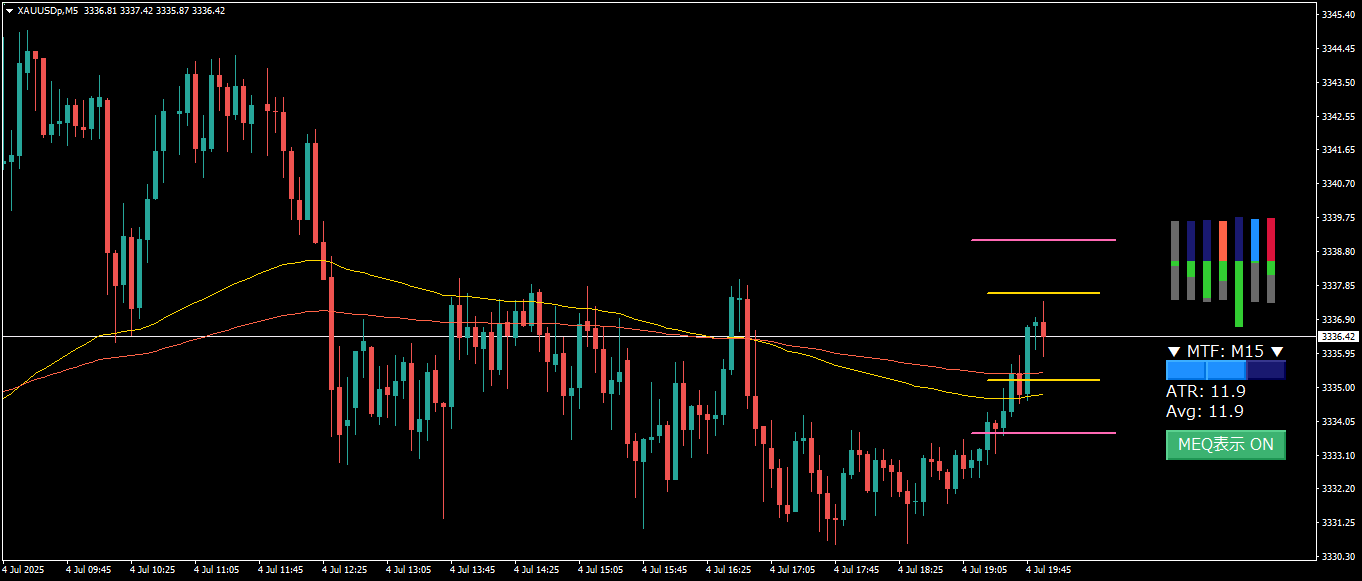
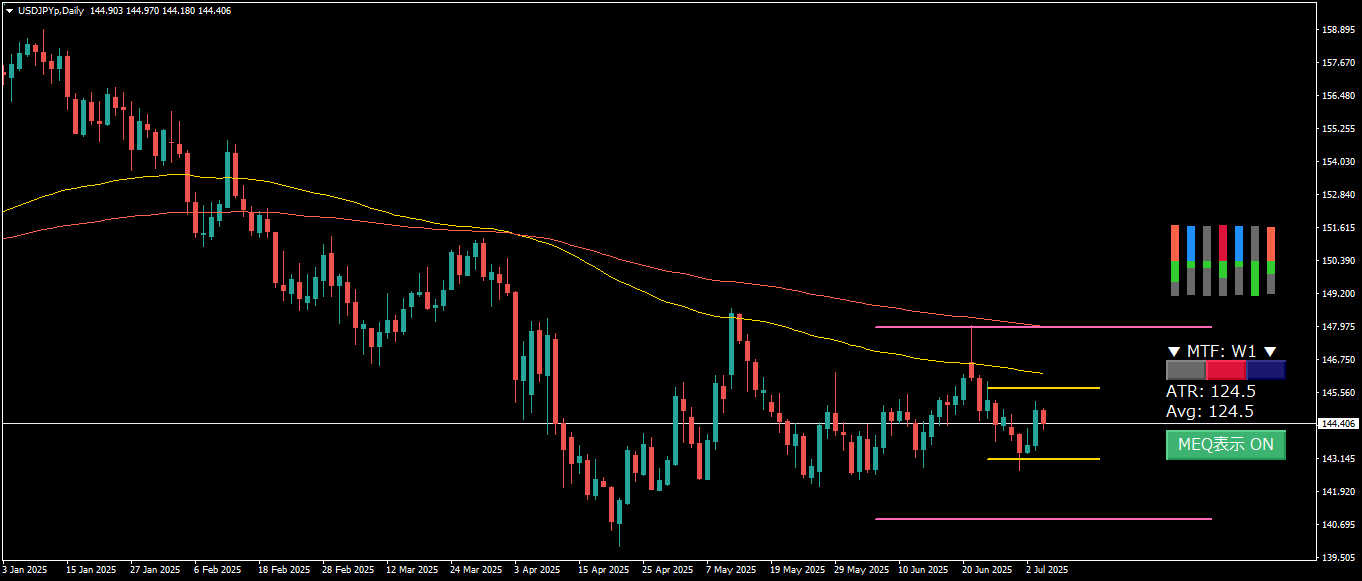
★ MTF (Higher Timeframe) bars

Compactly displays the momentum of higher timeframes in color.
Example: Display M30 on an M15 chart
→ Quickly grasp whether the higher timeframe is strong or weak, helping to align entry direction.
★ ATR (Average True Range) bars
Recent price movement can be visually checked to determine whether the market is prone to “expanding” or “congested,” as a visual aid.
★ AvgPips (Average Pips) bars
Helps identify whether the trend is likely to extend or stall.
- Continue holding
- Take profits early
- Should you stay on the sidelines for now
This makes such decisions easier.
★ Automatic range line drawing
When the range narrows over a period, automatically draws lines indicating the upper and lower bounds of the range.
- Breakout preparation
- Range reversal trading
- Avoiding “false breakouts”
This provides a visible aid for such scenarios.
★ Flexible customization
- Color settings
- Line width and style
- Label position
- Range line drawing threshold
- MTF bar size
Configured to make charts easy to read.
■ Intended usage scenarios
★ “Entry justification is vague and I’m hesitating…” → Instantly grasp strength/weakness with Momentum Color, decide without hesitation.
★ “I don’t know when to take profits…” → Read the market’s peak ahead with the volatility line and take profits at the optimal time.
★ “I miss the impact of higher timeframes and get stopped out…” → Catch the wave of higher timeframes with the MTF bar, making discretionary judgments with more confidence.
★ “I’m being rattled by sudden price moves…” → Visualize the market’s breath, enabling scenario planning that anticipates future movements.
Capture market strength/weakness and its rhythm simultaneously, evolving trading from a “feeling” to a “strategic choice.”
◆ Momentum Equalizer (MEQ) is available for purchase here

Momentum Equalizer (MEQ) Visualization of momentum
https://www.gogojungle.co.jp/tools/indicators/65844?via=users_products
◆ Related indicators
DowWave Marker (DWM) Structure recognition based on Dow Theory (CHoCH / BOS)
https://www.gogojungle.co.jp/tools/indicators/72037?via=users_products
KiriLevelX (KLX) Price range recognition using key levels or levels
https://www.gogojungle.co.jp/tools/indicators/65584?via=search_product