

How the chart looks changes, universal milestone indicator

FX, CFDs, and cryptocurrencies…different by market
Have you ever struggled with the “characteristics of price ranges”?
Each instrument has different interval steps for milestone levels (round numbers), and gold and cryptocurrencies move on a scale that’s almost a different world.
★ What Pips increment should this instrument be set to?
★ The same setting for USD/JPY and gold doesn’t fit at all…
That“annoying dilemma”we developed a solution for「KiriLevelX(KLX)」
A multi-market milestone-specific tool for you.
■ Understand the market by type
KiriLevelX(KLX)’s most notable feature is that it can automatically recognize the market type (FX / stock indices / commodities / crypto).
Examples in representative markets include…
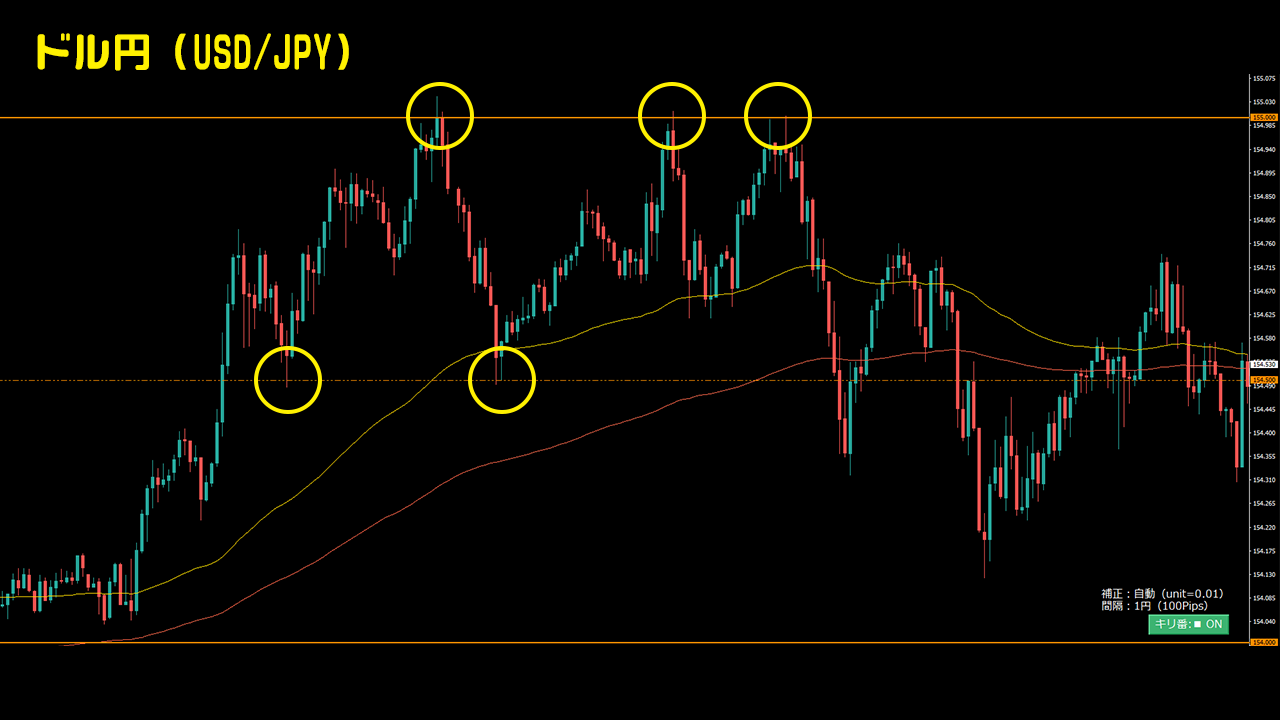
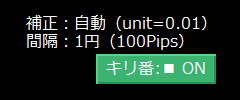
- USD/JPY (FX): want 100 pips (1 yen) increments
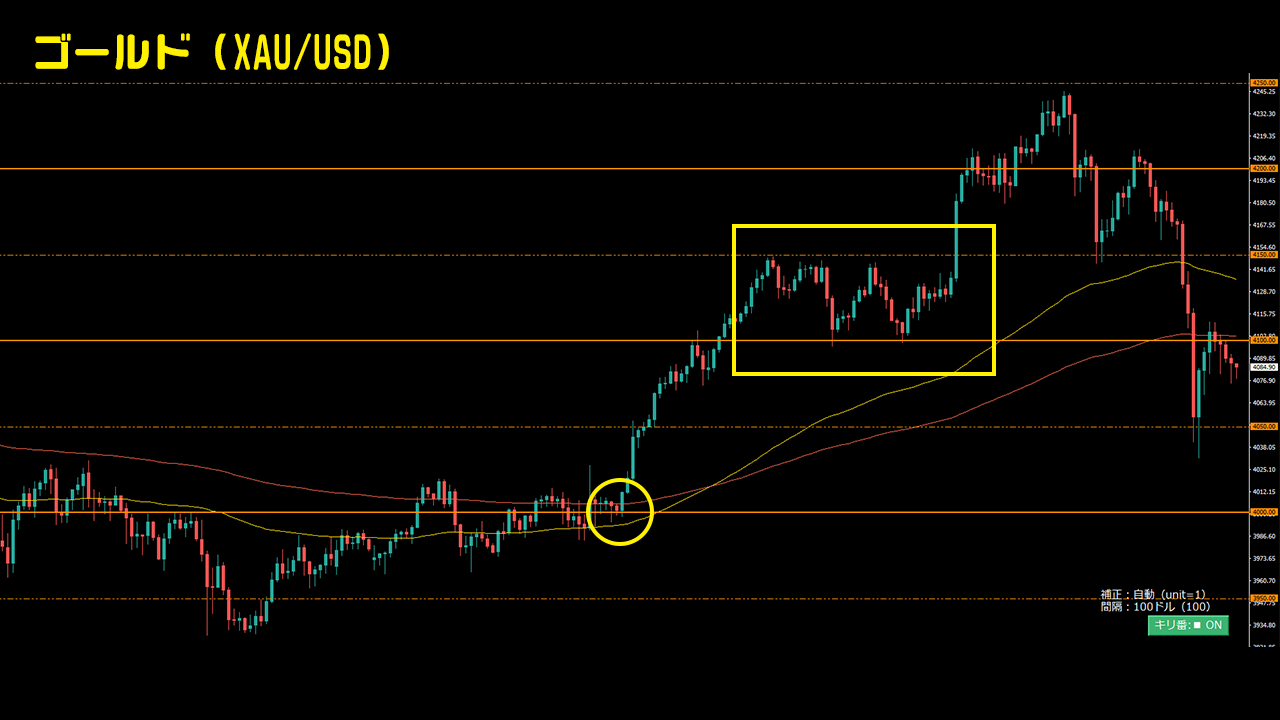
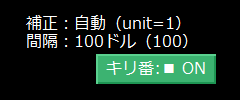
- XAU/USD (gold): want 100-dollar increments
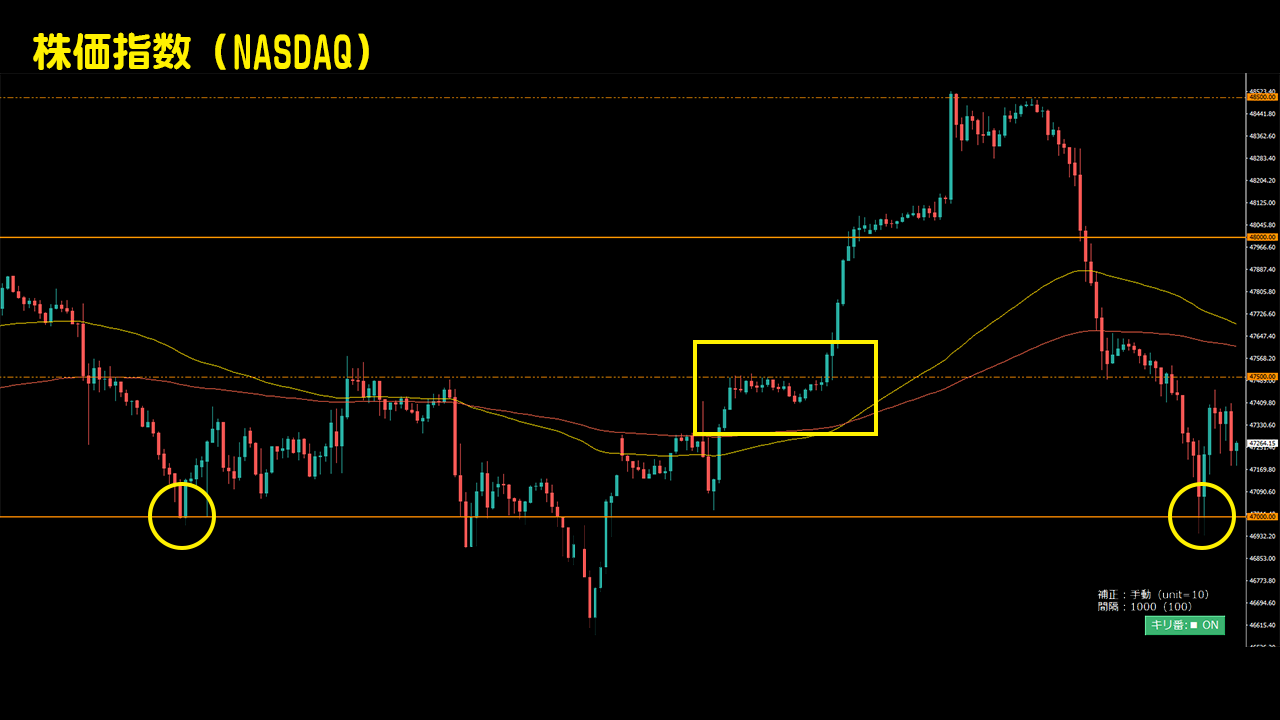
- NASDAQ (stock index): want 1000-point increments
- BTC/USD (cryptocurrency): want 10,000-dollar increments
like this, too…
With conventional “manual pip input” indicators, you had to change settings every time to draw correct lines, which was a hassle.
KiriLevelX(KLX) resolves this by automatically applying the optimal milestone interval for each symbol.
Therefore, after the initial setup, you don’t need to touch anything.
“View FX, then immediately gold, and then crypto…”
This cross-market analysis becomes overwhelmingly smooth.
■ Milestone lines also function powerfully as support and resistance
they are price zones that many traders watch closely.
- Prices tend to stop
- Tend to reverse
- Consolidation often occurs
These“characteristics of levels” can be visualized naturally, so
KiriLevelX(KLX) becomes a strong tool in the following situations.
- Grasping the price levels traders watch
- Identifying zones for dip buying / pullback selling
- Judging profit-taking and re-entry during trends
- Confirming reversal points in ranging markets
By simply adding the milestone indicator to your usual chart,
you canread almost effortlessly where the price is headed.
■ Chart Examples
◆ USD/JPY
Milestones work best, especially around “1 yen,” “5 yen,” and “10 yen” increments where reversals are clearly visible.
KiriLevelX(KLX)automatically extracts these“watched price zones”and makes the reversal zones instantly understandable.
◆ Gold
Gold has wide price moves, and standard pip-based settings can break down.
KiriLevelX(KLX)draws using a gold-specific milestone logic,“though it moves a lot, it’s reacting at key levels”which becomes visually easy to grasp.
◆ Stock Indices
Indices are highly volatile, and choosing interval spacing for lines is difficult.
KiriLevelX(KLX)automatically applies index-appropriate spacing, making range zones and pullback points clearly visible.
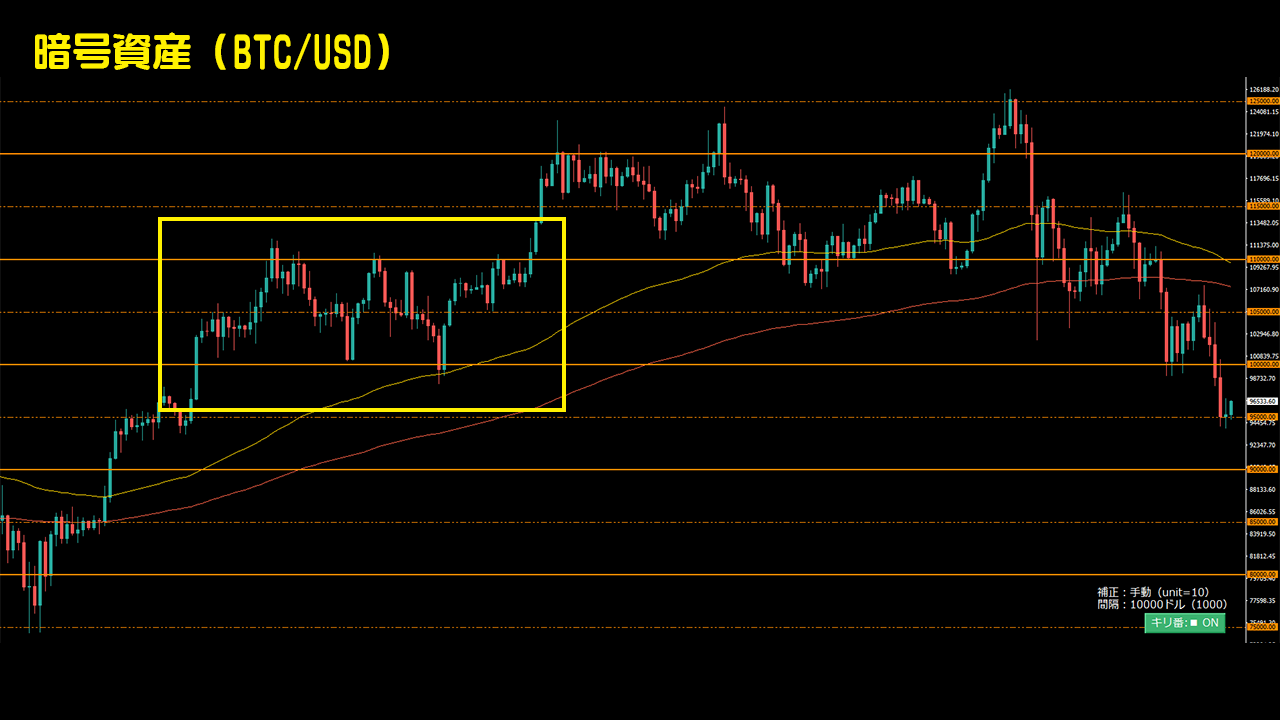
◆ Cryptocurrencies
For cryptocurrencies, each instrument requires a different optimal milestone interval.
In particular, BTC has large price moves, and round numbers in the tens of thousands are strongly watched.
KiriLevelX(KLX)automatically reflects this scale and draws BTC-specific“milestone map”.
■ Auto or manual adjustment OK
◆ Automatic market type detection (AUTO)
Open a chart and it will identify FX / gold / indices / crypto and automatically set the optimal milestone display unit.
◆ Automatic milestone interval adjustment
Automatically calculates a milestone interval that naturally fits the symbol based on the instrument and decimal places.
※ Manual adjustments are also possible.
◆ Toggle button to ON/OFF
Hide with one click in unnecessary situations, ideal for use with multiple indicators.
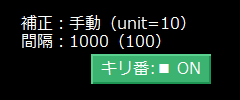
◆ Status label showing current state
- AUTO / Manual判定状態
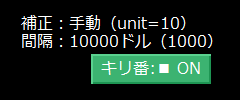
- Unit
- StepSize (milestone interval)
and other real-time displays.
「Dollar-yen display」: Milestone display in yen units

「Gold display」: Milestone display in dollar units
「Stock indices display」: Milestone display in point units
「Crypto display」: Milestone display in point units or dollar units
◆ ATR-based proximity alert
Alerts when approaching or crossing milestones based on ATR, designed not to miss opportunities.
(Supports pop-ups / push notifications / sounds / email alerts)
■ Secondary effects that can be used as a technique
KiriLevelX(KLX) is not a “method indicator,”but because it draws milestone zones where market psychology concentrates
it often serves as support and resistance lines.
★ Rebound at milestones
★ Break at milestones
★ Roll reversal (support → resistance / resistance → support) at milestones
Phenomena like these are frequently seen across various markets.
The following are examples
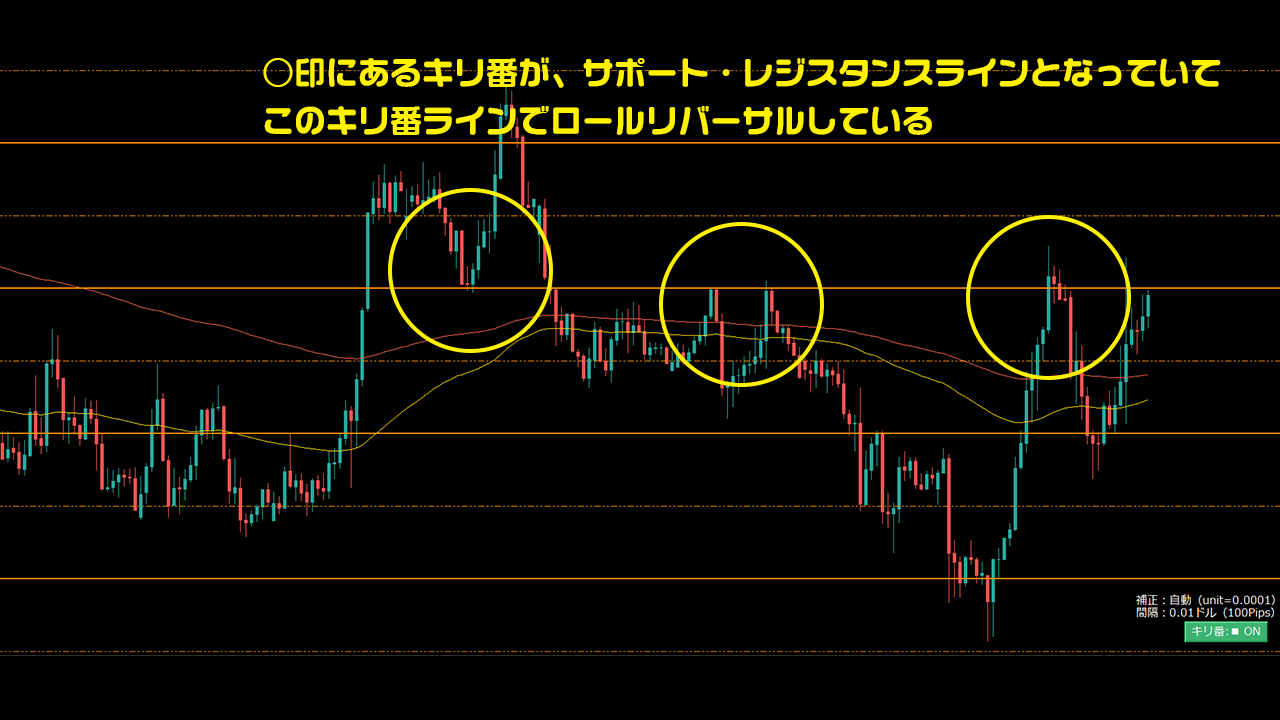
“milestone reactions”can be visually captured,helping determine pullbacks, retracements, and take-profit points.
■ Not a trading method, but infrastructure for environmental awareness
When building a trading scenario, the first need is“a map of the market”
KiriLevelX(KLX)provides that map by“automatically optimizing and drawing it for any market”as a tool.
It benefits traders regardless of their method.
In particular…
- Those who perform multi-timeframe analysis
- Those who move between FX and gold
- Those who also monitor indices and cryptocurrencies
- Those who emphasize SMC, Dow Theory, and line analysis
For such traders, it is exactly a“foundation” indicator.
◆ You can purchase “KiriLevelX(KLX)” here

KiriLevelX(KLX)
https://www.gogojungle.co.jp/tools/indicators/65584?via=search_product
◆ Related indicators
DowWave Marker(DWM)
https://www.gogojungle.co.jp/tools/indicators/72037?via=users_products

Momentum Equalizer(MEQ)
https://www.gogojungle.co.jp/tools/indicators/65844?via=users_products