

Session 4 Random Walk and the Truth of Foreign Exchange
■ 1. The World of Random Walks Is Basically “Pluses and Minuses Zero”

First, as a premise,
in a world where prices move completely randomly, waiting long yields nothing and loses nothing either. This is like rolling a die many times and
on average the outcome is 3.5. Whether it goes up or down is fifty-fifty. So on average it is ±0.
This is the “world of expectation value 0.”
■ 2. But Foreign Exchange is not that simple

This is the important part. The foreign exchange (Dollar-Yen), is not completely random.
In the real world—
-
when it overshoots, it tends to revert
-
rapid fluctuations are restrained
-
companies and investors pull prices back
-
policies also move
-
the trade balance also matters
these are the “real forces” at work.
For example, if the USD/JPY runs to 180 or 200,exporting and importing firms will act, andcentral banks may intervene, thinking “that was too much.”
Conversely, if USD/JPY falls to 100 or 80,the U.S. side won’t stay silent. In other words,
the exchange rate tends to move back toward a normal level when it overshoots,i.e.,
This is mean reversion.
■ 3. If Mean Reversion Exists, what does that mean for us?
With a random walk,
it is common to drift away without ever hitting a take-profit line.
But with mean reversion, things change.
● Looking at the OU process model...
In the OU (Ornstein–Uhlenbeck) process, which formalizes the pull back toward the mean,
-
when away from the mean,
→ a force pushes back toward the mean -
when near the mean,
→ it stabilizes
this is the behavior.
By this,
★ The probability of returning to the take-profit line actually increases
In other words,
small profits can be quite realistically captured
because, for a random walk, while prices eventually revert, they can drift arbitrarily far away, making the expectation zero.
■ 4. Is it true that “if you wait, you’ll probably hit take-profit”?

To avoid misunderstanding, let me explain with a model.
The stronger the mean-reverting tendency,
the stronger the pull back toward the mean
and thus the more likely it is to touch the take-profit line
that is certainly true.
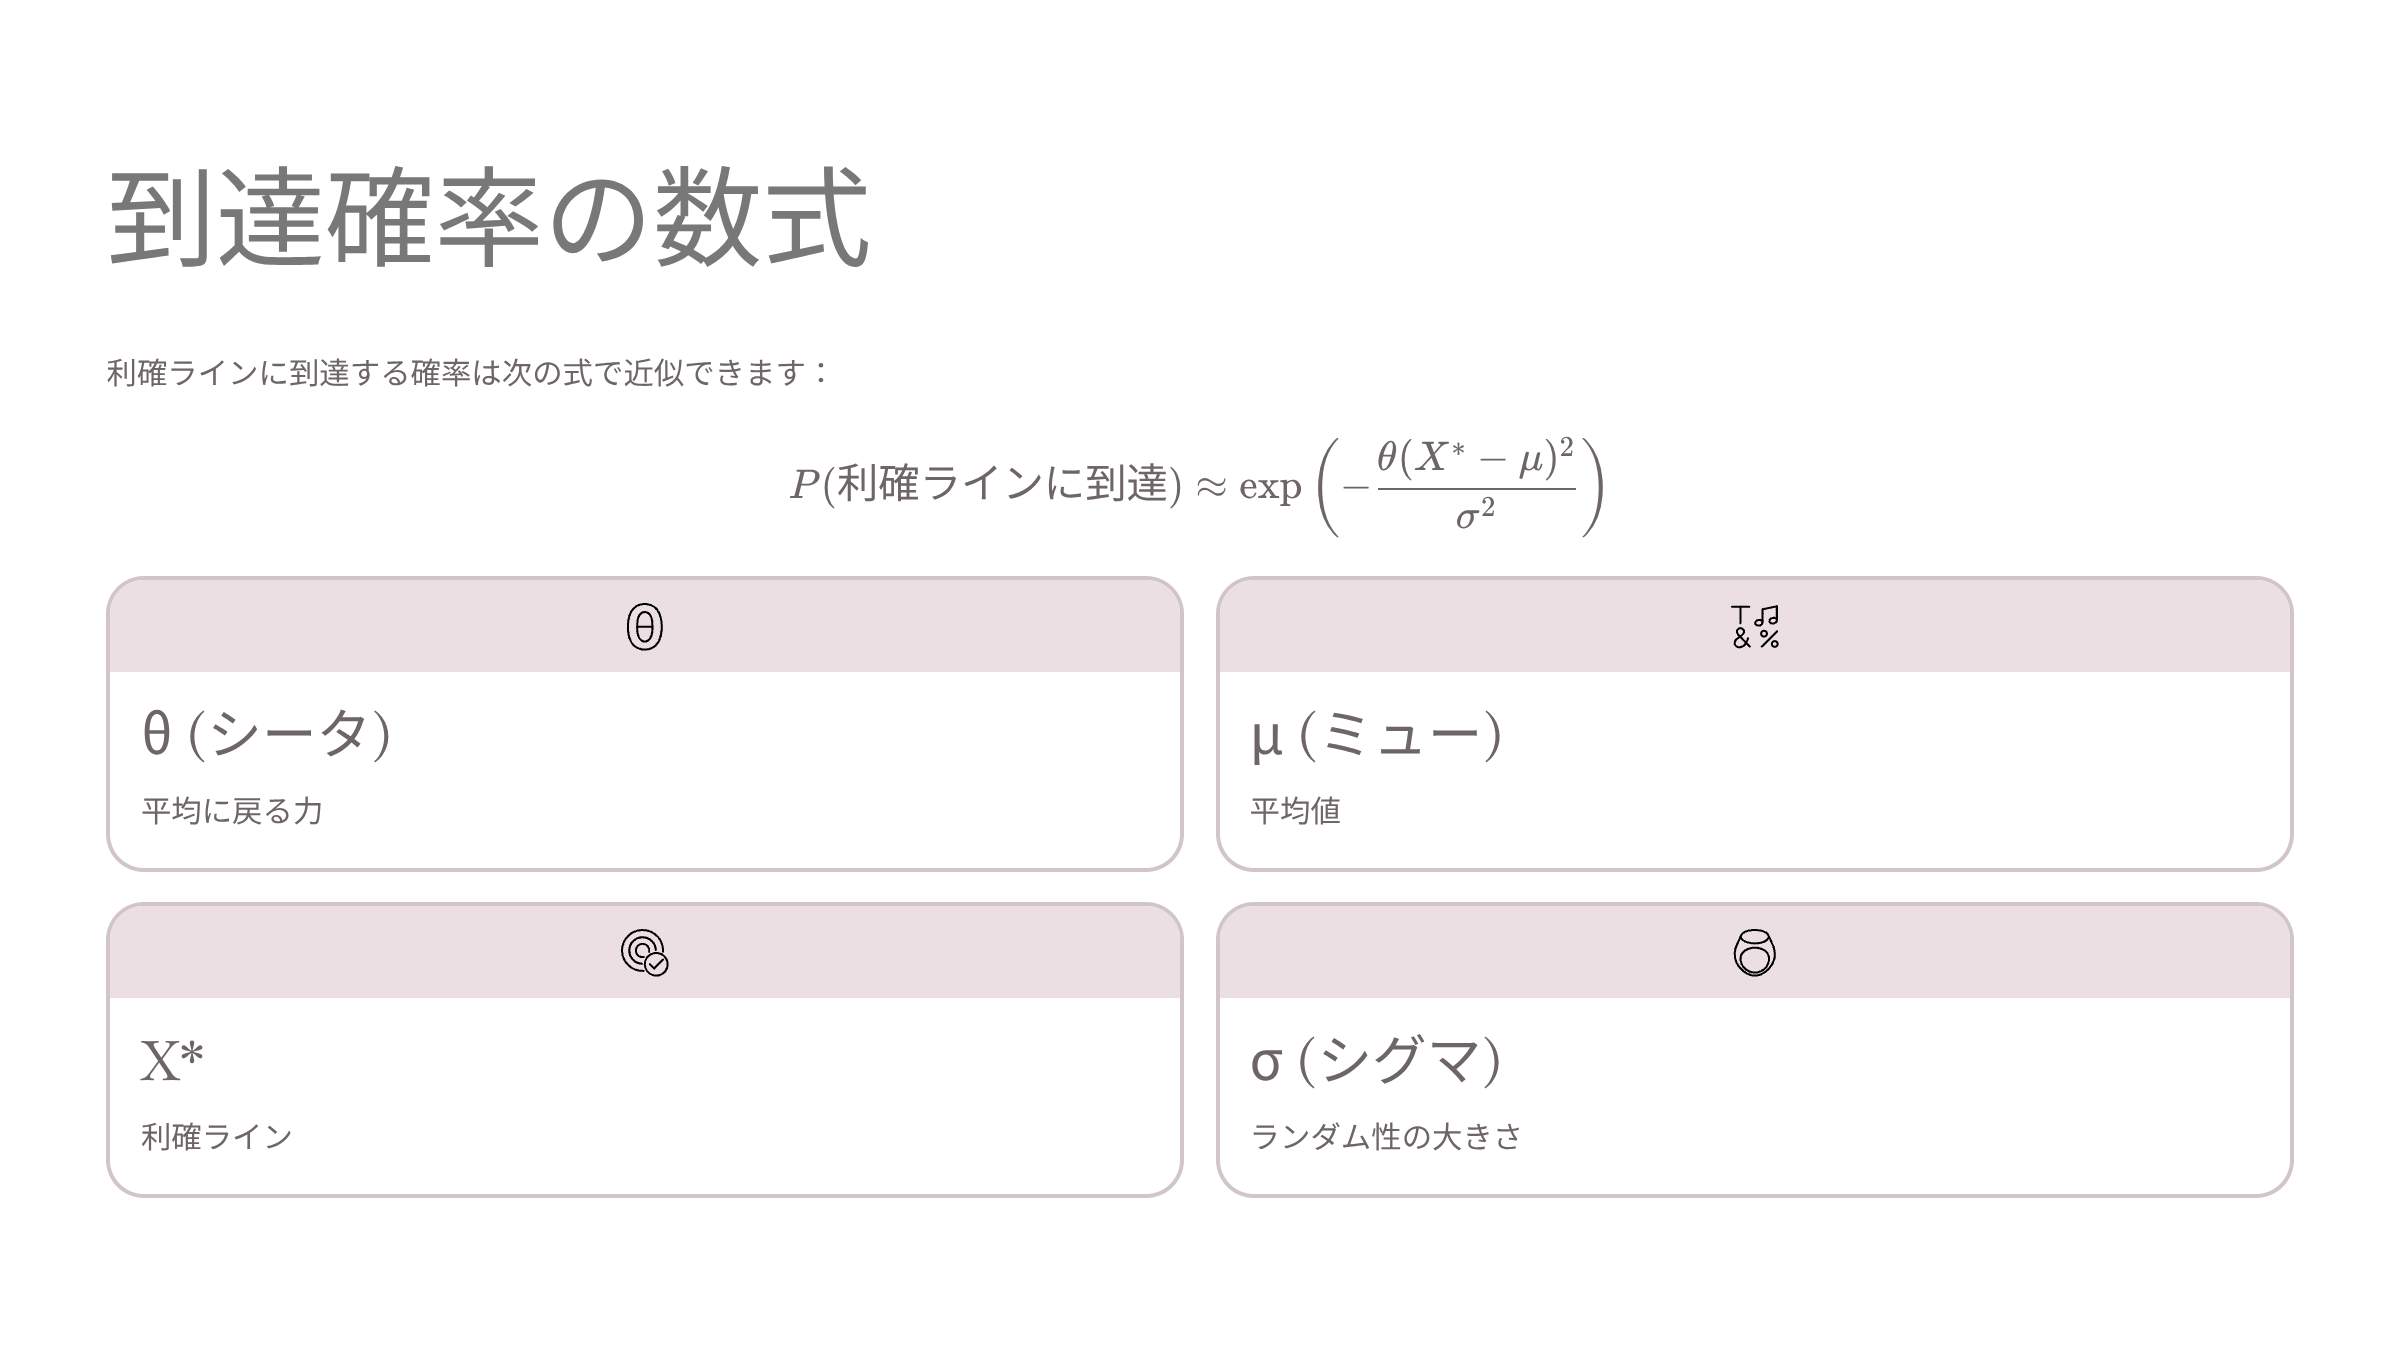
The hitting probability of the OU process can be approximated by the following formula:
Here,
: mean-reverting force
: mean value
: take-profit line
: magnitude of randomness
.
■ 5. In reality, what happens to the expected value?

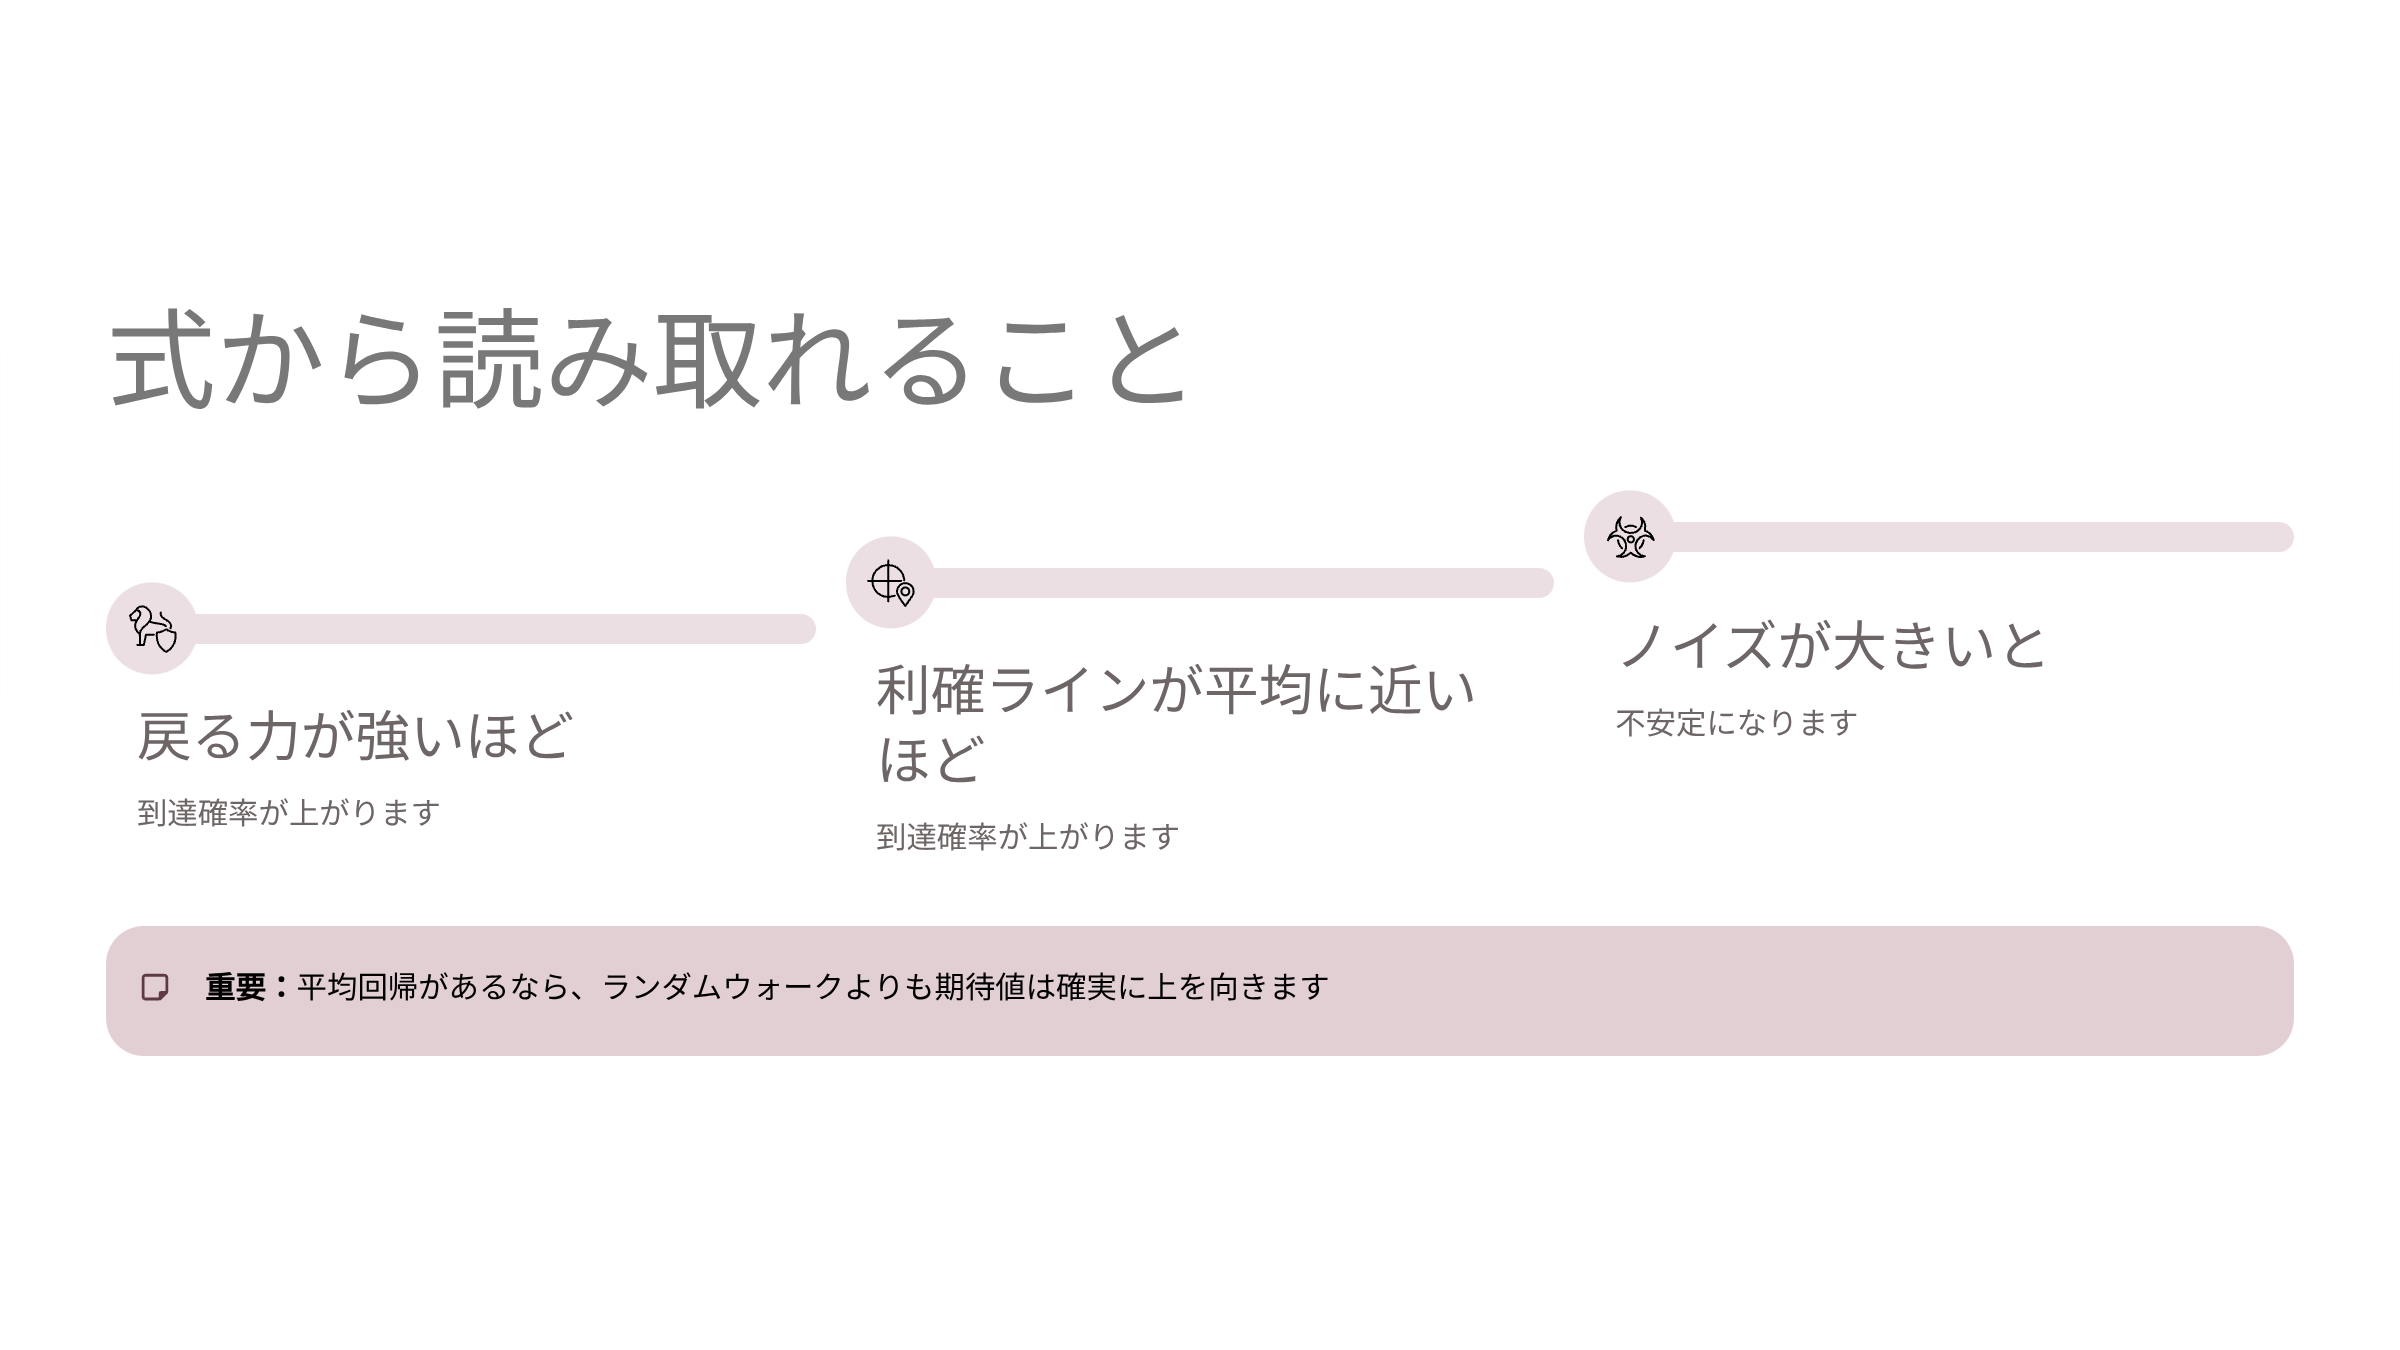
What this formula tells us:
the stronger the pull back toward the meanis, the higher the probability of reaching it
the closer the take-profit line is to the mean, the higher the probability of reaching it
the larger the noise, the more volatile it becomes
And this is the crucial point.
★ If mean reversion exists,
★ the expected value will be higher than in a purely random walk
Set the take-profit width as,and using the above probability of reaching it,
to be.
In a pure random walkso,
the above expression tends to 0, and the expectation tends to 0.
But with mean reversion,
★becomes greater than 0
★ Therefore the expected value tilts above 0
as a natural story.
In other words,
Mean reversion is a real weapon that pushes up the expectation for small take-profits
and this is the main point of this discussion.
Here is the core takeaway of this installment.
■ Summary of Part 4
-
In a random walk, the expectation value is 0 no matter what you do
-
Actual FX has a “mean-reverting force” at work
-
This can be explained by real-world forces such as companies, psychology, and policy
-
When modeled, it takes the form of an OU process
-
Mean reversion increases the probability of touching the take-profit line
-
Therefore there is room for the expected value to be above zero
■ Preview for Next Time (Part 5)
Next time,
we will compare visually with graphs 5000 periods of simulations while varying the strength of mean reversion
and visually compare them in graphs.