

RCI_ZigZag Rapid Profit's appeal
Why is the combination of “RCI” and “ZigZag” effective? A thorough explanation of the魅力 of the signaling tool
Many traders try to identify two important elements in daily analysis: the direction of the trend and the timing of entries. However,
it’s not easy to grasp these two simultaneously and accurately.
* If you only look at timing indicators (oscillators), you may go against large trends and incur losses.
* If you only look at trend indicators, you may understand the general direction but miss specific entry points, leading to missed opportunities or entering at unfavorable prices and
getting into trouble.
The signaling tool “RCI_ZigZag” explained here adopts a practical and effective approach by combining two indicators with different characteristics to solve this universal challenge.
1. Roles of each indicator
First, let’s understand the basic roles of the two indicators that compose this tool.
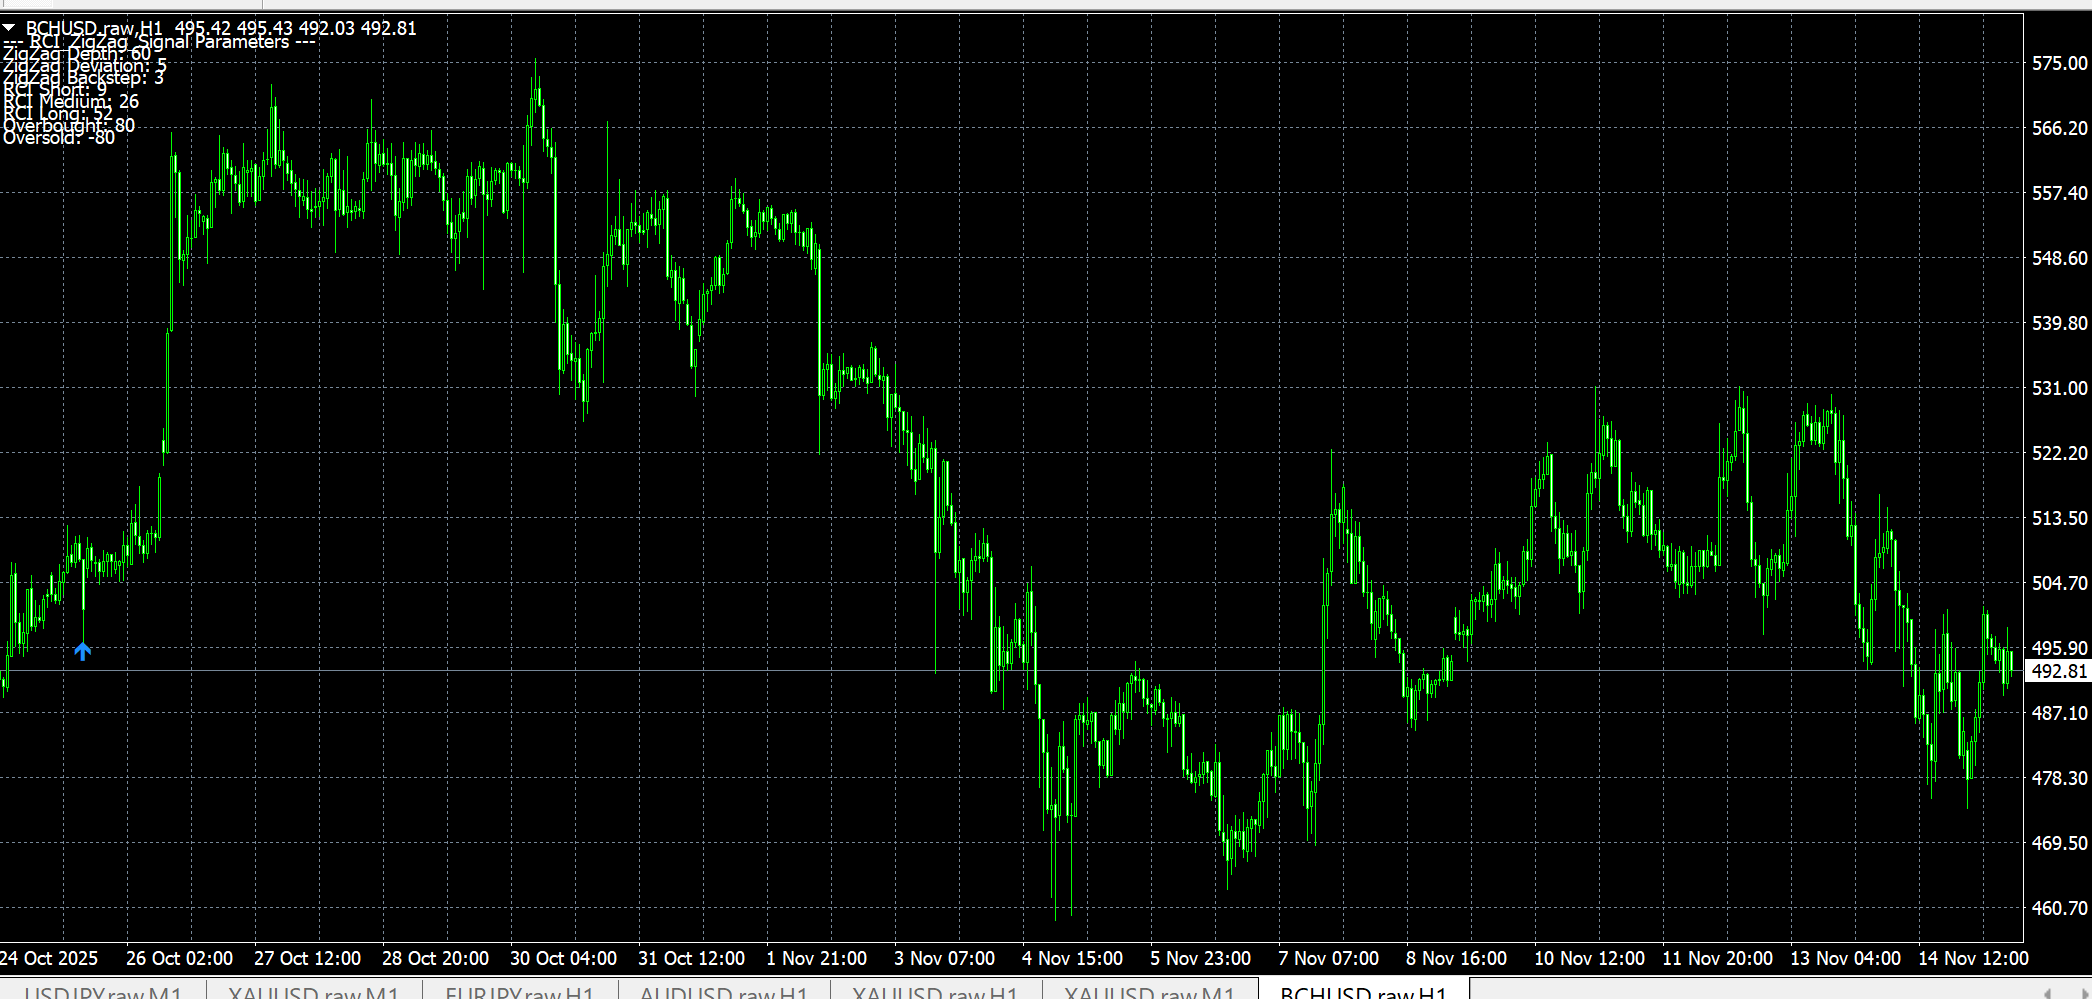
* ZigZag: visualizes the market’s “skeleton”
ZigZag connects price movements of a specified magnitude with a line, clearly highlighting important highs and lows on the chart. This removes minor price noise, allowing a visual grasp of the market’s major waves and trends—its “skeleton” or structure.
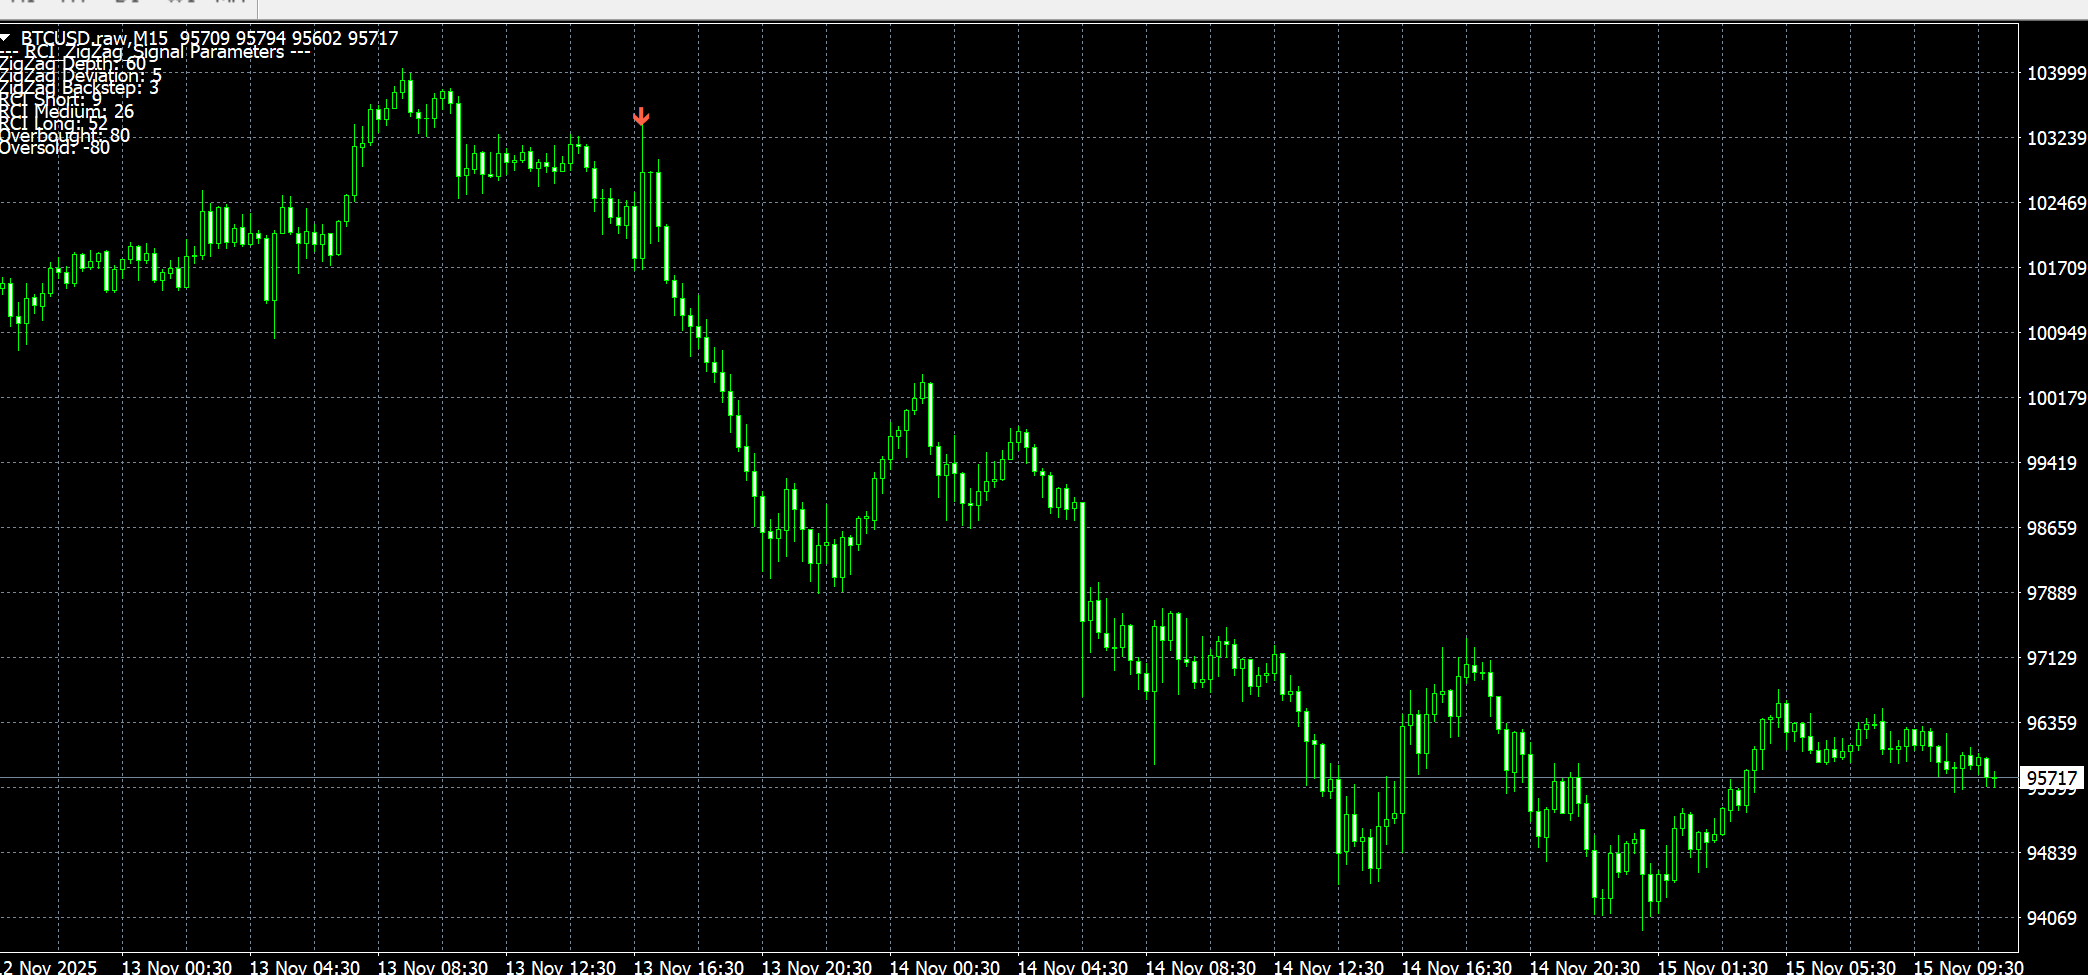
* RCI: measures the market’s “excitement”
RCI (Rank Correlation Index) is an oscillator that calculates the ranking of time and price over a certain period to determine whether there is a clear trend in the market or an overheated condition such as “overbought” or “oversold.” It is especially effective at pinpointing reversal timing.
2. Synergistic effect from the combination
The greatest appeal of “RCI_ZigZag” lies in the synergistic effect produced by combining these two indicators. Signals are generated only when the following two conditions are met.
1. Structural condition:
First, ZigZag confirms an important high or low. This indicates a point where a major market wave could reverse, not just a minor up and down movement.
2. Timing condition:
Next, at the turning point indicated by ZigZag, the RCI moves out of the overbought (+80 or higher) or oversold (−80 or lower) region.
This means catching the moment when market participants’ psychology returns from an overheated state to normal, i.e., a moment when the momentum of a reversal is likely to emerge.
With this logic, the tool automatically filters out dangerous contrarian signals such as “RCI shows oversold but ZigZag trend is still downward.” It also allows traders to skip entries in uncertain situations like “ZigZag has bottomed but there is no rebound momentum yet.”
In other words, you can target only highly reliable points where both the “structure” and the “timing” have converged as a basis for entry.
3. Adjustments to fit trading style
This tool can adapt to various trading styles by adjusting its settings.
* High win rate, cautious style:
A model applying stricter conditions (e.g., alignment of direction across multiple RCI periods) reduces signal frequency but increases the reliability of each signal. It is suitable for traders who want to wait for high-probability opportunities.
* High-frequency, aggressive style:
A model with relaxed conditions captures more signals. This is suitable for active traders such as scalpers and day traders who aim to seize small opportunities and conduct many trades.
Conclusion
The appeal of “RCI_ZigZag” lies not just in displaying two indicators simultaneously, but in logically linking the two key elements of trading—market structure and entry timing—to enhance entry advantage.
This allows traders to reduce emotionally driven, unreliable entries and build a consistent trading rule with strong support. I hope this tool will help make your trading more logical and precise.
. I hope this tool will help make your trading more logical and precise.