

〜Visualize the Trend Waves with Dow Theory Indicator〜 DowWave Marker

〜 Dow Theory Indicator that Visualizes the Trend Wave 〜
When trading「I want to know exactly where the trend changes」 or「I want to confidently enter pullbacks and buy the dips / pullbacks」, many traders struggle.
Dow Theory itself is simple, but on actual chartsit’s easy for swing identification and for highs/lows to become ambiguous, which presents a challenge.
Therefore,「If there were a tool that lets you know the current market structure (trend wave) the moment you look at the chart」, I thought,
「It should be easy for beginners to understand」, and so I developed it as…
◆ DowWave Marker (DWM)
■ Overview of DowWave Marker (DWM)
DowWave Marker (DWM) is an indicator that automatically detects Dow Theory’s CHoCH (change of character) and BOS (break of structure).
Through swing analysis based on ZigZag, it clearly depicts trend reversals and continuations on the chart.
◆ Main Features
- High-precision swing analysis based on ZigZag
- Real-time detection of CHoCH (change of character) and BOS (break of structure)
- Visually supports both trend following and reversals
- Watching (monitoring line) displays the next branching point in advance
- Pullback line clarifies dip-buy and pullback-sell points
This solves「I studied Dow Theory, but on charts I still get lost…」 and aims to address it on actual charts.
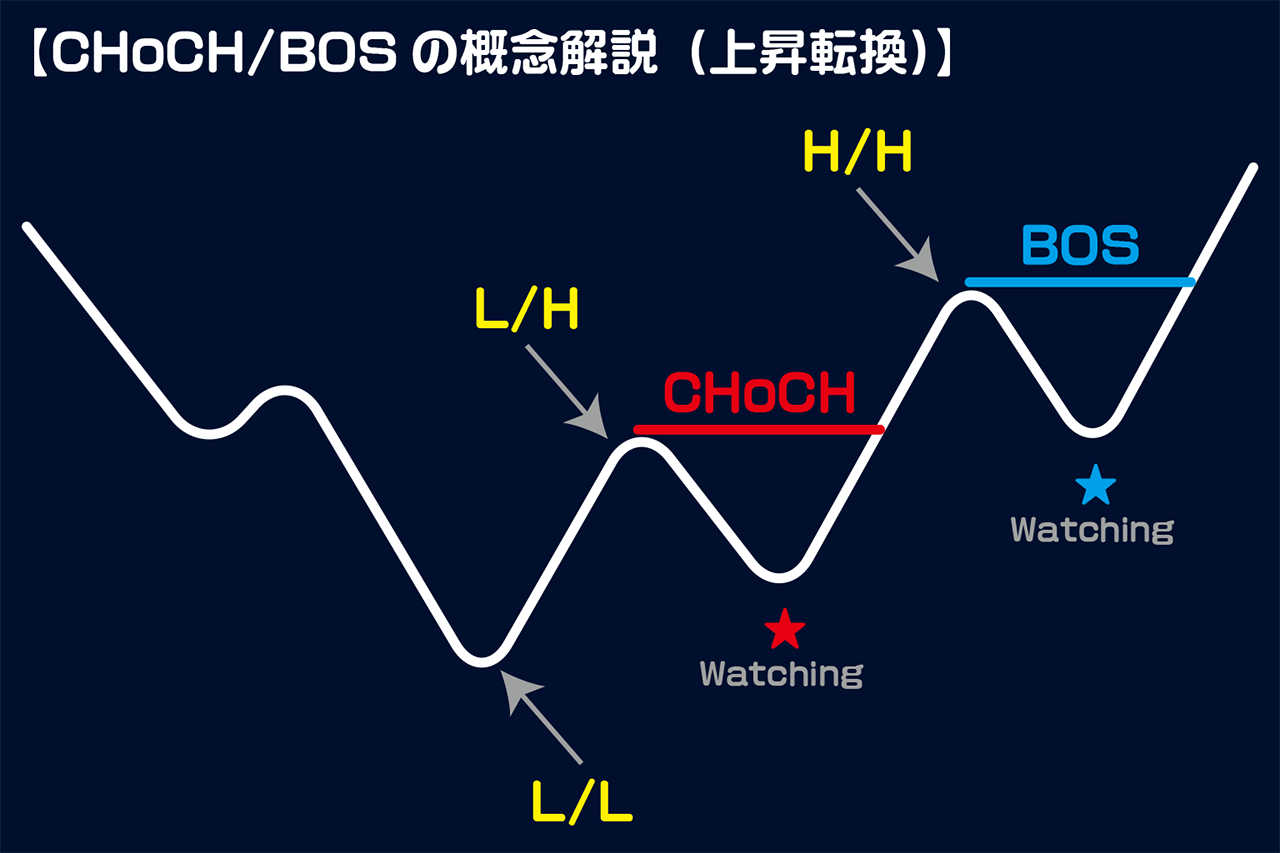
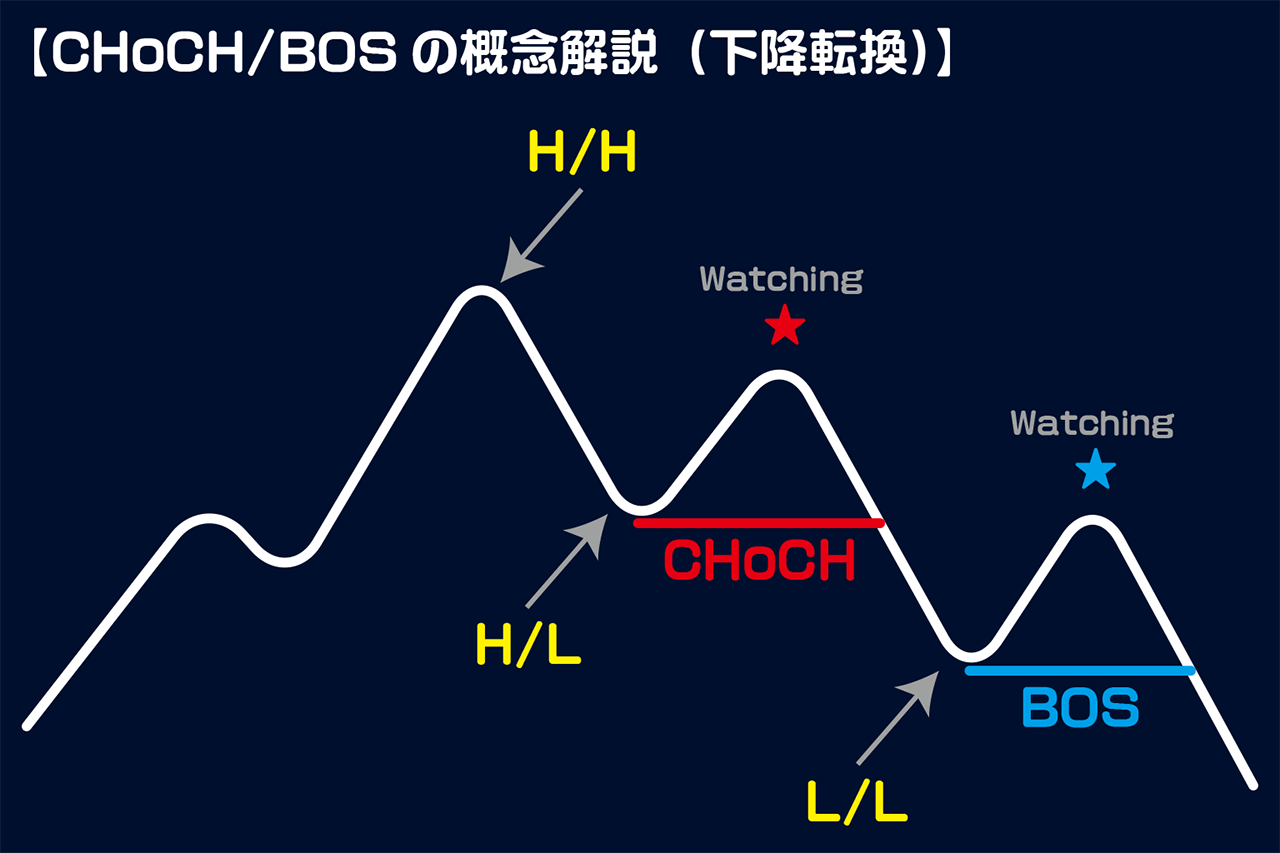
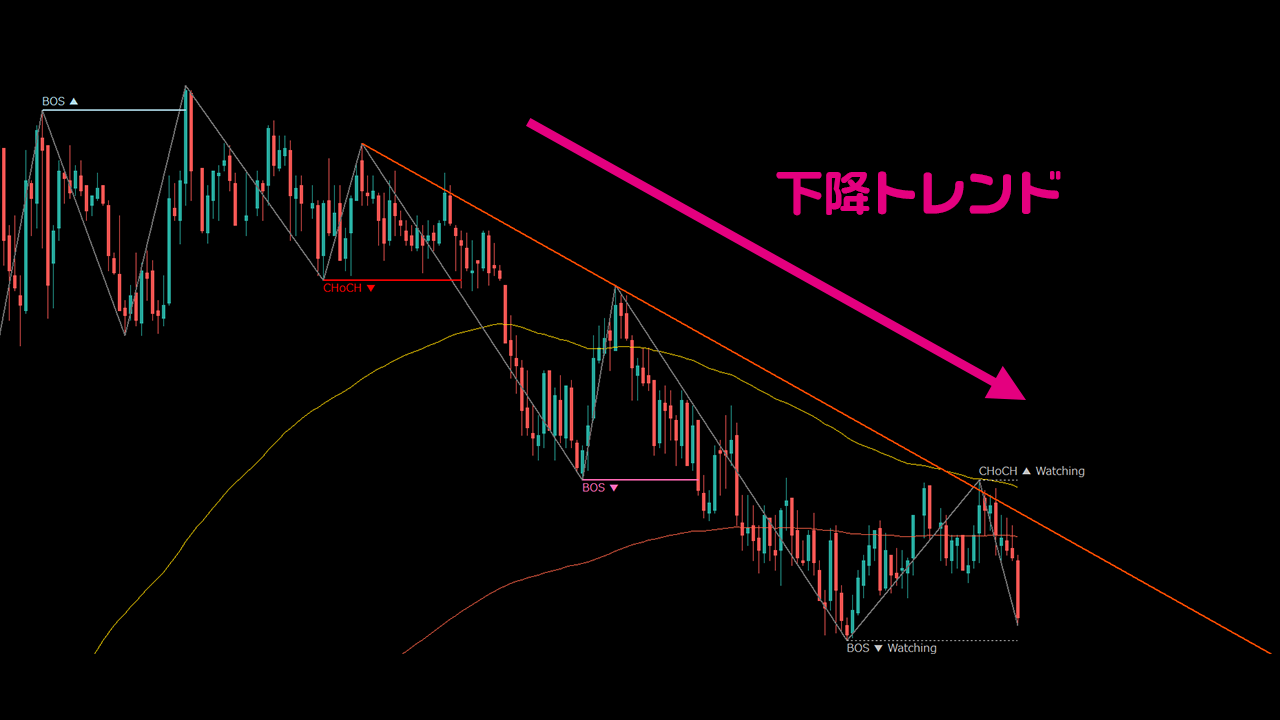
■ The trend direction becomes clearly identifiable
DWM appropriately displays CHoCH (change of character) or BOS (break of structure) according to swing structure changes.
If CHoCH does not occur, BOS is displayed directly at the moment the swing structure is confirmed.
- CHoCH → Sensing the trend’s initial move
- BOS → Determine whether the trend has been confirmed
In actual charts, you can recognize the flow as follows.
- In an uptrend, you can see highs being updated and the pullback location at a glance
- In a downtrend, pullback/sell-off candidate levels naturally appear
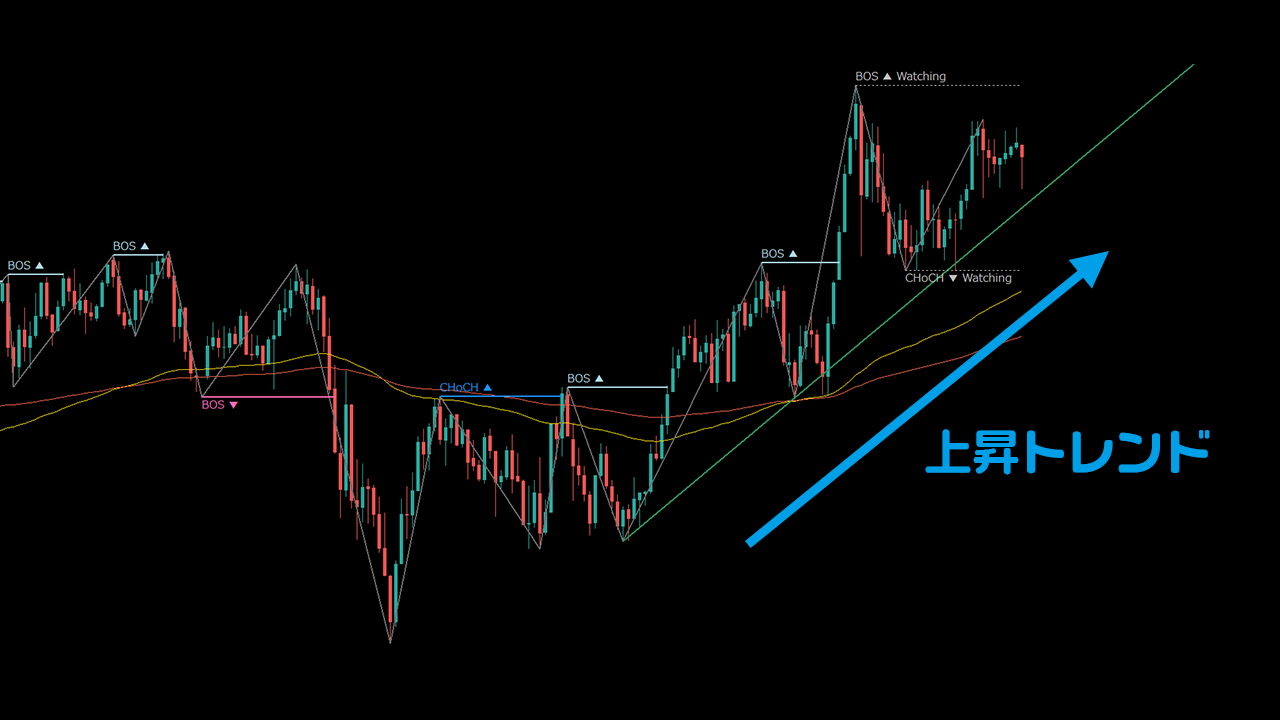
“Am I looking up or down now?”—this fundamental confusion is greatly reduced.
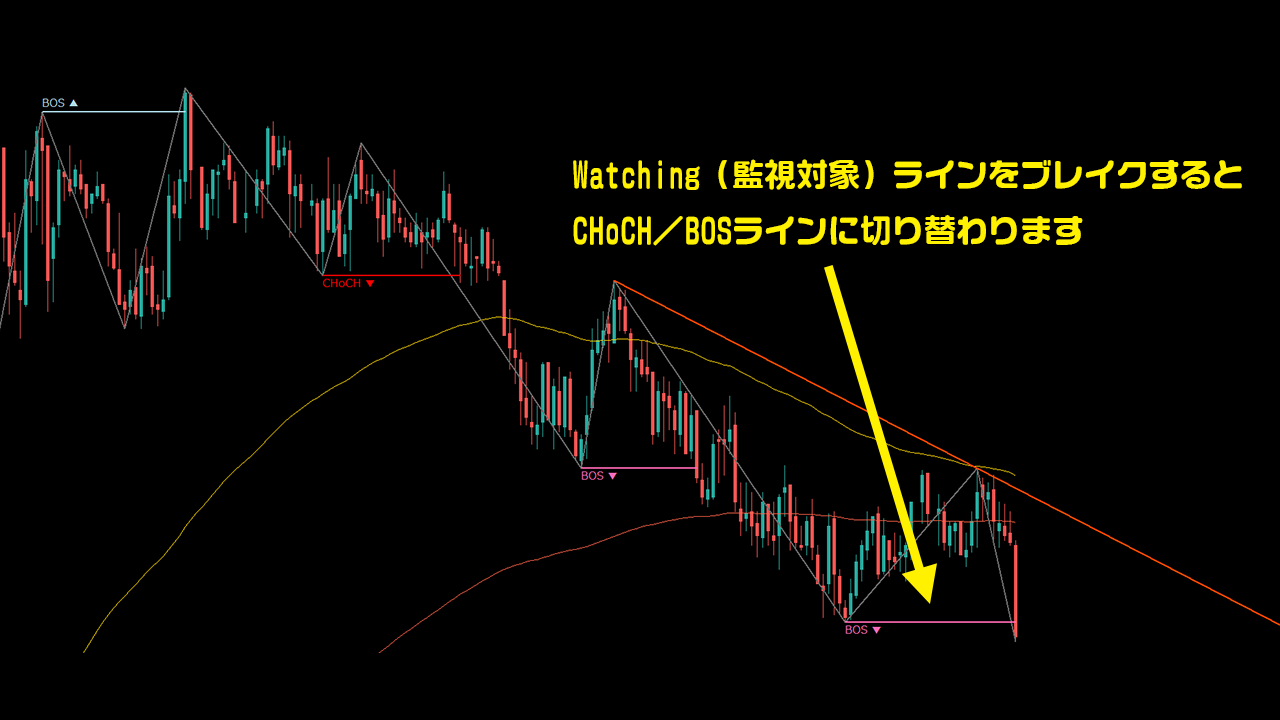
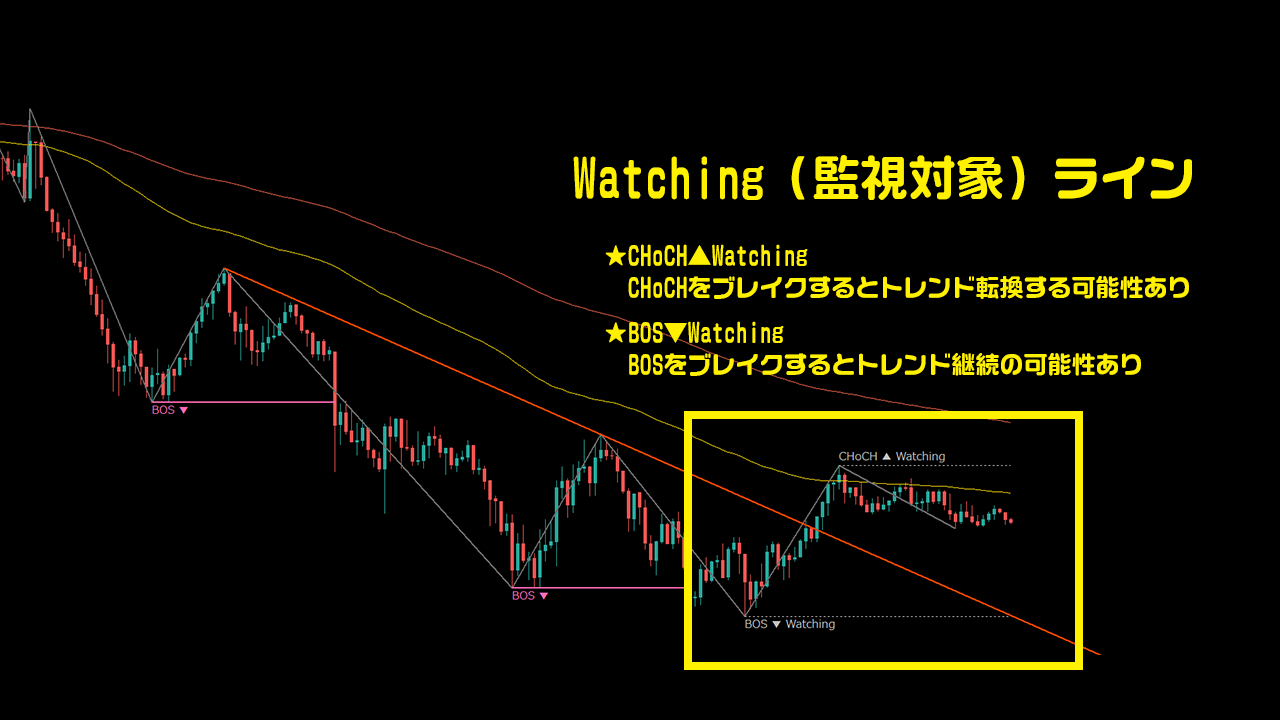
■ Watching (monitoring line) makes deciding the next move easier
One of DWM’s major features is the Watching (monitoring line).
That Watching line is the“If this line is broken, the next CHoCH / BOS will be established”—the next starting point line“If this line is broken, the next CHoCH / BOS will be established”—the next starting point linethat is displayed in advance.
This makes it easier to judge the following:
- Which direction is more likely for the range to break out
- Which direction the next trend is likely to extend
- Where to capture the initial move
When Watching in both up and down directions appears simultaneously, it often indicates a range where the market is searching for a direction, and the breakout timing in either direction becomes the next big opportunity.
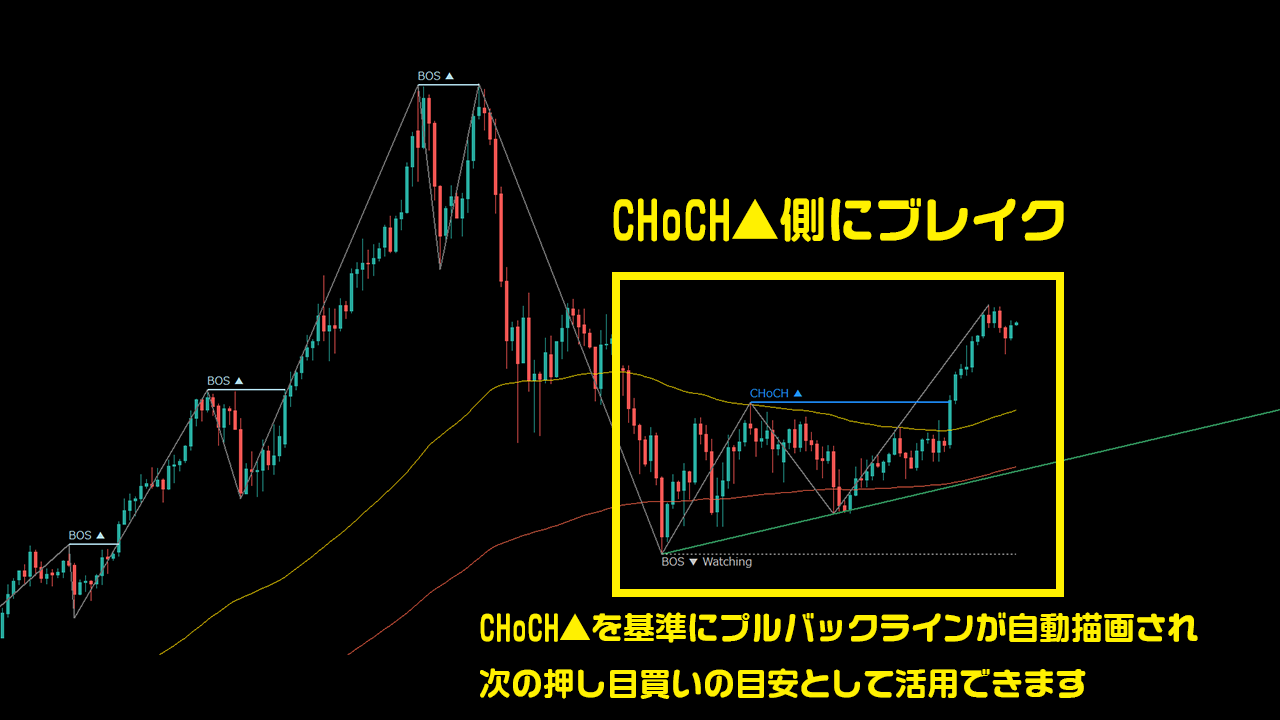
■ Pullback Line clearly marks dip-buy and pullback-sell points
For trend-following, the challenge is“Where to pull back to enter?”.
After CHoCH / BOS is confirmed, DWM draws the pullback candidates as a pullback line.
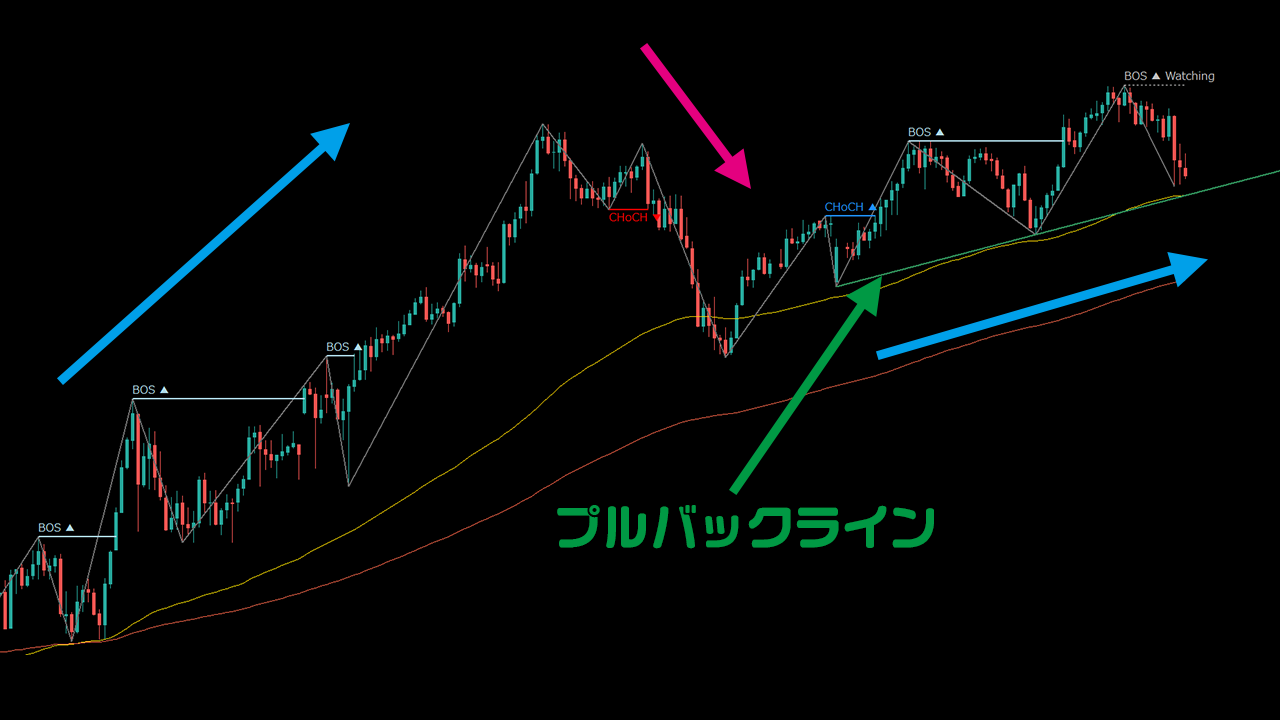
This enables the following uses:
- Uptrend: look for dip-buy candidates near the pullback line
- Downtrend: look for pullback-sell candidates near the pullback line
- Use as evidence for whether the trend will continue
You can reduce mistakes like “pullbacks were shallow and I got stopped out quickly…”.
■ What DWM looks like on actual charts
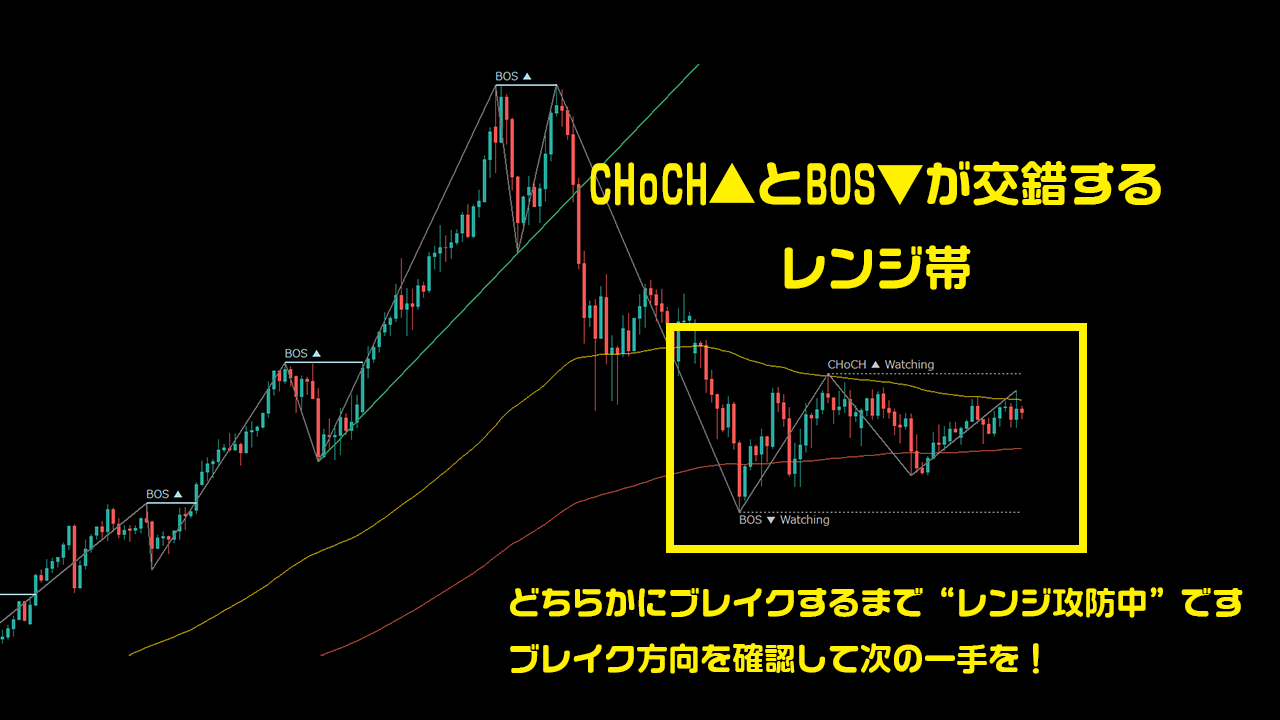
◆ CHoCH and BOS intersecting within a range
- Watching lines appear on both sides
- When neither side breaks, there’s no need to force a trade
- Break direction often becomes the starting point of the subsequent trend
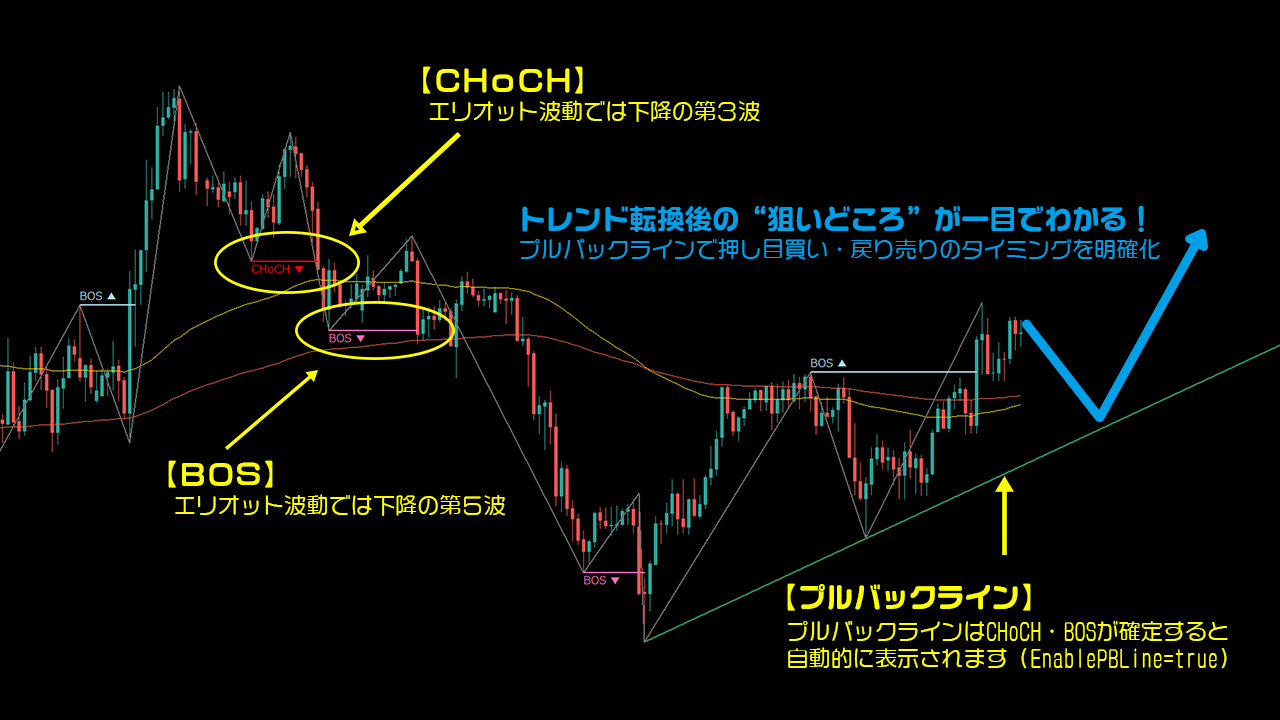
◆ DowWave Marker (DWM) sequence
- Capture the initial move with CHoCH
- Wait for dip-buy / pullback points at the pullback line
- Confirm trend with BOS and follow in the direction
This shows the Dow Theory flow of “initial move → pullback → trend confirmation” on the chart.
■ DowWave Marker is recommended for
- Those who want to deeply understand Dow Theory on charts
- Those who want clean dip-buying and pullback-selling opportunities
- Swing/Day traders who want to use trend-following as a weapon
- Those who don’t want to miss the initial CHoCH
- Those who want to avoid ranges where the market is uncertain
- Those who want to clearly define pullback buy and pullback sell lines
- Those who want to reduce discretionary judgment variance and analyze with rules
From beginners to intermediates,“visible Dow Theory tool”, please use it.
■ Example of using with other indicators
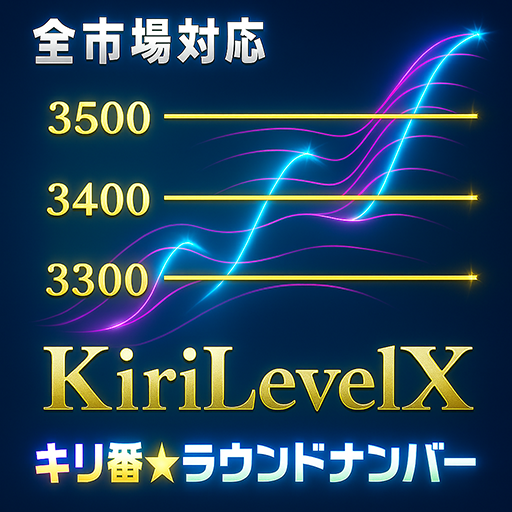
DWM can be used alone, but also together with「KiriLevelX (KLX)」orto determine
“where it reacts”and“how strong the momentum is”will also become clearer, making decisions even easier.
- KiriLevelX (KLX): Price recognition by key rounds and level bands
- Momentum Equalizer (MEQ): Visualization of momentum
- DowWave Marker (DWM): Dow Theory-based structure recognition (CHoCH / BOS)
By combining these three,“Price × Momentum × Structure”enables discretionary trading in a triad approach.
■ Summary
DowWave Marker (DWM)is not just a line display tool; it is“an indicator that visualizes the very structure of the market”.
- Grasping the trend
- Sensing the initial move (CHoCH)
- Clarifying dip-buy and pullback-sell points (pullback line)
- Visualizing range conditions and wait points
- Foreseeing the next branching point (Watching)
By integrating these on the chart,“less ambiguous chart analysis” is realized.
Please, as a discretionary trading tool,DowWave Marker (DWM) may be of great use to you.
◆ Purchase here

DowWave Marker (DWM) Dow Theory-based structure recognition (CHoCH / BOS)
https://www.gogojungle.co.jp/tools/indicators/72037?via=users_products
KiriLevelX (KLX) Price recognition by key rounds and levels
https://www.gogojungle.co.jp/tools/indicators/65584?via=search_product

Momentum Equalizer (MEQ) Visualization of momentum
https://www.gogojungle.co.jp/tools/indicators/65844?via=users_products