

Utilization of “Visualization Indicators” (Part 225)
Utilization of the "Visualization Indicator" (Part225)
1. Further develop the "28 Currency Pairs List Indicator" into a visualization indicator
"8CPVisualization Indicator"to plotGBPCHF.
The "8CPVisualization Indicator" includesOceania版,LondonNewYork版,AnyCP版. This time, we used theLondon版.
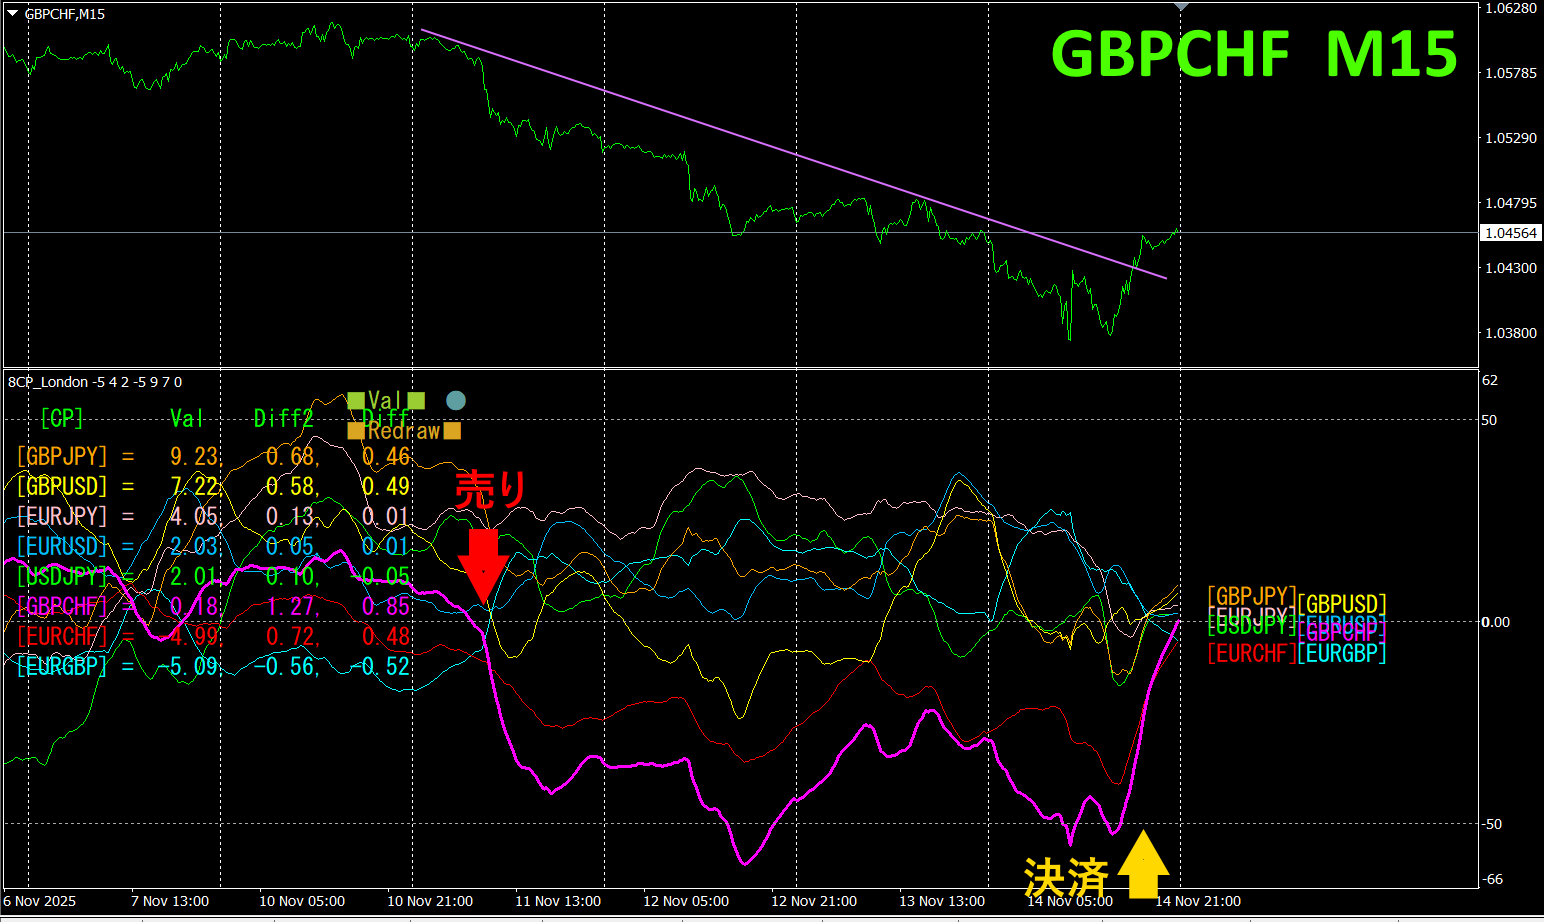
The upper half is theGBPCHF 15-minute chart. The lower half shows the results from the “8CP Visualization Indicator”; the red-violet thick line corresponds toGBPCHF.
On Tuesday, the graph forGBPCHF fell below the others, so we traded short. SinceGBPCHF has been running much lower than the others, we will hold the short position until Friday (until it breaks above the downward trend line). Profit was about120 pisp.
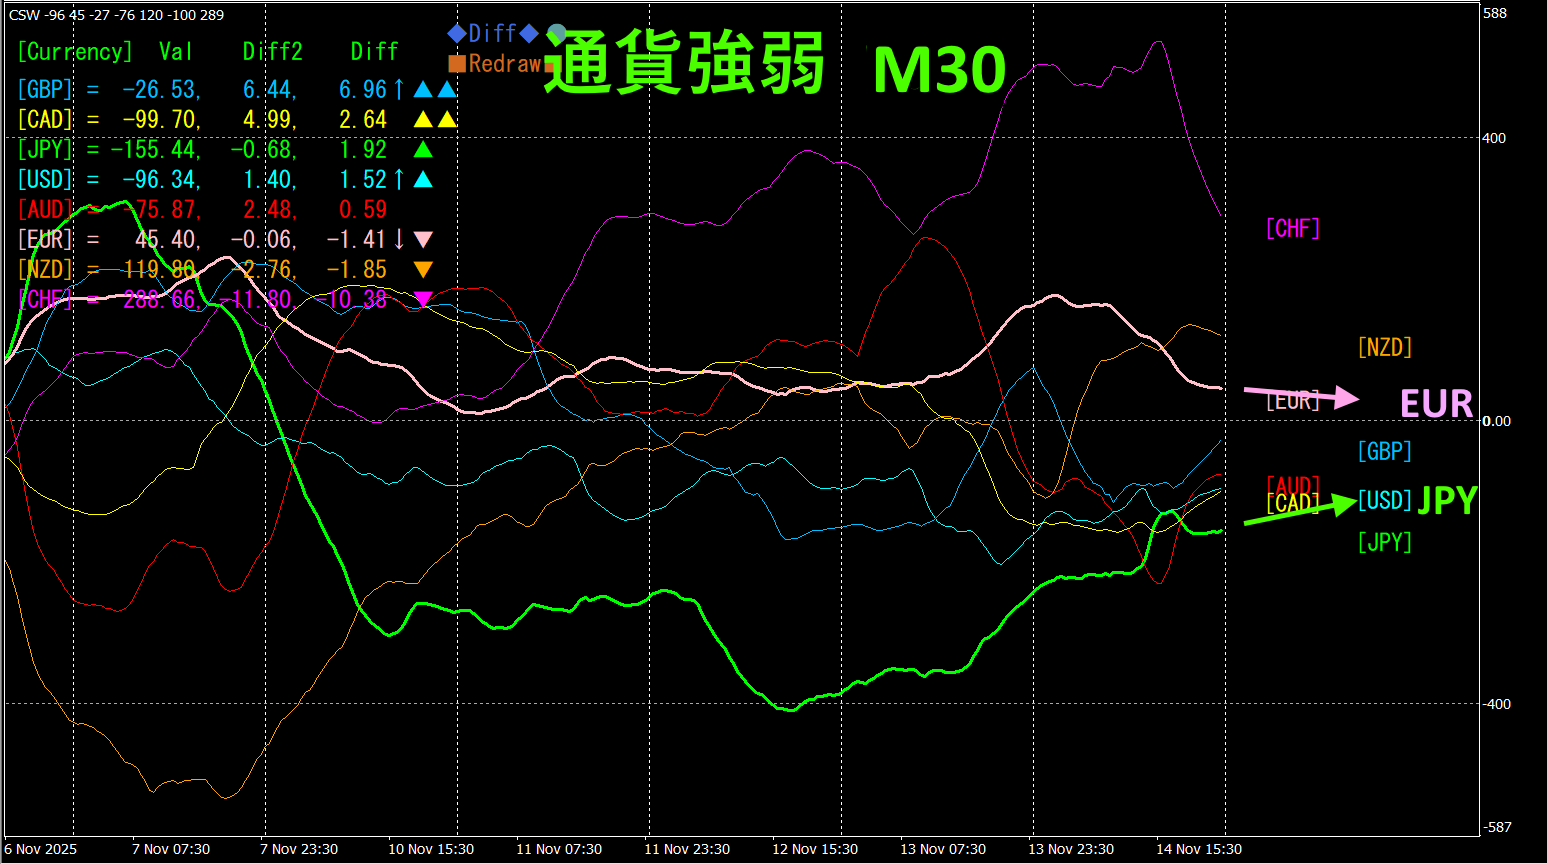
Currency Strength/Weakness Graph
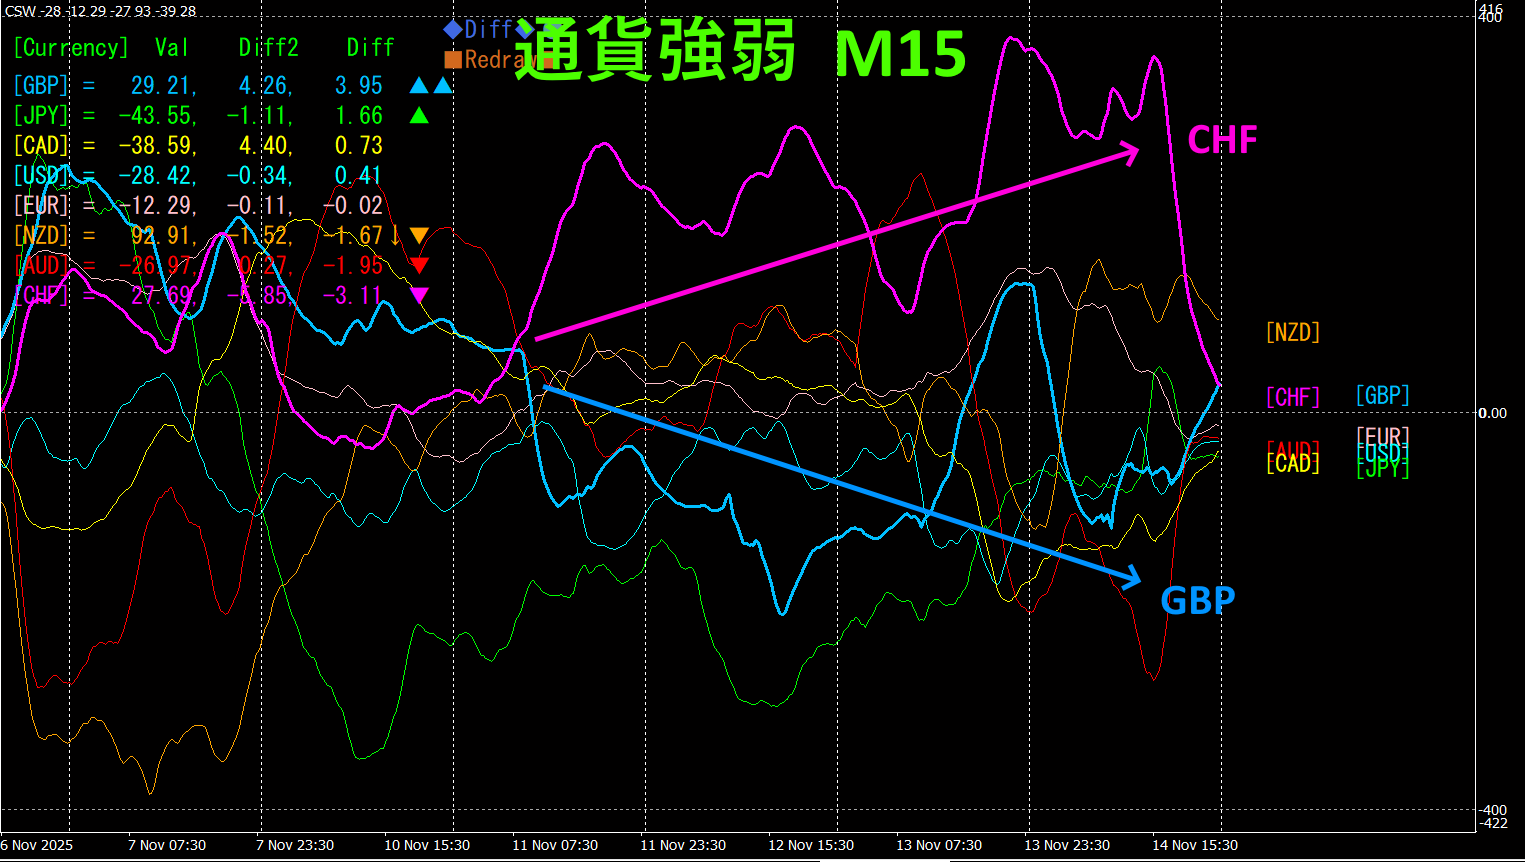
Looking at the 15-minute currency strength graph, andGBP show a remarkable inverse correlation.CHF andGBP relationship isCHF > GBP, so focus on the parts where CHF and GBP diverge, and trade sellingGBPCHF. Although the graph fluctuates, as long as the vectors for CHF and GBP diverge, keep the position.
In FX trading, pick the currency pair that is currently the strongest and showing inverse correlation, and trade it; the results will follow naturally.
"Aim for Currency Strength Inverse Correlation!" isFX's long-standing rule.
By using theTrendLine-EX, you can automate entries and exits when the trend line is breached. You can leave it as is for easy trading. TheTrendLine-EX is a semi-automatic EA that sells automatically on a trend line breach and exits automatically on a breach above the trend line.
2. Best SelectTry the indicator
The diagram below shows the date2025/11/14 17:26 (JST) screenshot.
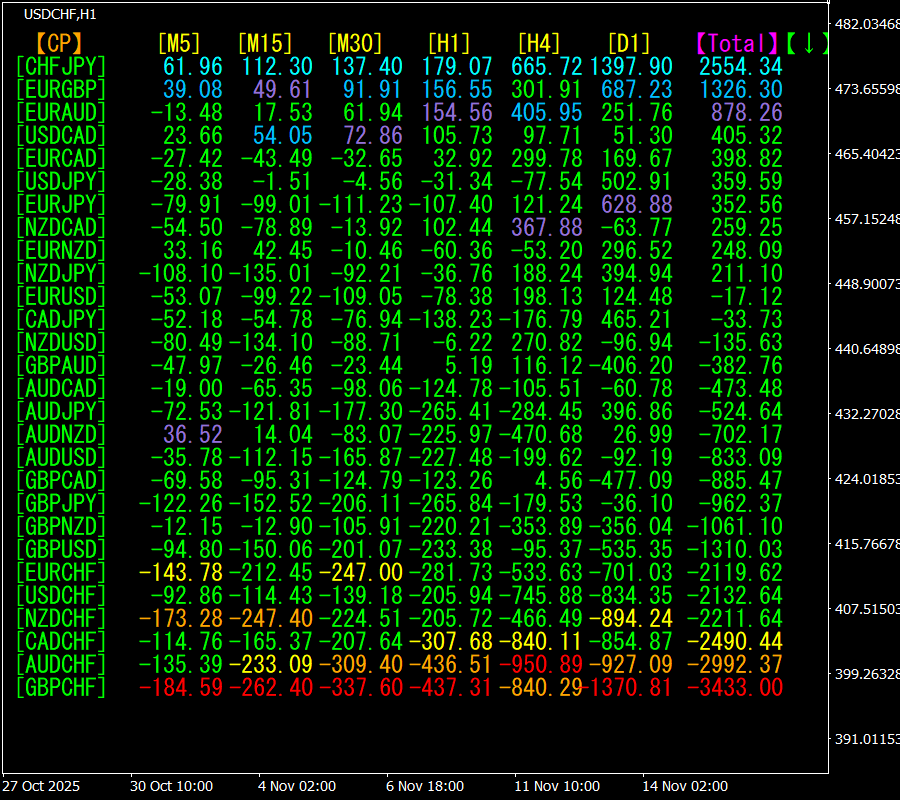
[Total]Numbers are ordered in descending order. At the bottom,GBPCHF shows red, indicating it appears in red across all timeframes.Total value is-3433.00, a large negative figure. This suggests a downward trend forGBPCHF.
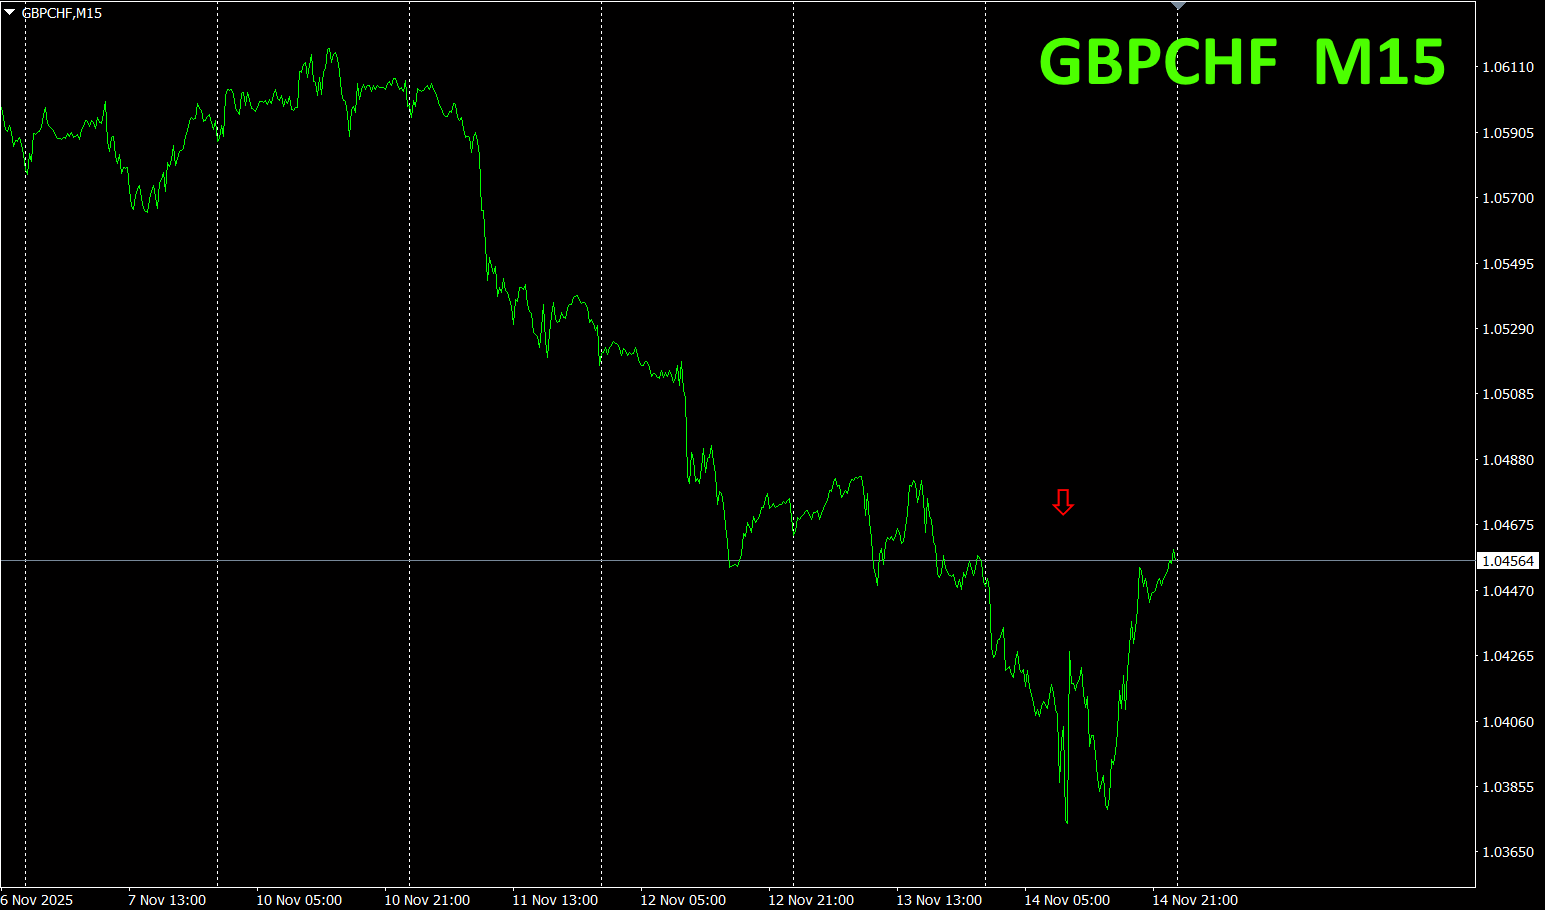
Now, let's look at the GBPCHF chart.
The red arrows indicate the moment the screenshot was taken. It captures a sharp decline.
"28 Currency Pairs Best Select Indicator" makes it easy to identify which currency among the 28 pairs has the strongest ongoing trend. It also tells you with numbers and colors whether you should trade now. It is an excellent indicator for quickly assessing all currency pairs.
"28 Currency Pairs Best Select Indicator"

https://www.gogojungle.co.jp/tools/indicators/35128
3. Since 2021May, what happened to EURJPY?
From May 2021,year2021 May EURJPY
To view the overall trend, we draw roughly the last 3 weeks on a 30-minute chart.
Last time, I wrote the following.
Pink isEUR, green isJPY. In the currency strength chart,EUR is slightly downward,JPY isEUR lower, so the future direction is expected to be a slight rise forEURJPY.
As predicted, it rose nicely.
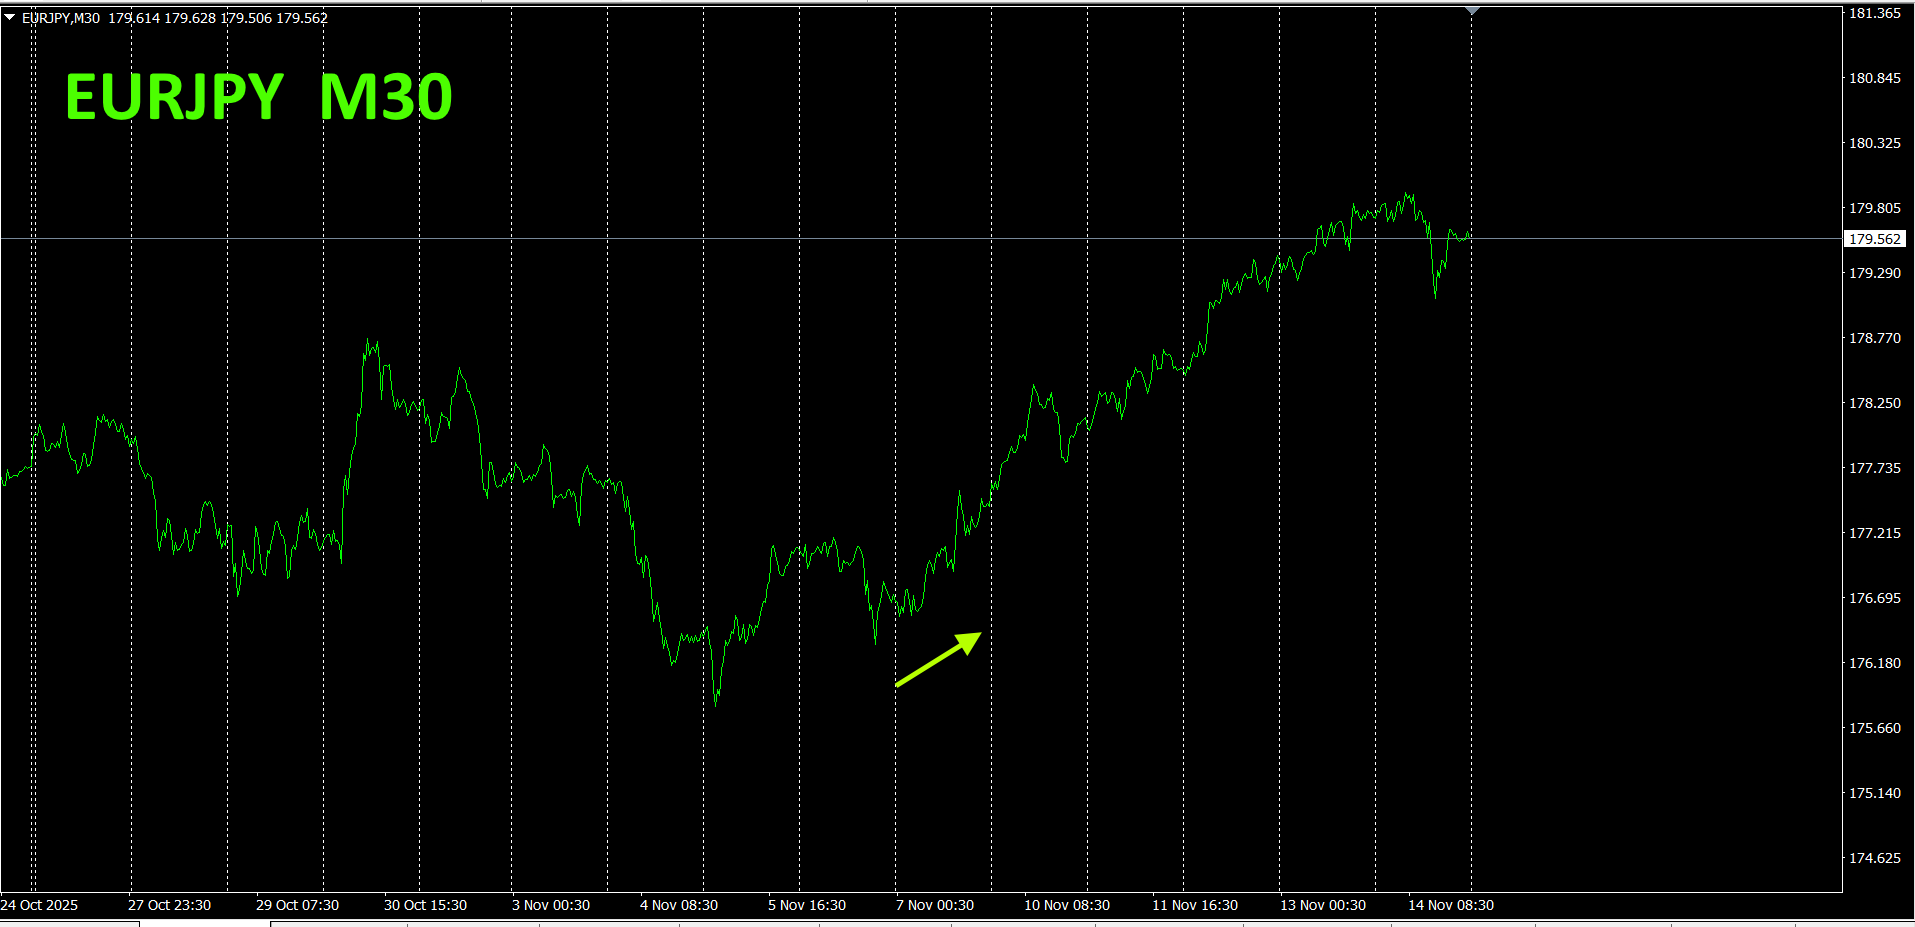
30 minutes currency strength chart.
Pink isEUR, green isJPY. The rise of last week'sEURJPY was due to weakness in the. For future direction, is slightly downward,JPY slightly upward, soEURJPY is expected to trend slightly downward.
4.New Indicator Dual_MACD_Trend_Indicator to tryout
New indicator “Dual_MACD_Trend_Indicator” please refer to below.
MT4版:https://www.gogojungle.co.jp/tools/indicators/62199
It is an indicator that clearly and vividly shows the trend direction with colors. If the color of the bar isLimeLime, it is a buy; ifRed, it is a sell; it is easy for beginners to use. A green bar means an uptrend, a red bar means a downtrend, and no color indicates no trend. Since it uses color, you can grasp the trend state at a glance.
I have applied this indicator to theGBPCHF on the1 hour chart.
The red sell zone and the green buy zone are clearly separated, making trades easy to execute at a glance. Overall, a downtrend, so you should only trade the short by the white circle area in the top diagram. When the indicator color turns red, it’s an excellent sell point. This allows you to trade only where the trend is about to extend.
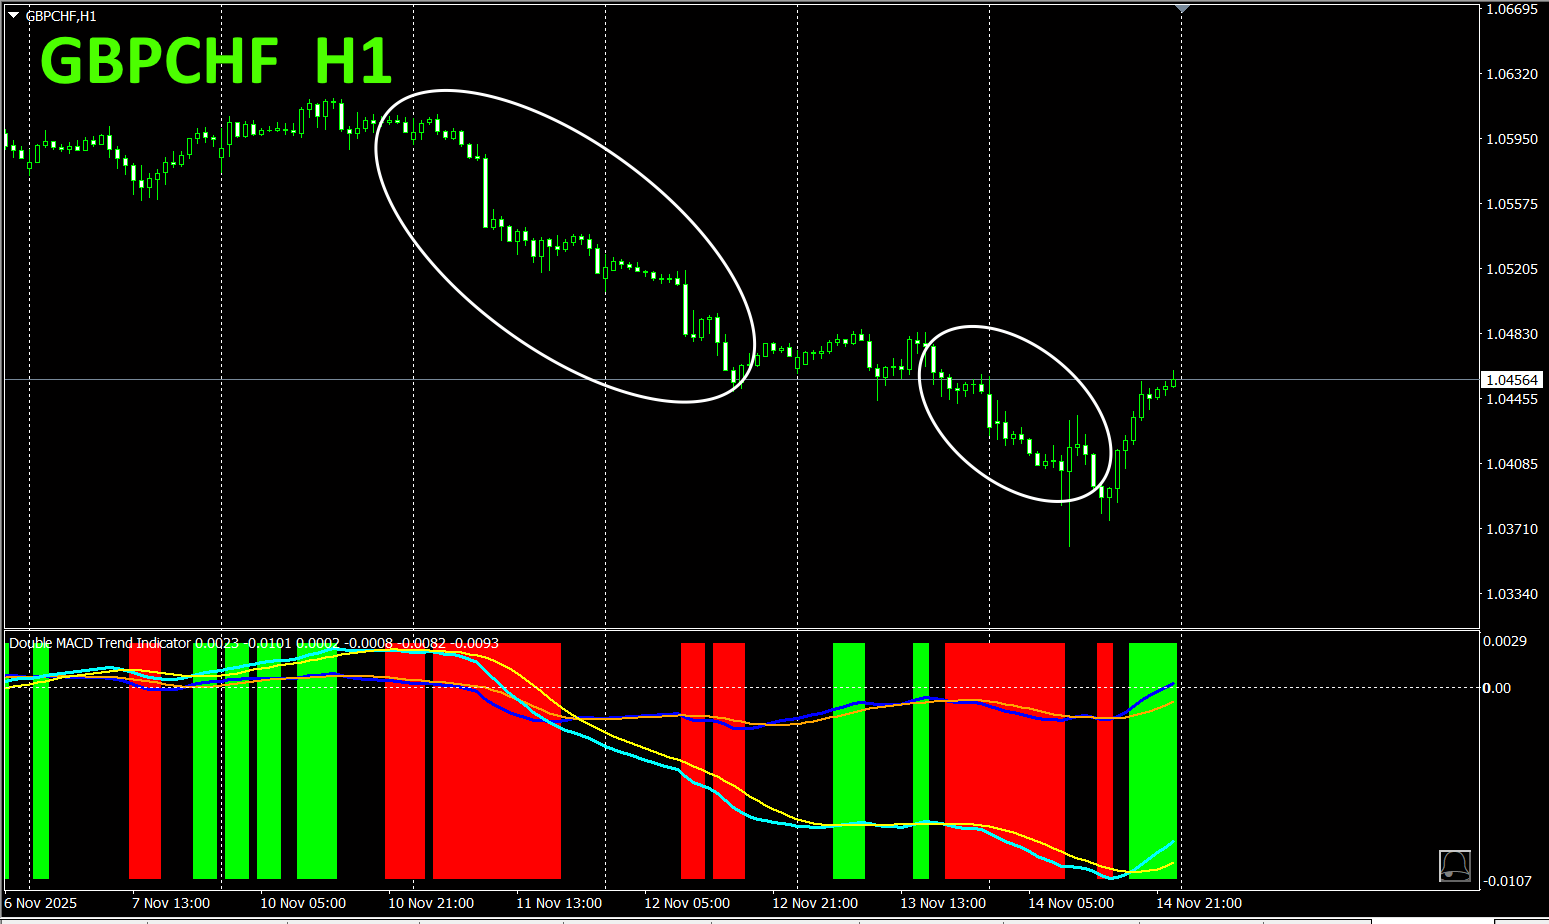
With theDual_MACD_Trend_Indicator, follow a simple rule: buy in green zones, sell in red zones, and trade nowhere else.
Using theDual_MACD_Trend_Indicator removes any hesitation about trade direction.
5.
“Hyper-CSW” has been released
“Hyper-CSW” is a high-performance indicator that visualizes the strength of the major810 bars on the current timeframe, and accurately captures trend persistence and turning points. Moreover, multi-timeframe analysis supports showing currency strength rankings (top4,H1,H4,D1W1. It is a powerful indicator that helps you gauge market direction with high visibility via color lines and a separate window.4M15 currencies) with scores across multiple timeframes such as
For more details, please refer to the following link.
https://www.gogojungle.co.jp/tools/indicators/65082
Note: Recommended indicators
“8CFD Visualization IndicatorAny version”
https://www.gogojungle.co.jp/tools/indicators/32288
“Tore Tore Indicator”
https://www.gogojungle.co.jp/tools/indicators/50115
“TrendLine-EX”


https://www.gogojungle.co.jp/tools/indicators/42257

“8C currency strength visualization indicator” please refer to the following page.

MT4 version https://www.gogojungle.co.jp/tools/indicators/39150
version https://www.gogojungle.co.jp/tools/indicators/39159
【My listed products】


