Let's interpret the Strategy Tester numbers to discover a better EA!
“SysTrade, forward measurement is quite different, but what’s the truth?”and so on,
“There are various numbers on the first page; how should I read them?”we receive inquiries such as
There are many. There are numerous standard figures used to evaluate system trading, but many people still have trouble understanding them,
so I thought I’d explain the figures this time,
and here is a brief introduction. If you’re interested, please feel free to contact us!
That 1: Do forward measurements differ from actual measurements?
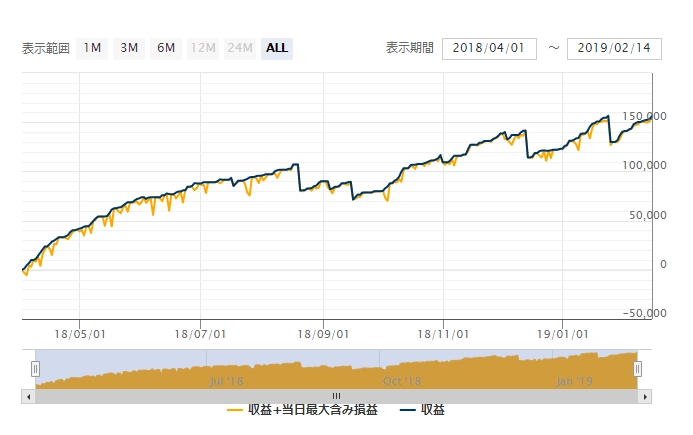
The forward measurement values displayed by our companyare in the demo accounts of the partnered brokerage
installed with the default settings. Therefore, on real accounts, some positions cannot be closed by a stop-loss
and are properly stopped out. Conversely, take-profit is also properly realized.
Also, since this is not exchange-traded,the quotes provided by each brokerage differ slightly.
Therefore, even the same EA may enter and exit at different prices.
This is the cause of the difference. By the way,our forward display time is EET (the location of the MT4 development company’s server in Cyprus)
.
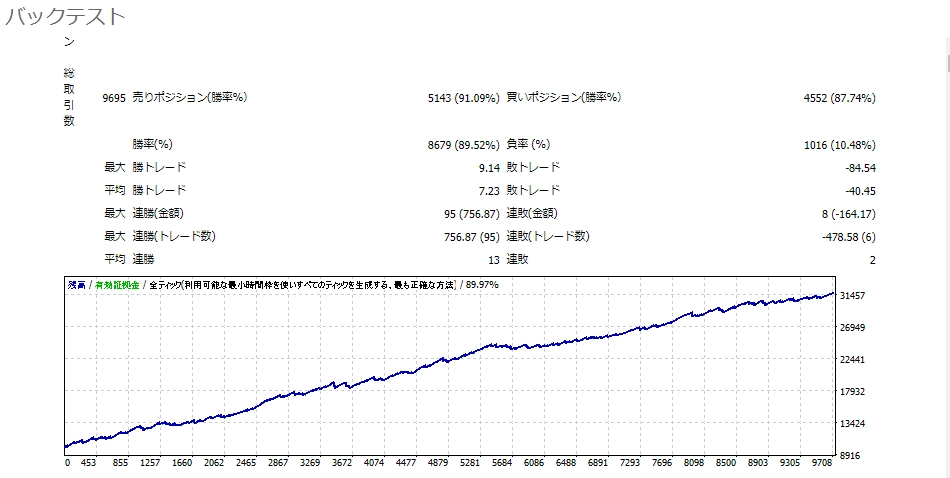
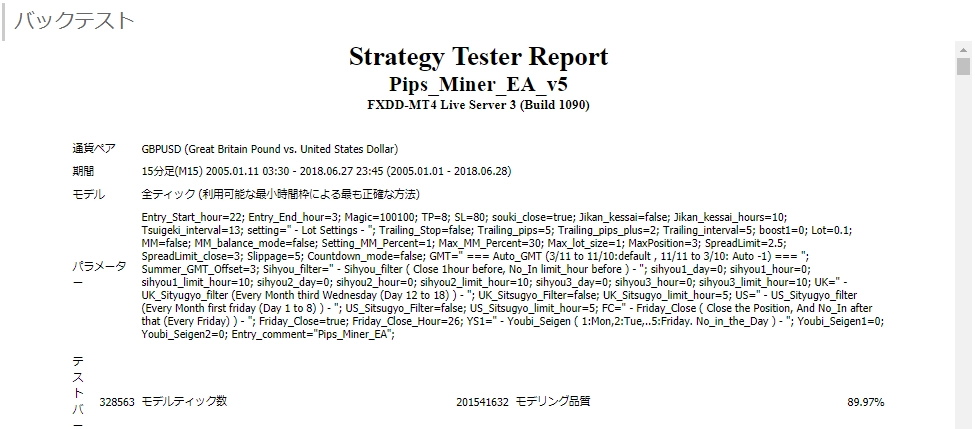
That 2: Is backtesting worth looking at?
In the world of system trading, backtests at various points such as “Random Walk Forward” and “Walk Forward,”
are performed to select parameters that yield the best results at any point in time. This process is called
curve fitting, and it is often the subject of evaluation and criticism,but it is an indispensable task for building a system.
(Of course, some people do not do it.)
The value of backtests depends on how the results are displayed, but readers can only guess.
Alsono matter how good the past is, if the present is bad it is meaningless. Try to place importance on those with as long a history of testing as possible.
To do that, read the detailed information carefully and understand it.
That 3: There are various evaluation metrics; which are important?
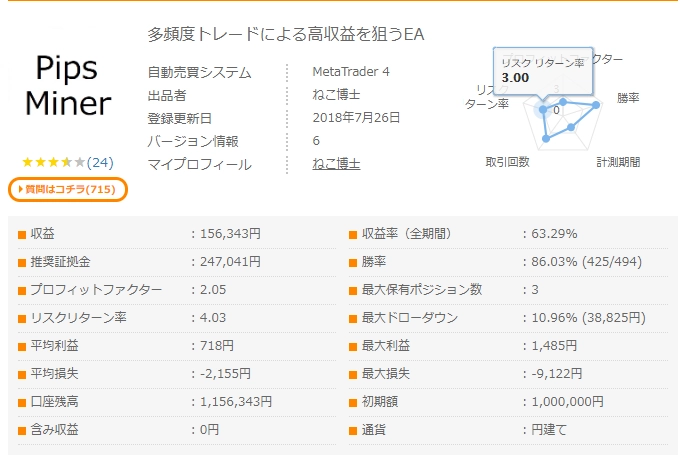
First of all, everyone would point to“Net profit” and “Maximum drawdown”.
And when I wrote a similar article before,I highlighted the average winning trades, average losing trades, total number of trades, and
PF. These numbers show how much profit can be earned over a period, how much you could lose at most, and how much profit is expected per trade.

Today,we will introduce two figures that are not displayed
Recovery Factor (RF) and Risk-Reward Ratio (RRR).
Recovery Factor (RF)is the ratio of profit to the maximum drawdown.
It represents how much you have recovered from the drawdown.
“Profit ÷ Maximum Drawdown”
A higher recovery factor is preferable, and above 10 is excellent.
Usually it is in the 2–3 range, I suppose.
Risk-Reward Ratio (RRR) – the ratio of gains to losses.
“Average Winning Trade ÷ Average Losing Trade”This is read in relation to the win rate.
If the RRR is 1.0 and the win rate is 50%, it’s break-even.
In other words, if RRR is less than 1 and the win rate is 80%, you can still be profitable. Ideally, RRR should be 2 or higher.
Would you like to learn more about system trading?