

Utilization of the "Visualization Indicator" (Part 223)
“Visualization Indicator” usage (part223)
1. Further evolve the “28 Currency Pairs List Indicator” into an indicator
“8CP Visualization Indicator” to drawGBPAUD.
The “8CP Visualization Indicator” hasOceania version,London version,NewYork version,AnyCP version. This time, we used theOceania version.
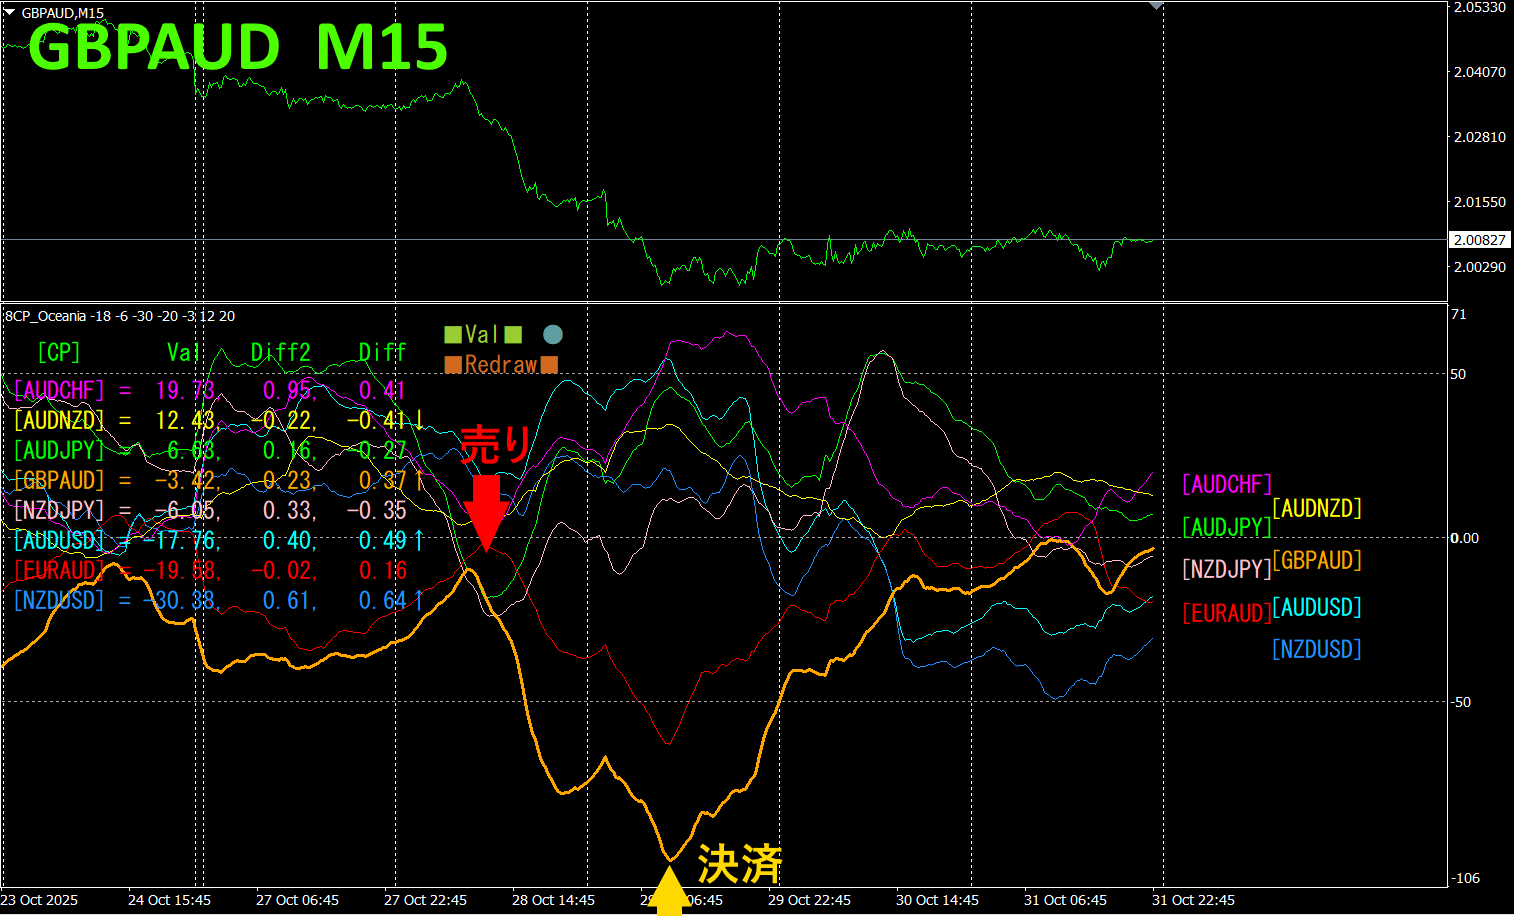
The top half is a 15-minute chart ofGBPAUD. The bottom half is from the “8CP Visualization Indicator,” where the orange thick-line chart corresponds toGBPAUD.
On Tuesday, the GBPAUD chart fell below the other charts, so we traded short. Profit was about300pisp.
Currency Strength/Dynamics Graph
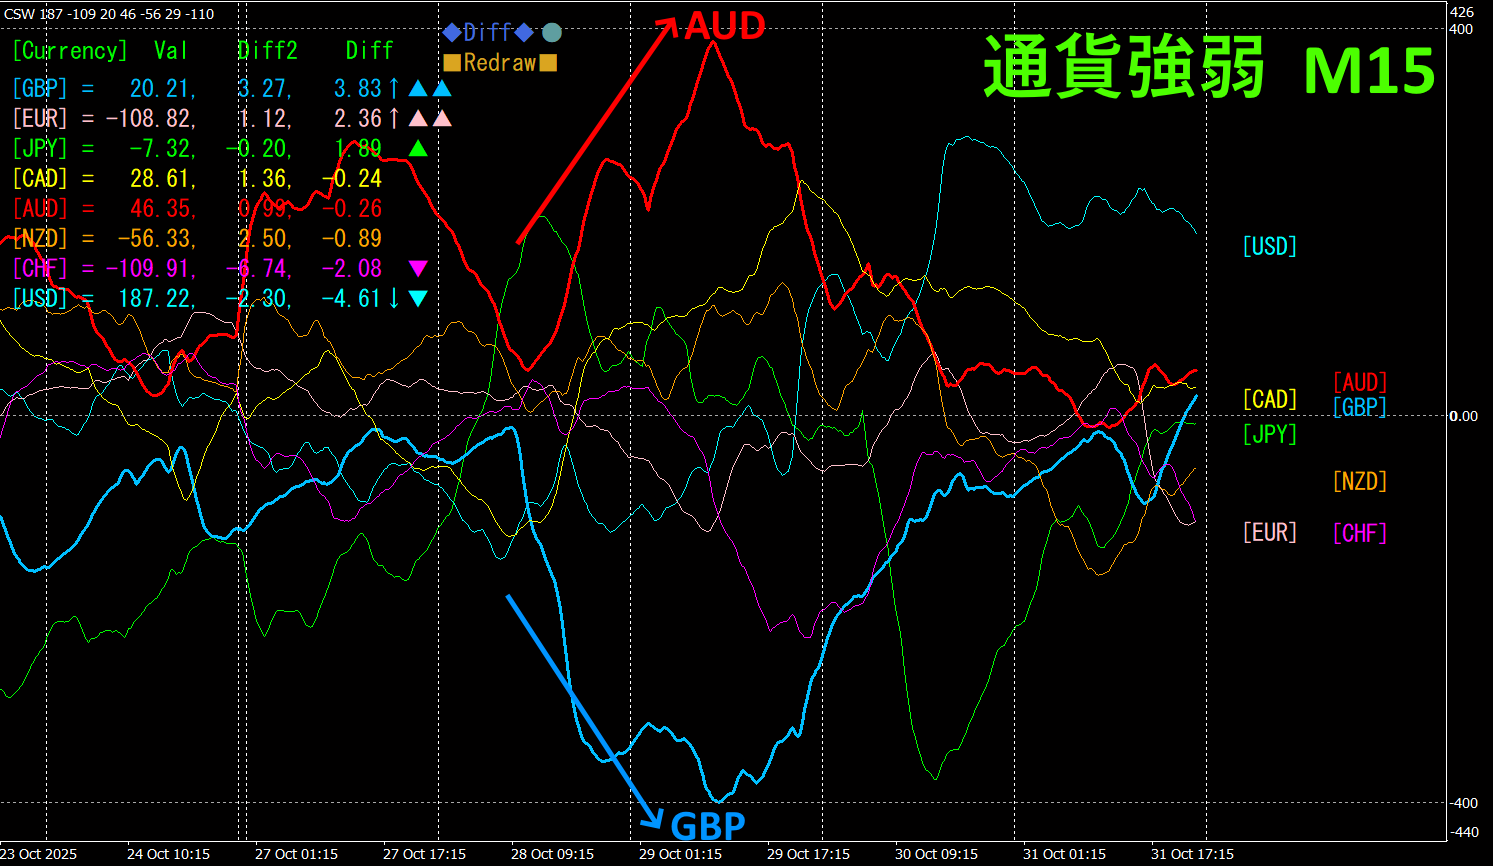
Looking at the 15-minute currency strength graph,AUD andGBP show a remarkable inverse correlation.AUD andGBP relationship isAUD >GBP, and by focusing only on the parts where AUD and GBP spread apart, you can trade GBPAUD as a short. If you select the currency pair that is currently diverging the most and trading in that direction, results will follow naturally.
“Aim for Currency Strength Inverse Correlation!” isFX rule of thumb.

If you useTrendLine-EX, you can automate entries and exits when the price breaks a diagonal trendline. You can leave it as is, making trading easy. “TrendLine-EX” is a semi-automatic EA that automatically sells on a break below the trendline and automatically closes on a break above it.
2. Best Select Try the Indicator
The figure below is a screenshot taken on2025 year10 month27 day07:21 (JST).
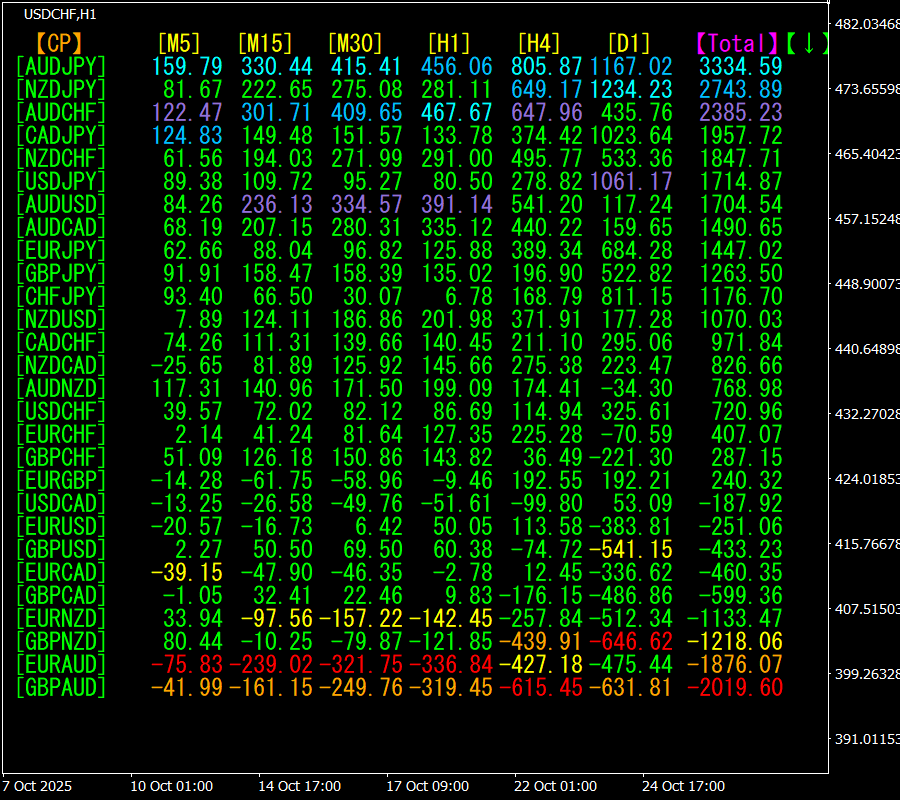
[Total]Numbers are arranged in descending order. At the very top,AUDJPY shows blue in all timeframes.Total value is3334.59, a positive number.AUDJPY indicates an uptrend.
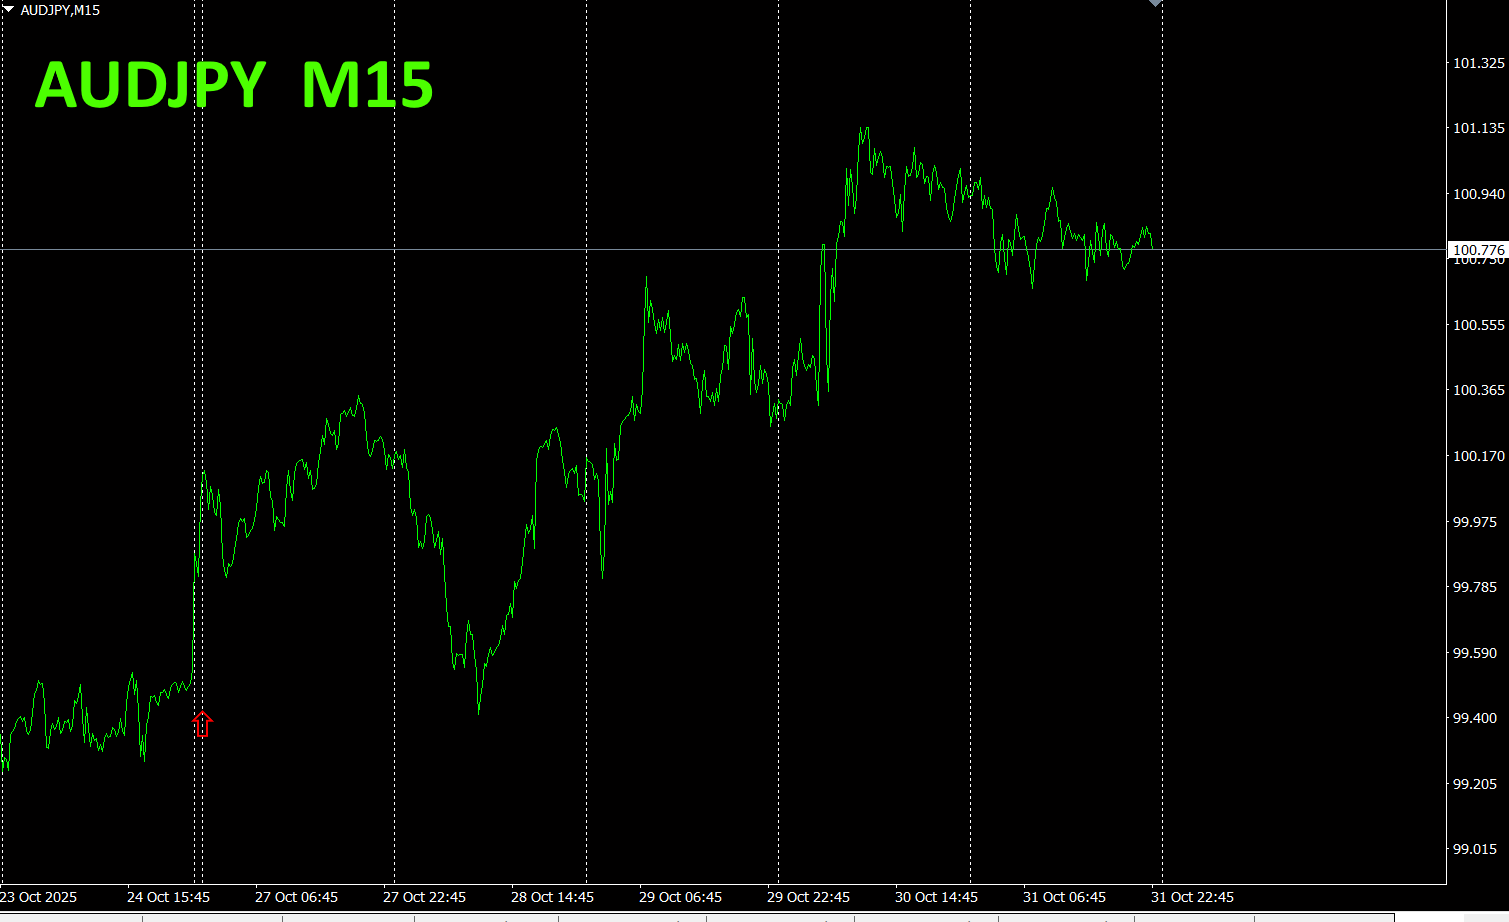
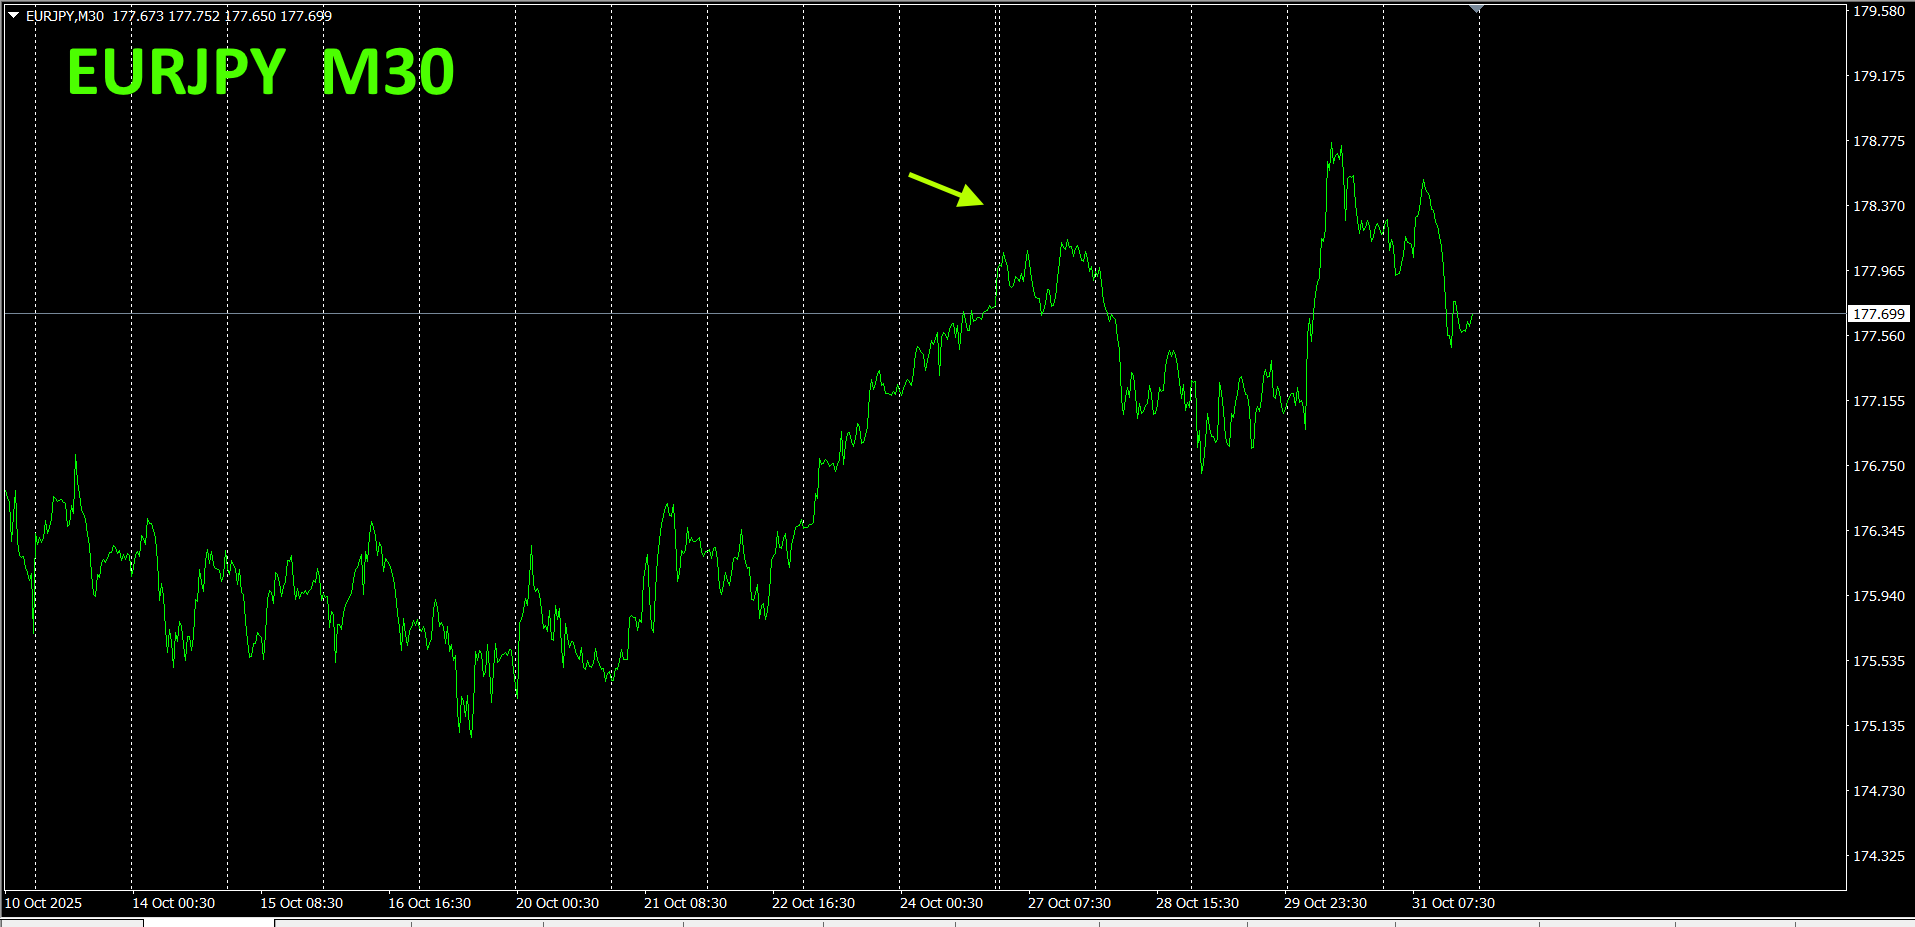
Now, let’s look at the AUDJPY chart.
The red arrow marks the screenshot location. It captures the steep rise.
The “28 Currency Pairs Best Select
The “28 Currency Pairs Best Select Indicator”

https://www.gogojungle.co.jp/tools/indicators/35128
3. 2021 Year5 month to dateEURJPY
Since 2021 year5 month, we have been tracking the movement ofEURJPY.
To see the overall trend, we draw roughly the last30 minutes over about3 weeks.
Last time I wrote the following.
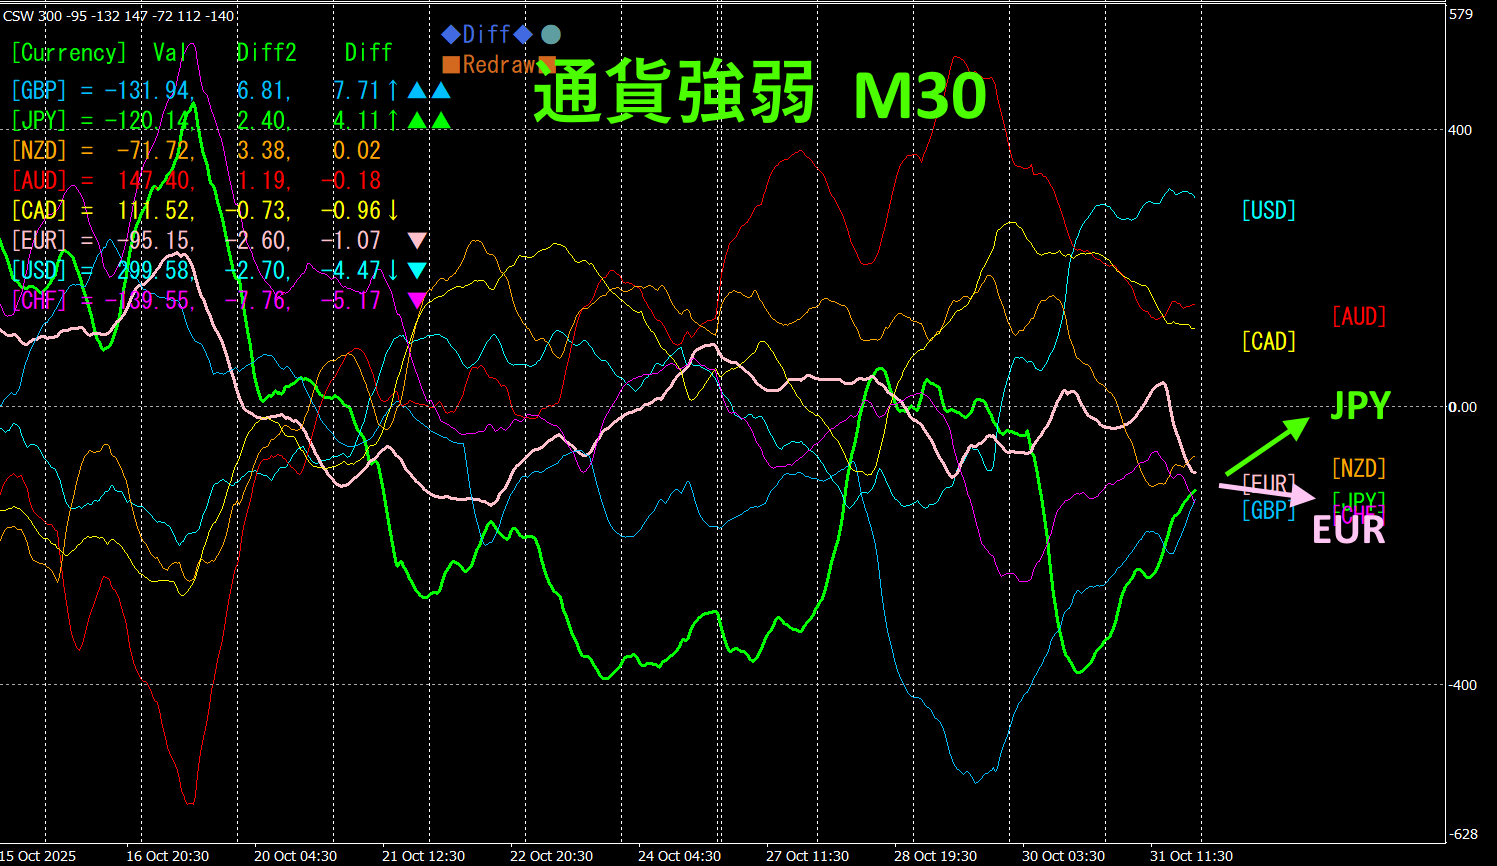
Pink isEUR, green isJPY >JPY, but going forward, is flat, soJPY
As expected, it trended slightly downward.
30 minutes currency strength chart.
Pink isEUR, green isJPY. In currency strength charts, more downward, upward, so going forward, is expected to trend downward.
4.New Indicator Dual_MACD_Trend_Indicator is being tested...
New indicator “Dual_MACD_Trend_Indicator” See below.
MT4 version:https://www.gogojungle.co.jp/tools/indicators/62199
MT5 version:https://www.gogojungle.co.jp/tools/indicators/62202
An indicator that clearly shows trend direction with color. If the color bars areLimeLime, it’s a buy; if, it’s a sell. Easy for beginners to use. If the bar color is green, it’s an uptrend; red, a downtrend; if no color, no trend. Because it uses color, you can see the trend state at a glance.
I have installed this indicator on GBPAUD on the hour chart.
The red sell zone and green buy zone are clearly separated, making trading easy to see at a glance. The overall downtrend suggests selling only within the circled area in the top diagram. Follow the colors of the indicator; if red, sell. This lets you scope only the parts where the trend grows, earning profits without strain.
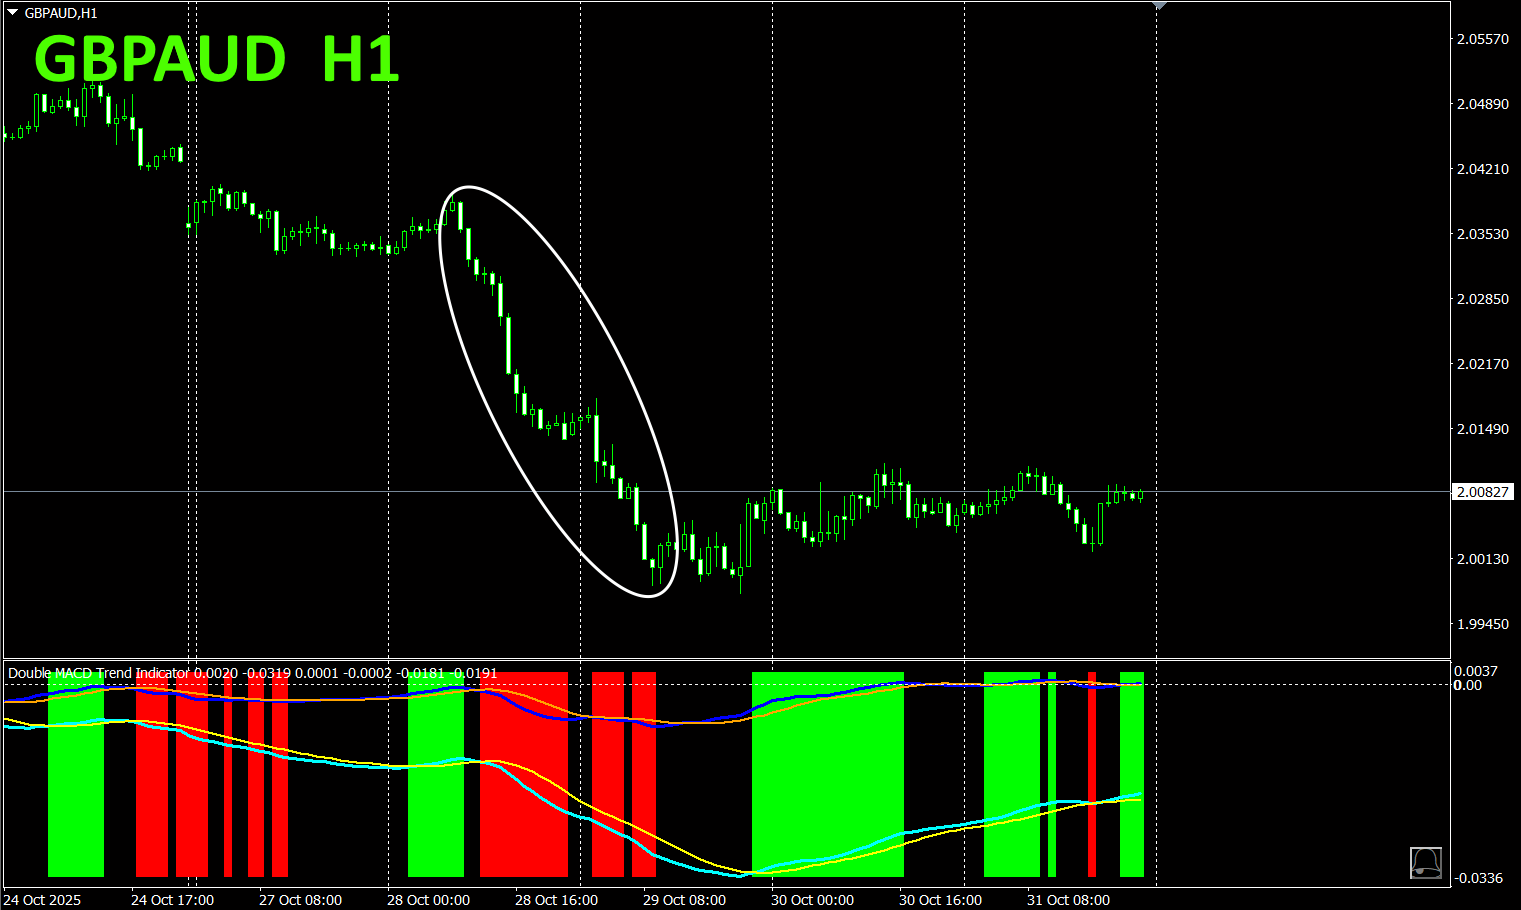
With the “,” you simply follow rules: green zones = buy, red zones = sell, and do not trade otherwise.
Using theDual_MACD_Trend_Indicator eliminates uncertainty about trading direction.
5.
“Hyper-CSW” has been released
“Hyper-CSW” is a high-performance indicator that visualizes the strength of the eight major currencies at a glance. It records the strongest currency and score in the current time frame, capturing trend persistence and turning points accurately. It also supports multi-timeframe analysis showing currency strength rankings (top44 currencies) with scores. With highly legible color lines and a separate window display, it empowers you to gauge market flow.
For details, please see the following link.
https://www.gogojungle.co.jp/tools/indicators/65082
※Recommended Indicators
“8CFD Visualization IndicatorAny version”
https://www.gogojungle.co.jp/tools/indicators/32288

“Toretore Indicator”
https://www.gogojungle.co.jp/tools/indicators/50115
“TrendLine-EX”
https://www.gogojungle.co.jp/tools/indicators/42257

The “8C Currency Strength Visualization Indicator” can be found on the pages below.

MT4 version https://www.gogojungle.co.jp/tools/indicators/39150
MT5 version https://www.gogojungle.co.jp/tools/indicators/39159
【My items for sale】


