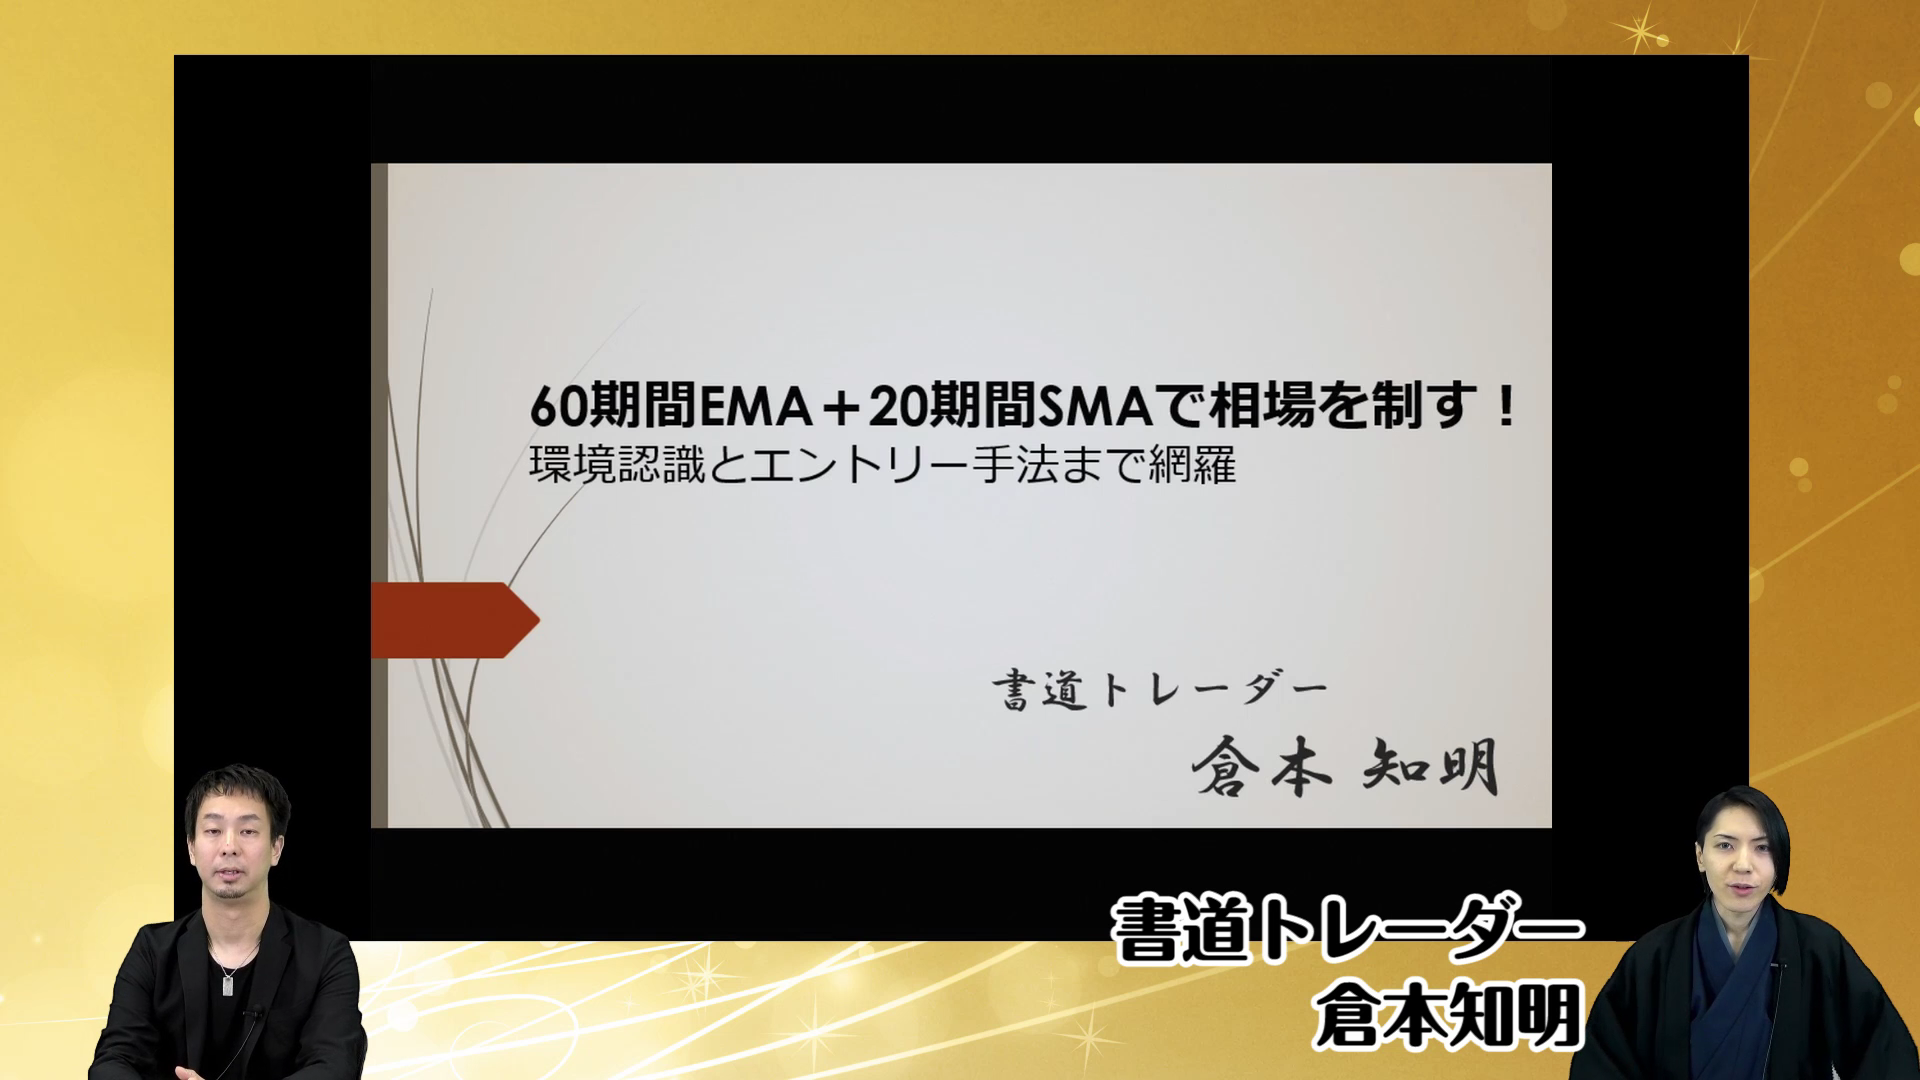
【Video】Mr. Tomoaki Kuramoto explains a powerful combination analysis method of 60 EMA and 20 SMA!
We spoke with calligrapher-trader Tomoaki Kuramoto, who taught us a usable method to grasp the overall market trend using a combination of the 60EMA and 20SMA. (Interview: FX攻略.com Editorial Department, Takeuchi Musashi)
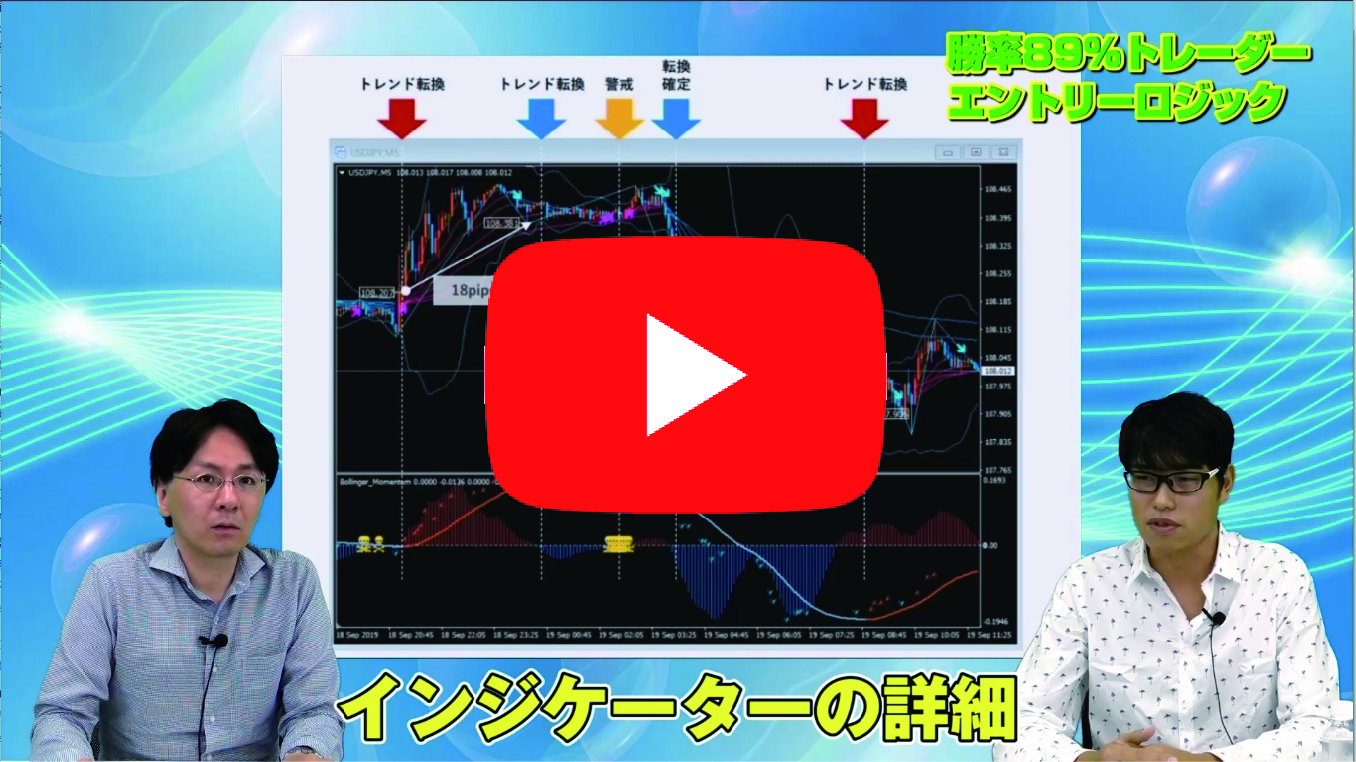
What you can learn from this video
In this video, you will learn the following:
- The role of the 20SMA
- The meaning of using EMA and SMA together
- How to identify rebound points
- The combination of 4-hour, 1-hour, 15-minute, and 1-minute charts
- Where to place stop-loss and take-profit
● Video: 7 minutes 26 seconds
Tomoaki Kuramoto’s profile
A trading professional who finds commonality between the artistry of calligraphy—balance of characters, depth of strokes, size of characters, use of paper margins—and chart construction as a trader.
A word from the editor in charge, Kakuuchi

If you aim to establish your own method or conduct concrete verifications, it helps to have a sample of professional techniques at hand.
The method explained in this video for judging the market using the 60EMA and 20SMA by Tomoaki Kuramoto could be an excellent model case.
How to watch FX technique videos
The section that readers who purchased this article can view (at the bottom of this article) embeds an FX technique video. When you click the play button, the video will start playing.
⇒Learn from 250 yen! Other famous trader FX technique videos are here