

Utilization of the “Visualization Indicator” (Part 222)
Usage of the "Visualization Indicator" (its222)
1. Further evolve the "28 Currency Pairs List Indicator" into an indicator
“8CPVisualization Indicator”to plotUSDJPY.
The “8CPVisualization Indicator” includesOceania version,London version,NewYork version,AnyCP version. This time, we used theLondon version.
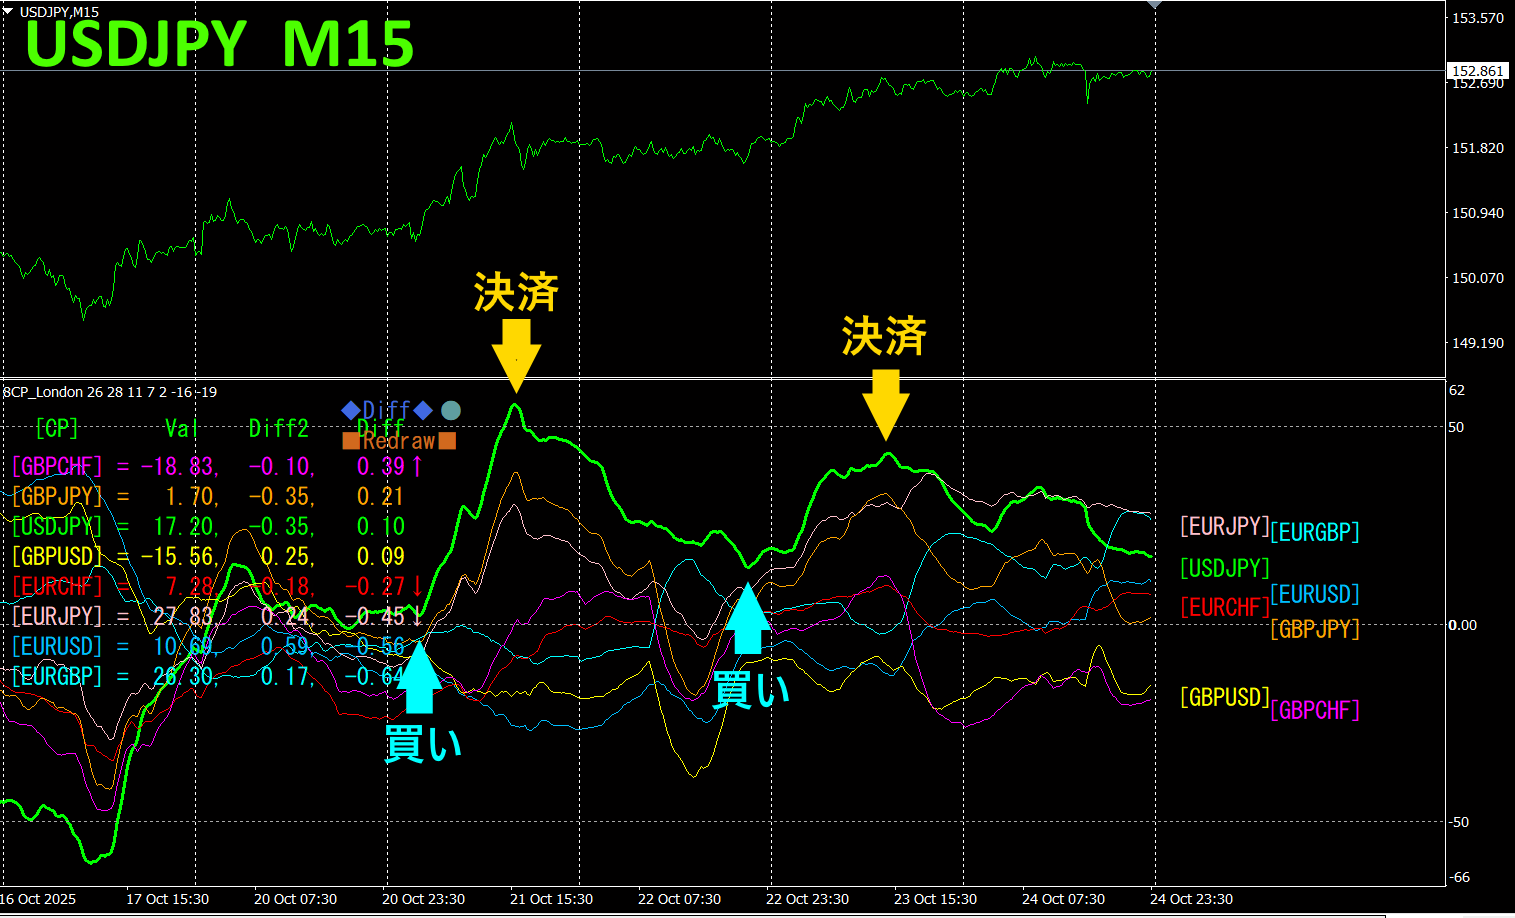
The top half is a 15-minute chart ofUSDJPY. The bottom half is from the “8CPVisualization Indicator”; the green bold line graph corresponds toUSDJPY.
On Tuesday and Wednesday, as the USDJPY chart rose,USDJPY trend rose, so we will trade it on both occasions as a buy. The profit is130pips + 90pips, totaling220pips.
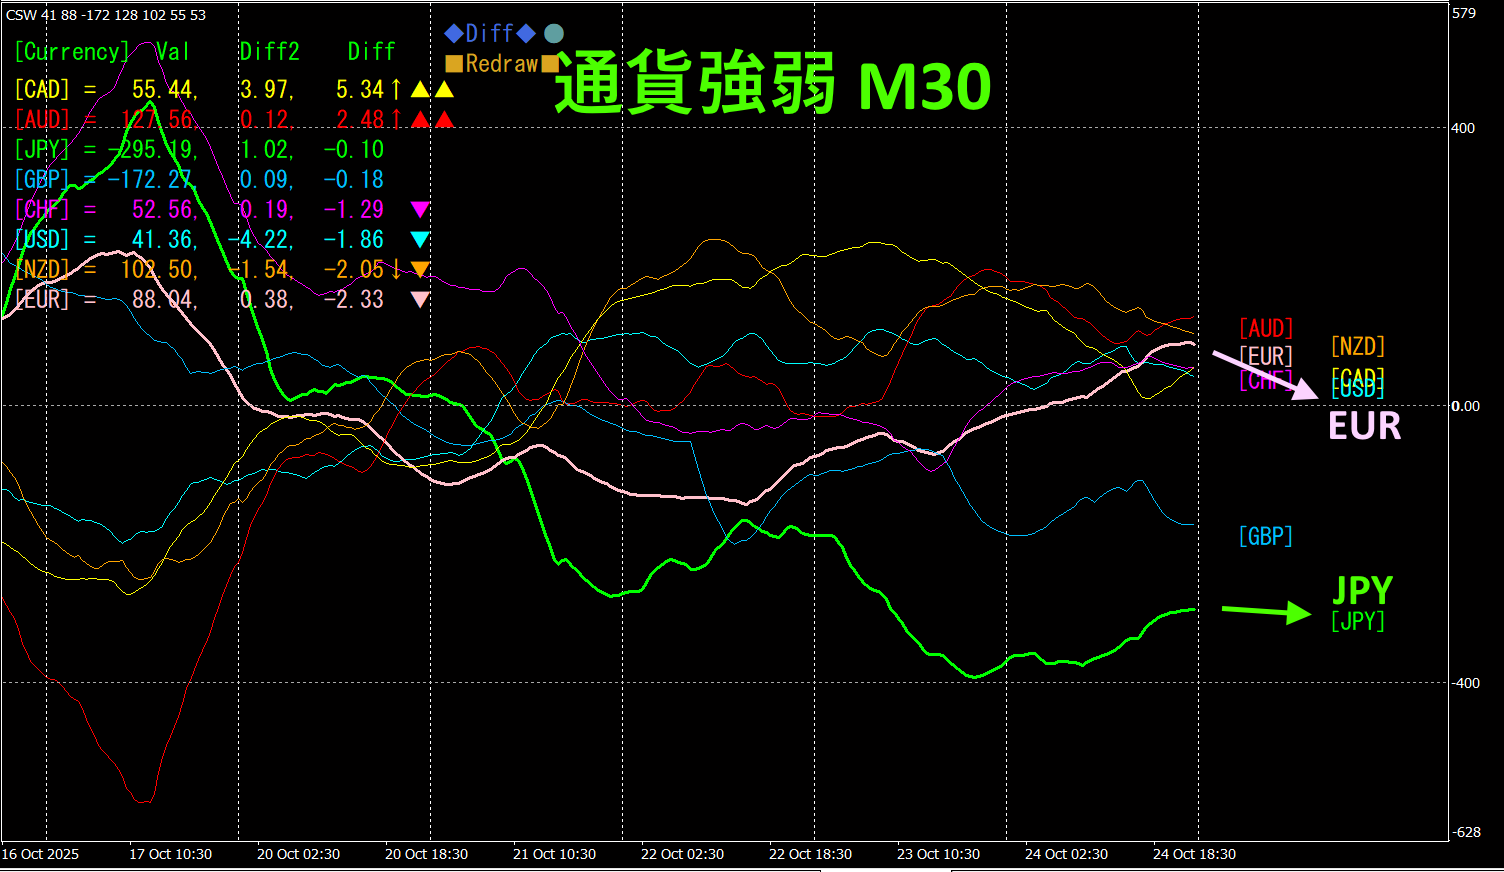
Currency Strength/Dweakness Graph
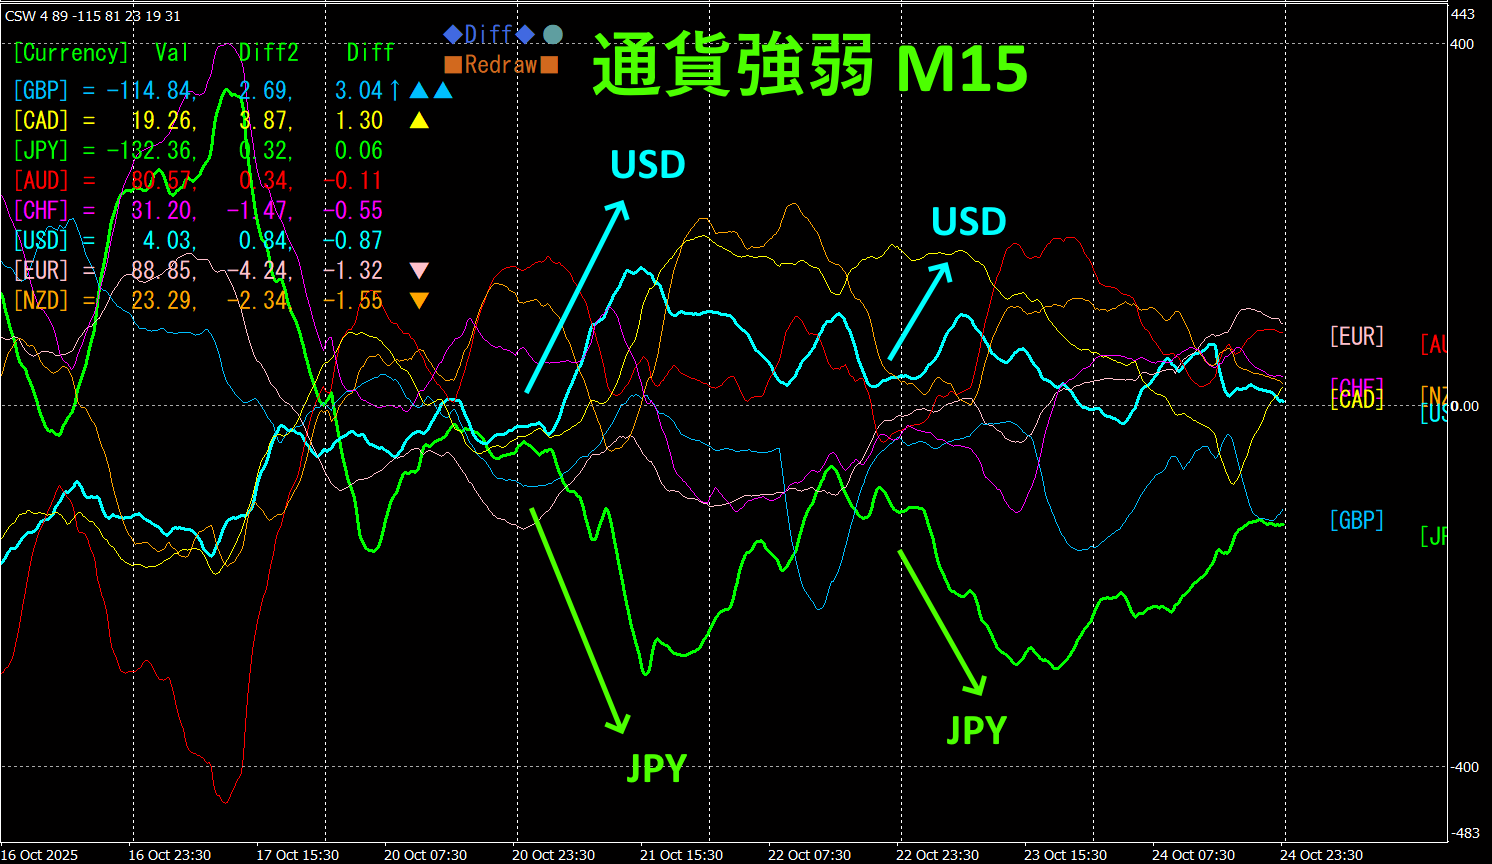
Looking at the 15-minute currency strength graph, USD and JPYUSD andJPY relationship is that USD >JPY, so focus on the parts where USDJPYUSDJPY is expanding and trade the buy. The pair with the strongest growth and inverse correlation currently should be traded accordingly, and results will follow.
“Aim for currency strength reverse correlation!”is FX's rule.
If you use “TrendLine-EX, you can automate entry and exit at diagonal trendline breaks. You can leave it as is, making trading easy. “TrendLine-EX is a semi-automatic EA that can short around a trendline break and auto-close on an upper breakout.
2. Best SelectTry the Indicator
The below image is a screenshot from2025 year10 month21 day 15:21 (JST).
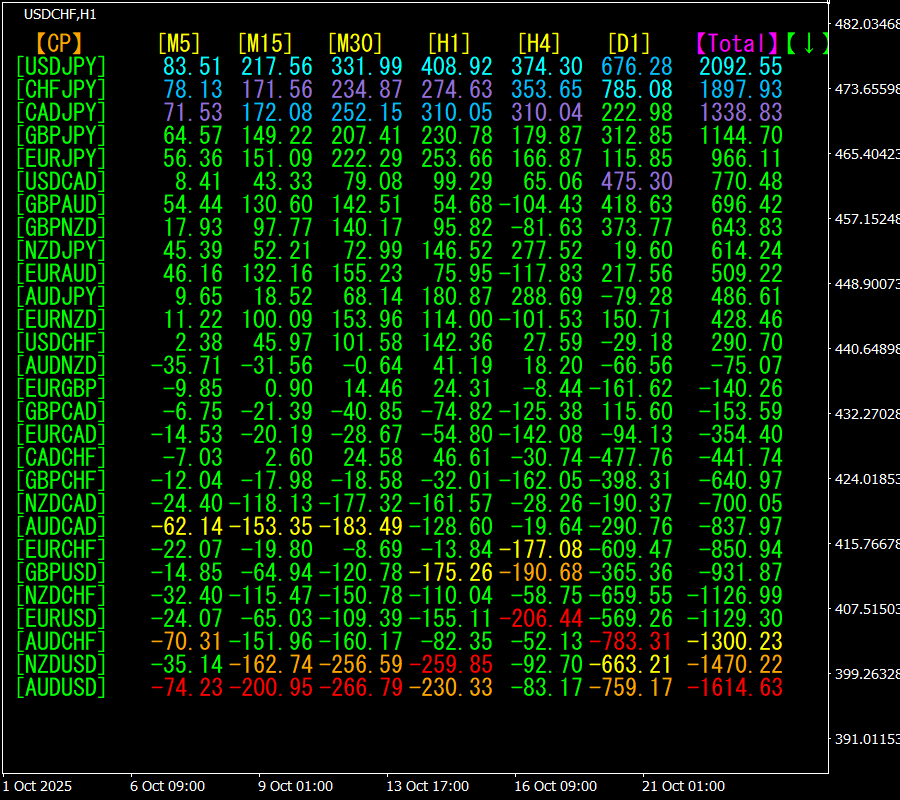
[Total]Ranks in descending order by value. At the very top,USDJPY is displayed in blue on all timeframes.Total value is2092.55, a positive number.USDJPY shows an uptrend.
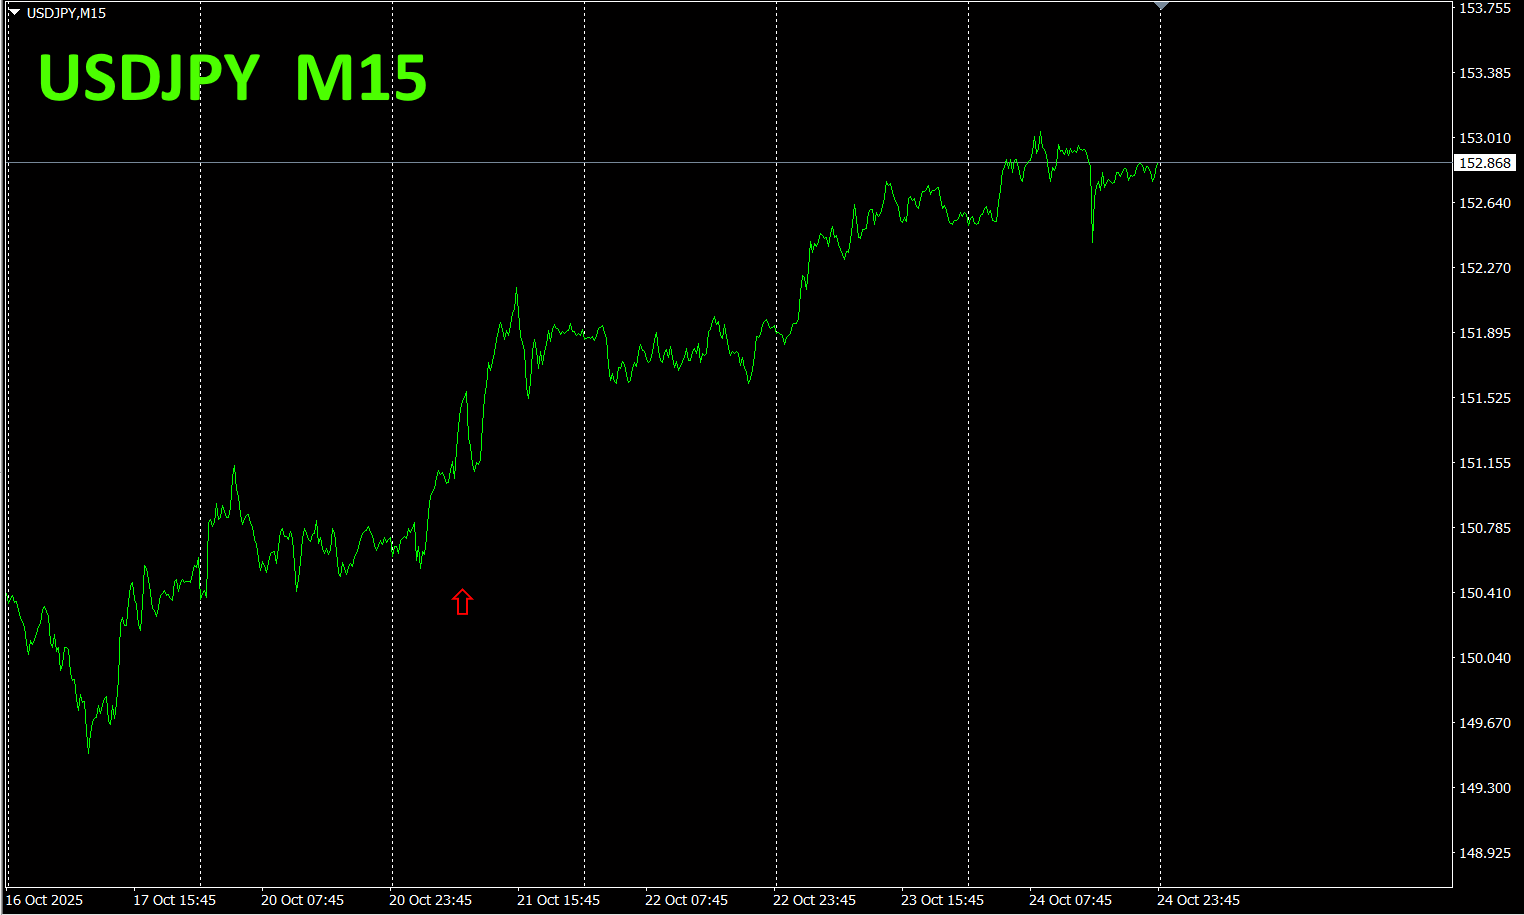
Now, let's look at the USDJPY chart.
The red arrows indicate the moment the screenshot was taken, capturing the surge.
The “28 Currency Pairs indicator Best Select allows you to easily identify which currency among 28 pairs is showing the strongest current trend. It also indicates with numbers and colors whether you should trade now. It is an excellent indicator to judge all currency pairs at a glance.
The “28 Currency Pairs Best Select indicator”

https://www.gogojungle.co.jp/tools/indicators/35128
3. 2021 year5 month to present EURJPY movement, what happened?
In year5 month, we started watchingEURJPY movements.
To view the overall trend, we drawn about30 minutes chart for approximately3 weeks.
Last time, I wrote as follows.
Pink isEUR, green isJPY. In the currency strength chart,JPY >EUR, and as for the direction,JPY andEUR are both down, butEUR is slightly steeper, soEURJPY is expected to continue downwards.
It hardly declined and moved upward.
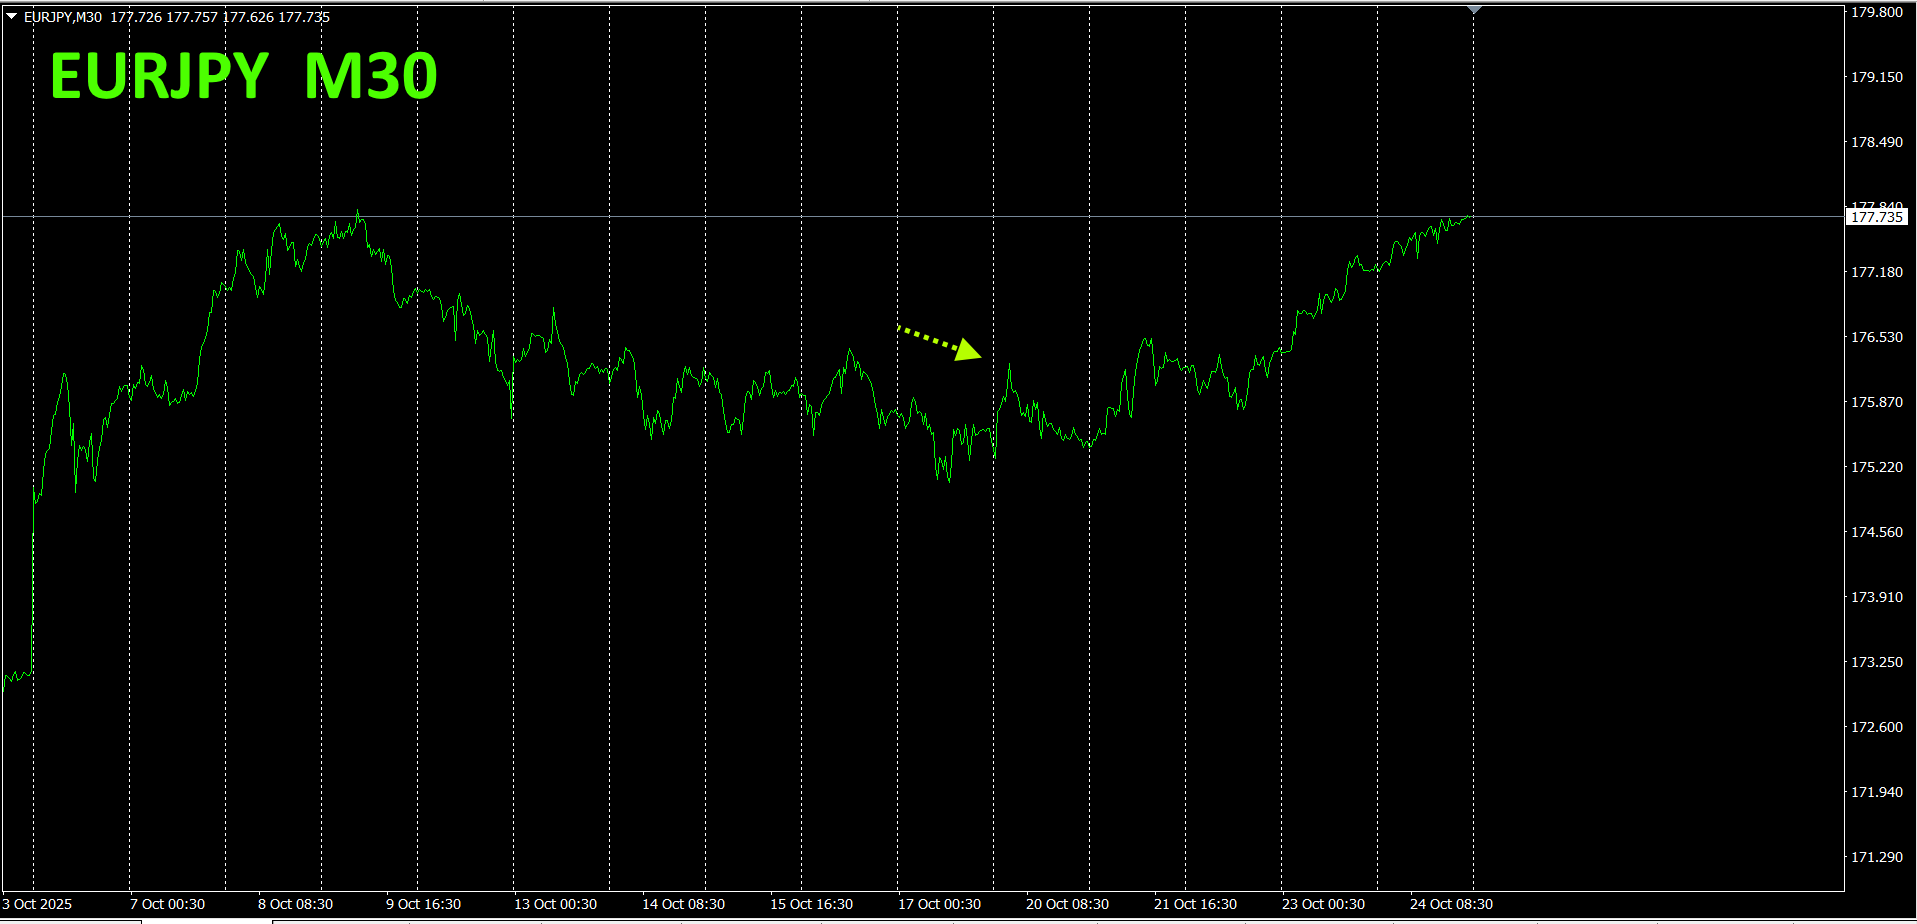
30 minutes of currency strength chart.
Pink isEUR, green isJPY. In currency strength charts,EUR >JPY but looking ahead,JPY will be flat whileEUR goes downward, soEURJPY
4.New IndicatorDual_MACD_Trend_Indicator to tryout
New indicator “Dual_MACD_Trend_Indicator” please see below.
MT4 version:https://www.gogojungle.co.jp/tools/indicators/62199
https://www.gogojungle.co.jp/tools/indicators/62202
An indicator that clearly shows the trend direction with colors. If the color bar isLime, it is a buy, and if it isRed, it is a sell. It is easy for beginners to use. If the bar is green, it indicates an uptrend; if red, a downtrend; if no color, no trend. The color display makes it easy to grasp the trend at a glance.
I installed this indicator on theAUDJPY on the1 hour chart.
The red sell zone and green buy zone are clearly separated, making trading easy at a glance. The overall trend is upward, so you should trade a buy in the white circled area in the above diagram. Following the indicator’s colors, buy when green. This allows you to focus on the portion where the trend will extend and earn profits with ease.
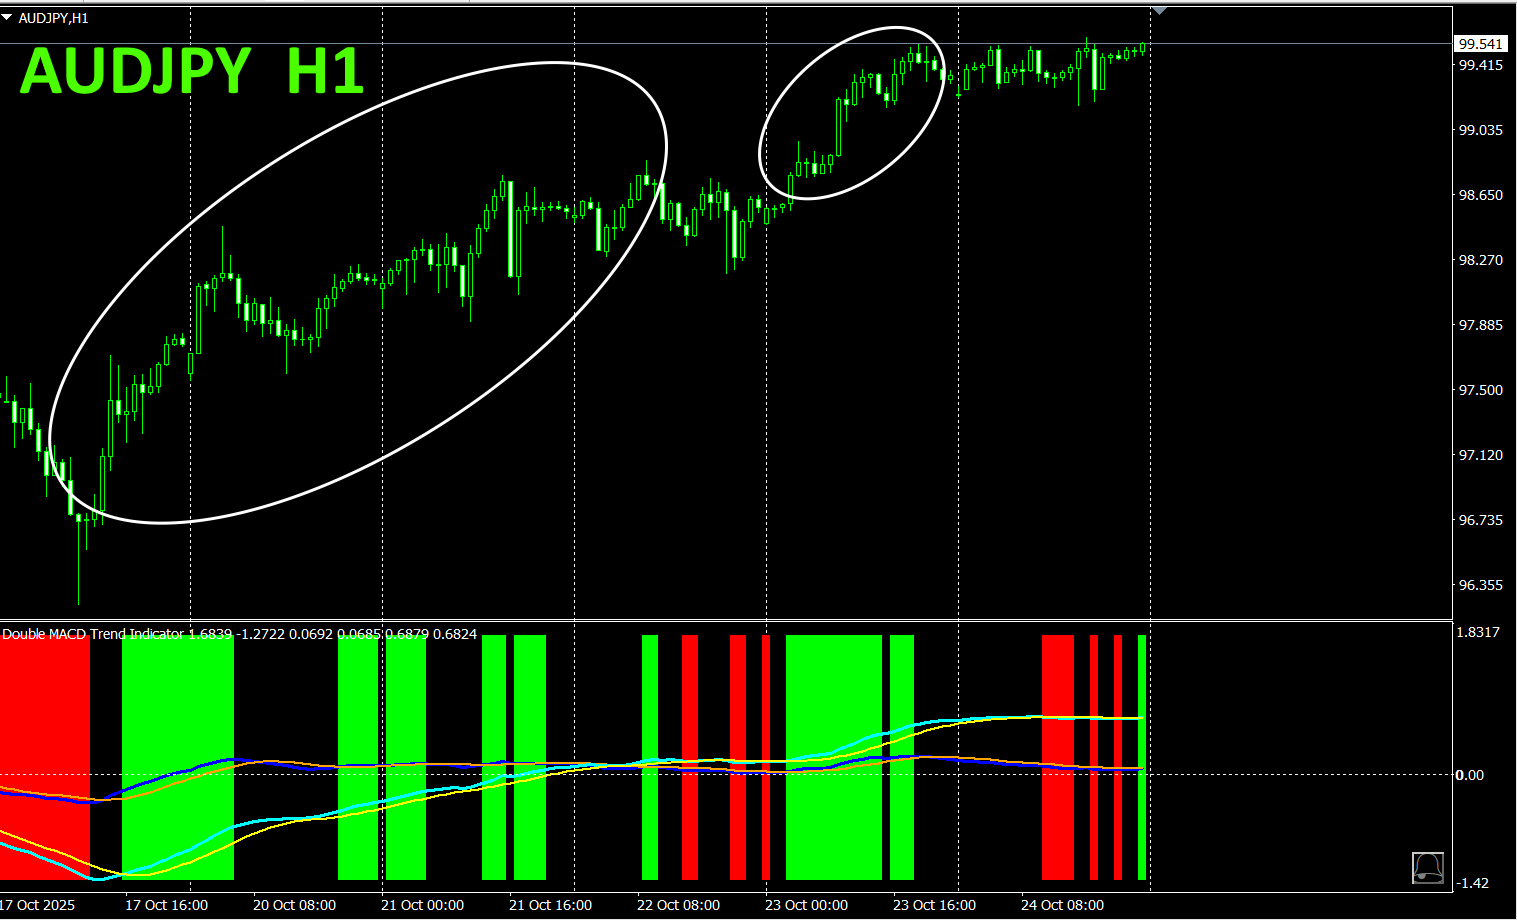
With “Dual_MACD_Trend_Indicator”, simply follow the rule: buy in green zones, sell in red zones, and do not trade otherwise.
WithDual_MACD_Trend_Indicator, you no longer have to wonder about the trading direction.
5.
“Hyper-CSW” has been released
“Hyper-CSW” is a high-performance indicator that visualizes the strength of the eight major currencies at a glance. It records the strongest currency and score for the past10 bars on the currently displayed timeframe, and accurately captures trend durability and turning points. Additionally, it supports multi-timeframe analysis displaying currency strength ranking (top44 currencies) with scores in multiple timeframes such as, M15, H1, H4, D1, W1, and more. With highly legible color lines and a separate window display, it empowers you to discern market flow.
For details, please see the following link.
https://www.gogojungle.co.jp/tools/indicators/65082
※ Recommended indicators
“8CFD Visualization Indicator Any version”
https://www.gogojungle.co.jp/tools/indicators/32288
“Toretore Indicator”
https://www.gogojungle.co.jp/tools/indicators/50115
“TrendLine-EX”

https://www.gogojungle.co.jp/tools/indicators/42257
“8C Currency Strength Visualization Indicator”, please refer to the following page.

MT4 version https://www.gogojungle.co.jp/tools/indicators/39150
version https://www.gogojungle.co.jp/tools/indicators/39159
【My other listed items】


