

[October 17, 2025] Testing of the Day/Night Indicator De-Scaling Method (EUR/USD)
This time, I would like to introduce entry points for EURUSD.
Recently, due to updates for the next day swing and preparations for the new work, “Prime Combo Signal – Heaven and Earth Comprehensive Sign –,” posts on Investor Guide+ have not been daily but every 2–3 days. I will do my best to deliver quality content, so I appreciate your understanding.
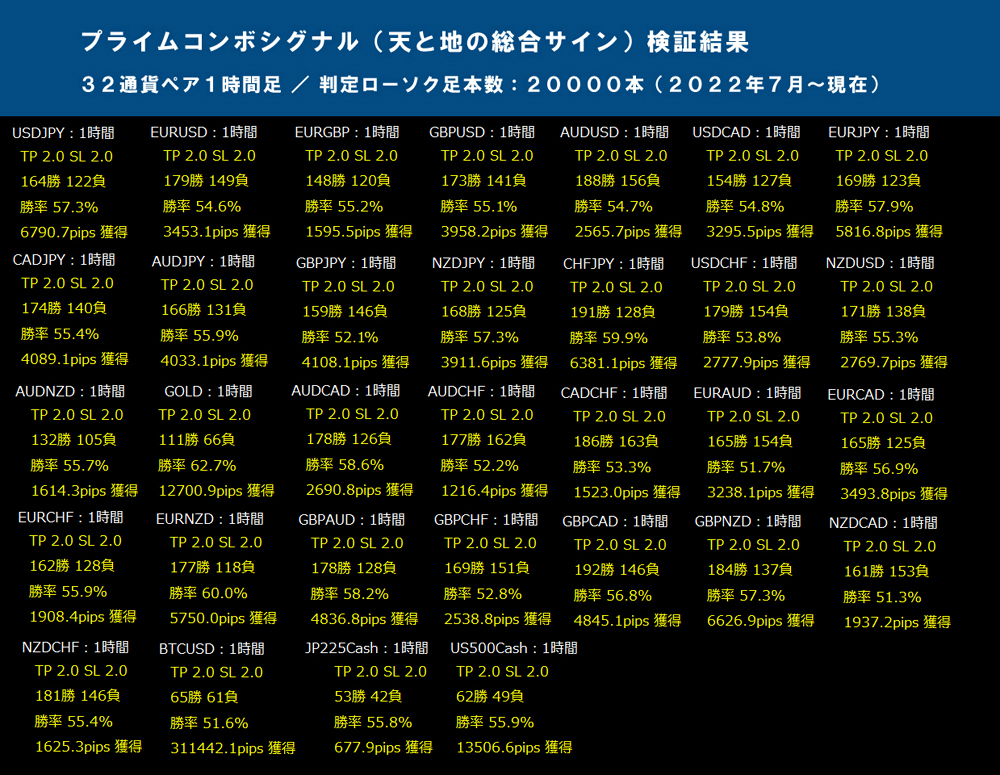
I posted on SNS to briefly introduce the power of the new work, “Prime Combo Signal – Heaven and Earth Comprehensive Sign.” It is completely discretionary-free.


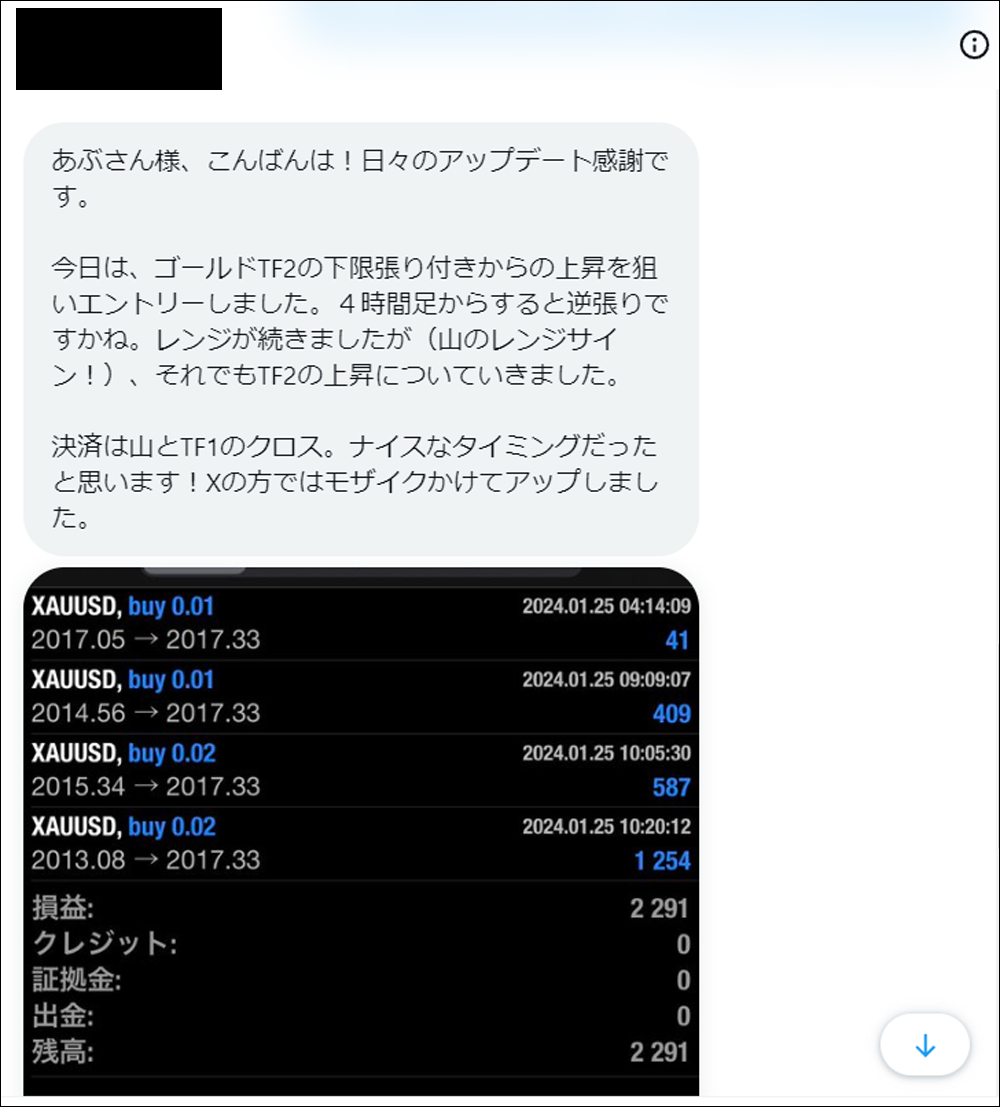
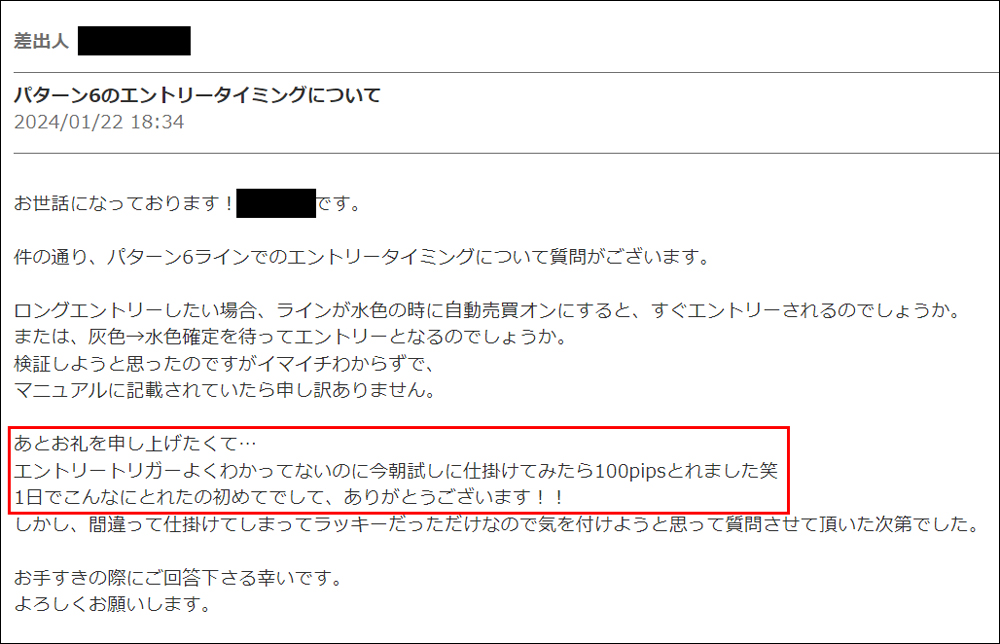
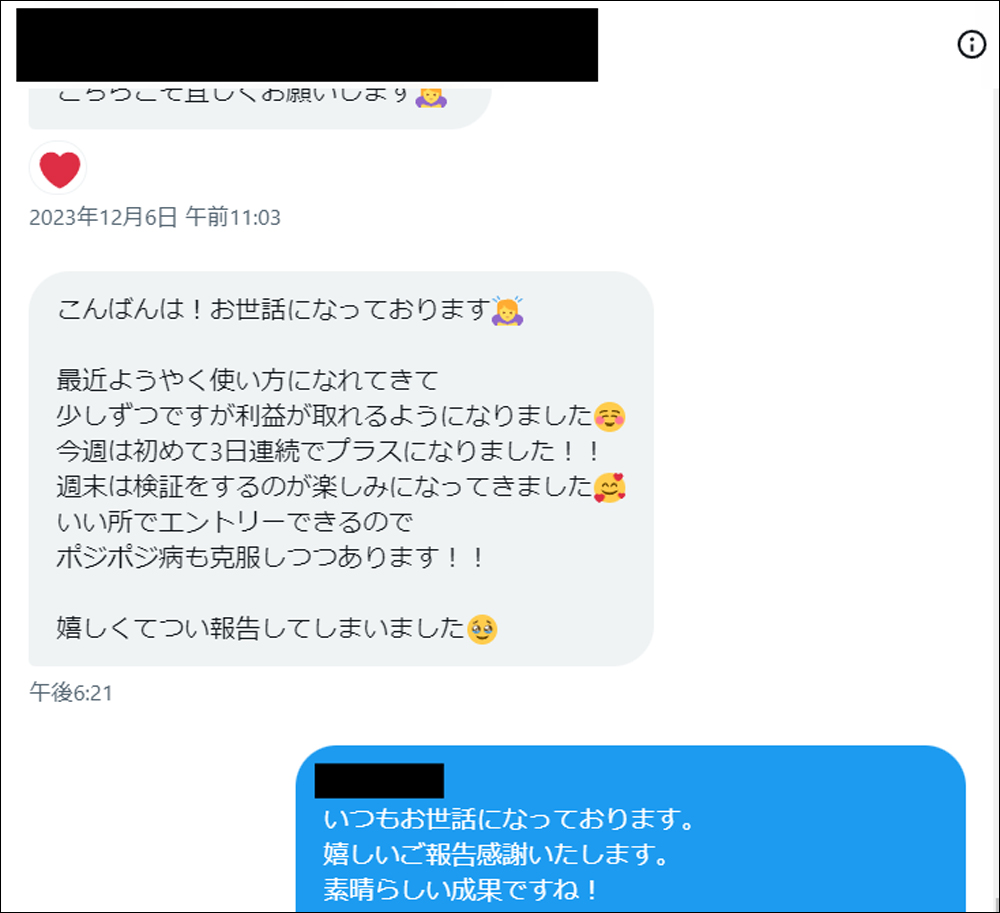


・In articles linked below, we introduce valuable DMs, reviews, posts from users and monitors. We select winning reports and other useful DMs, so I’m sure it will be helpful for everyone. It is updated periodically, so please read when you have time.
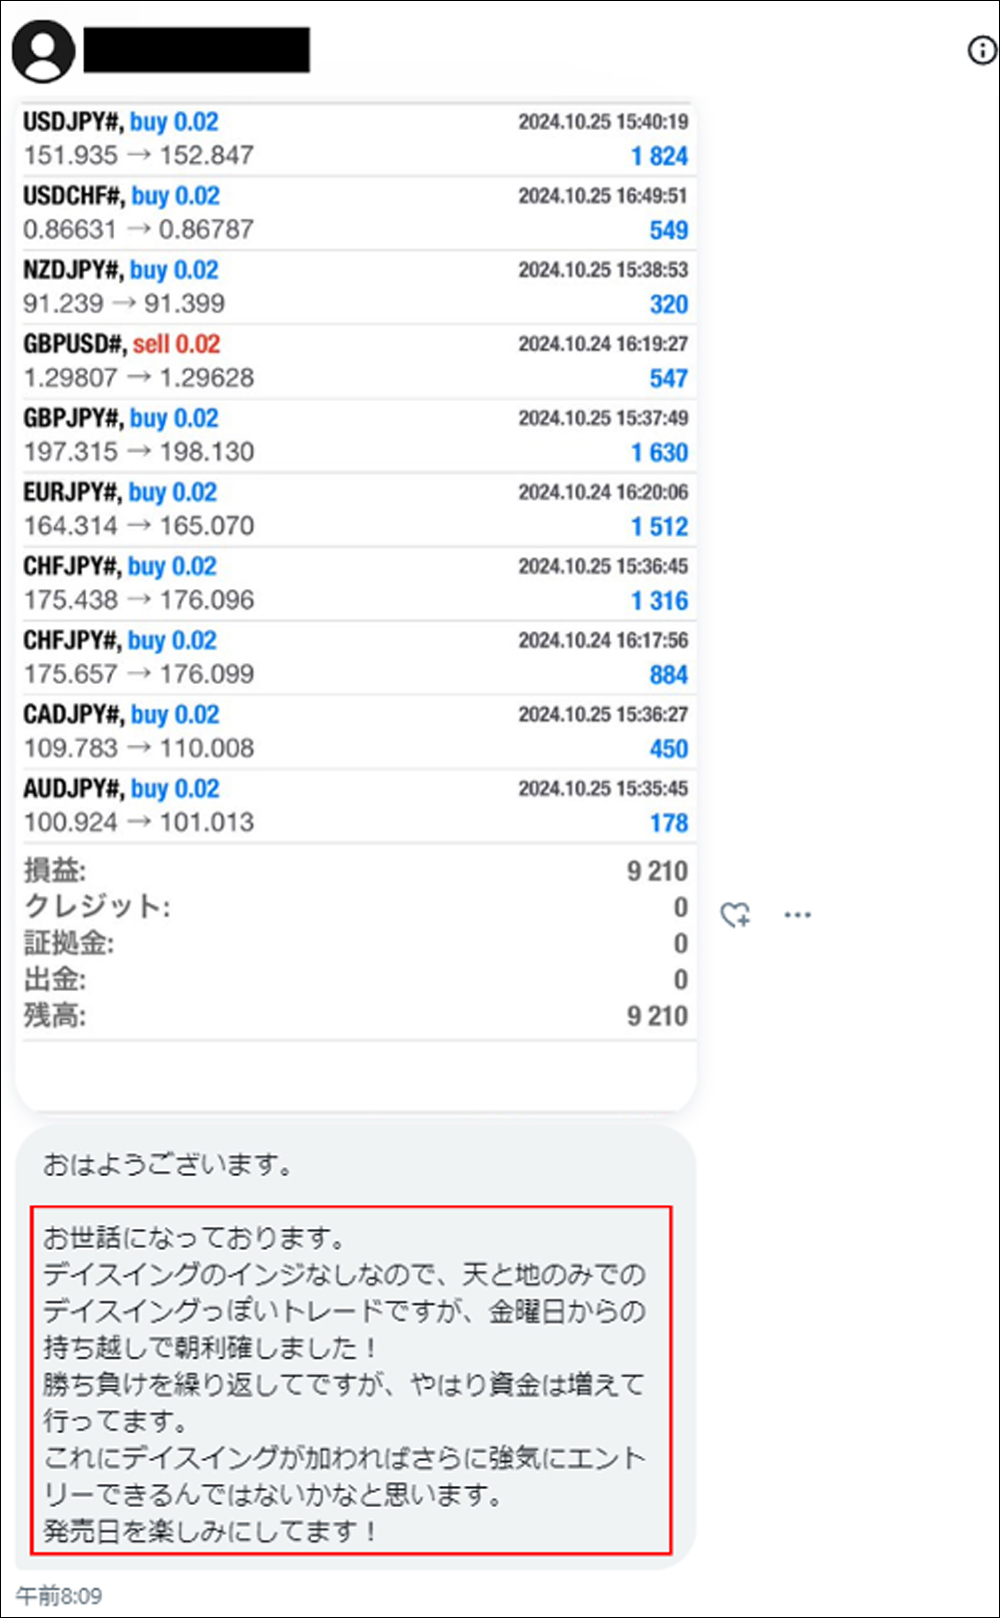
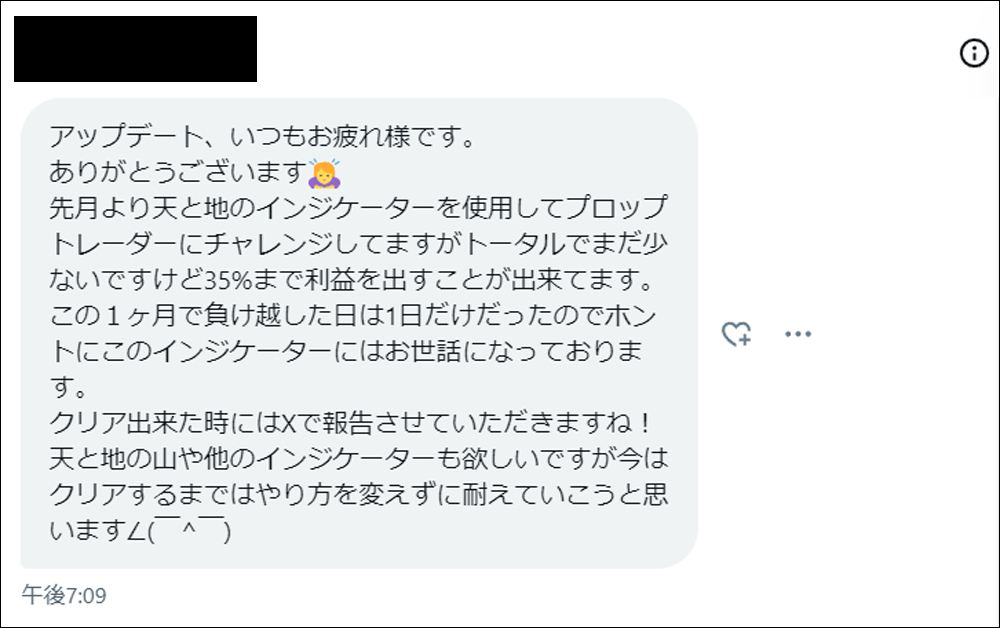
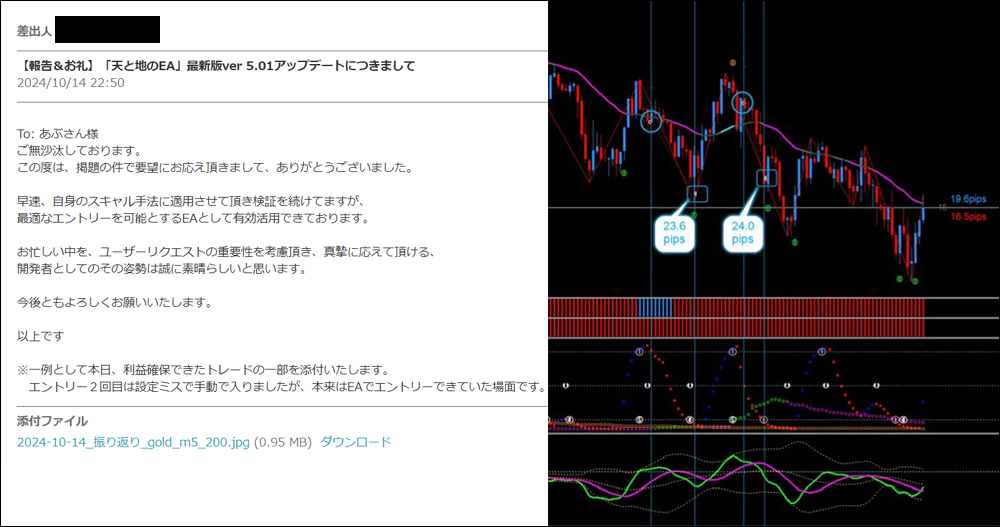
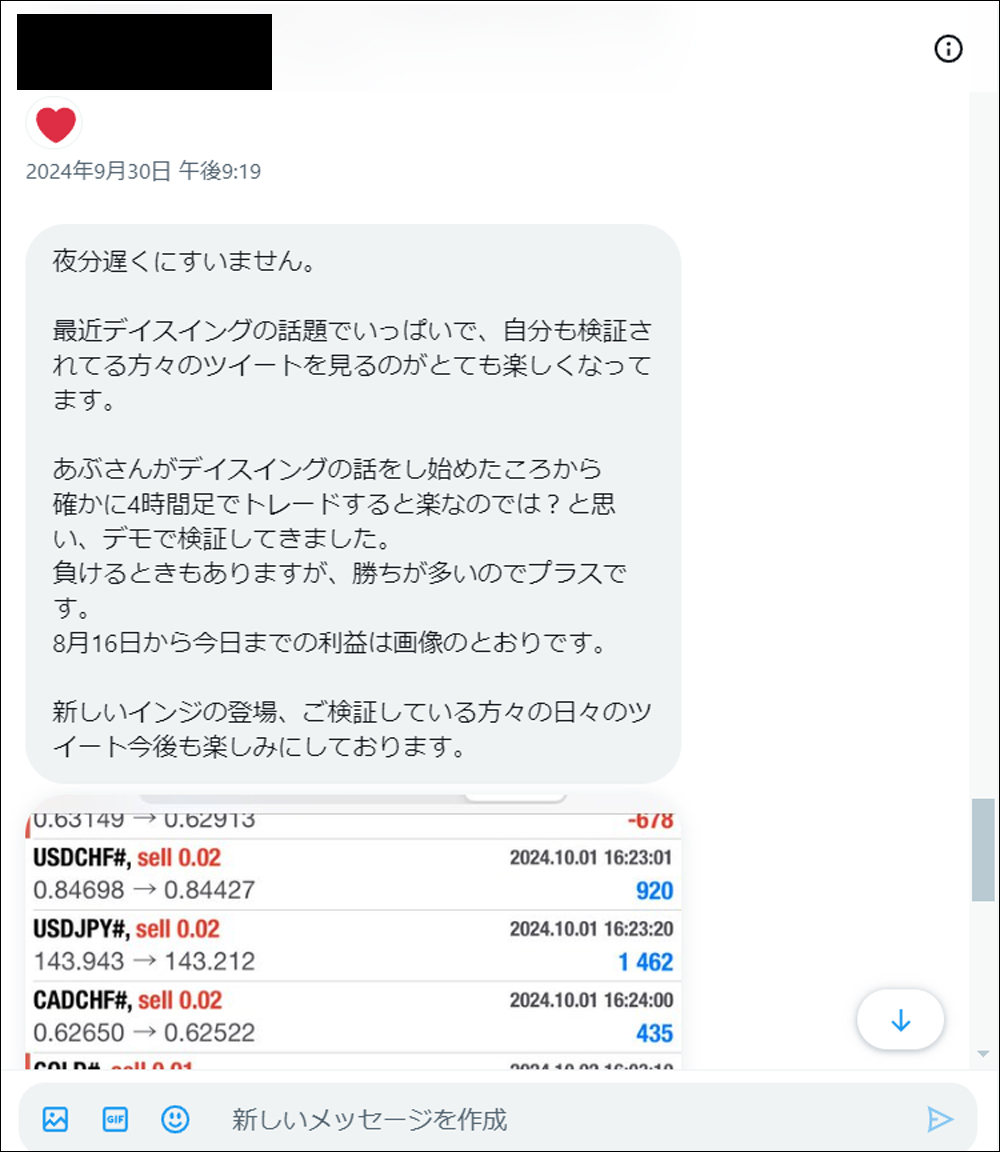
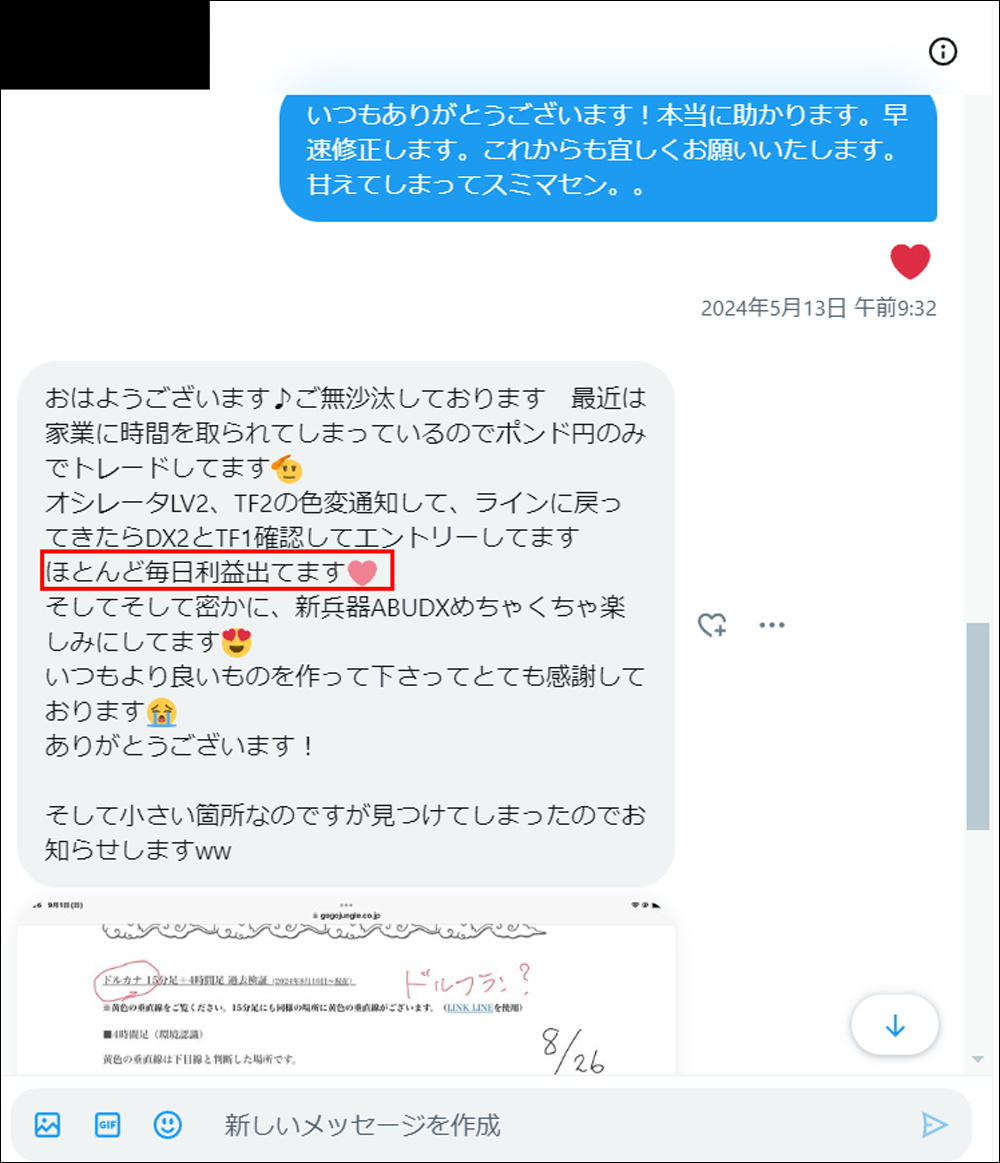
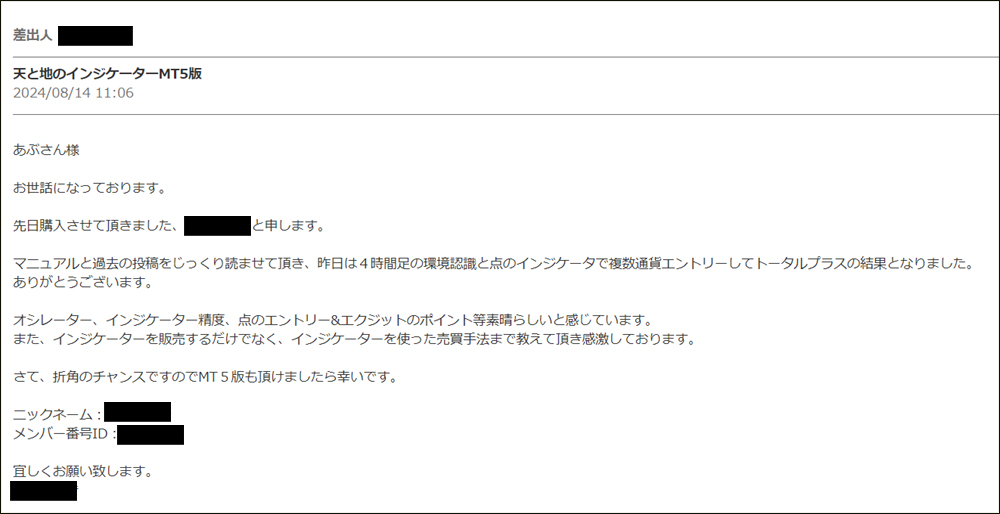
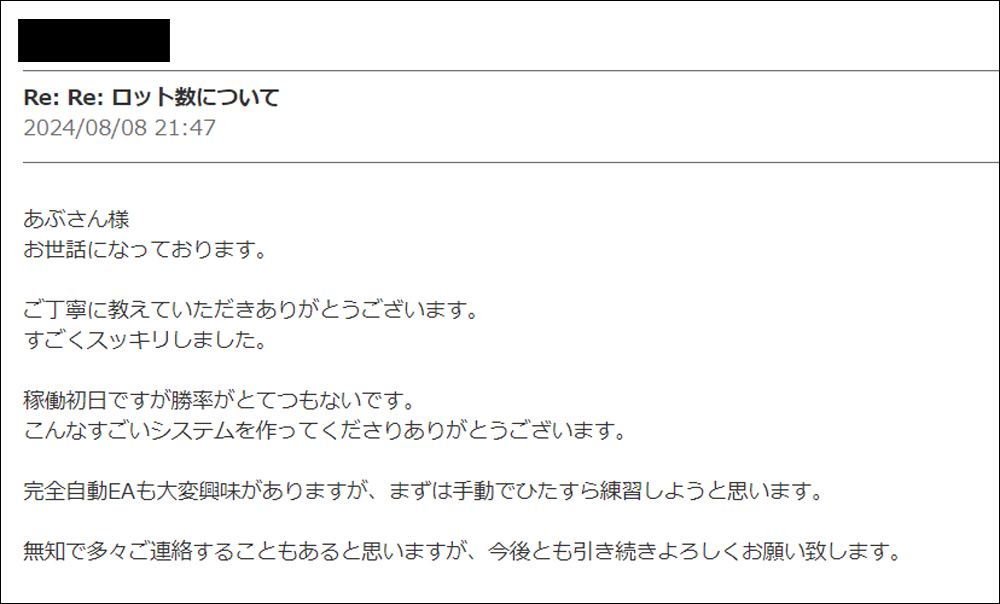
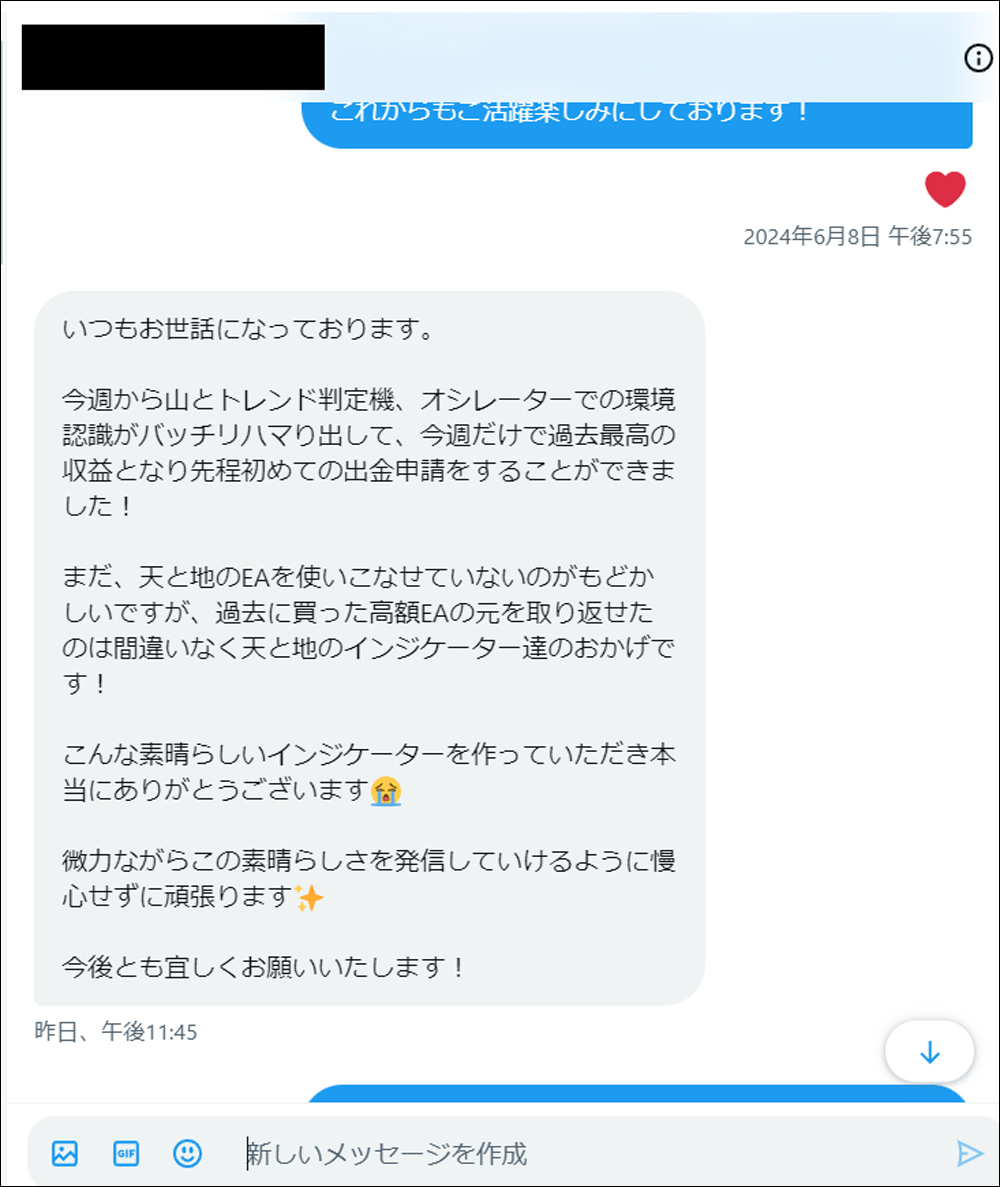
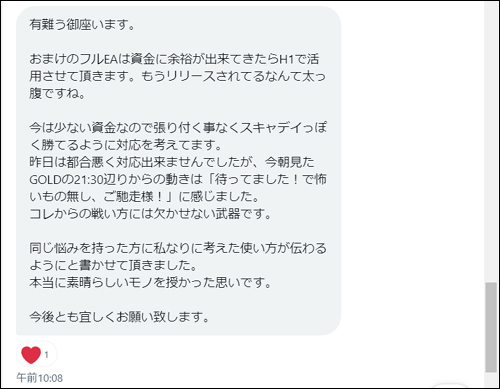
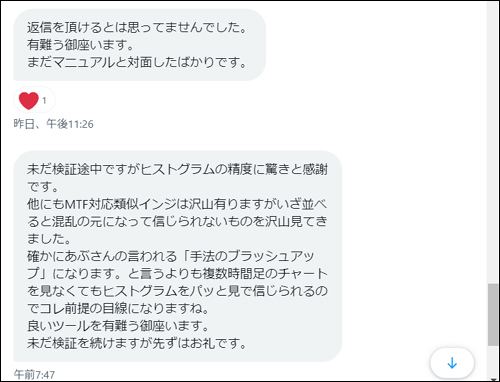
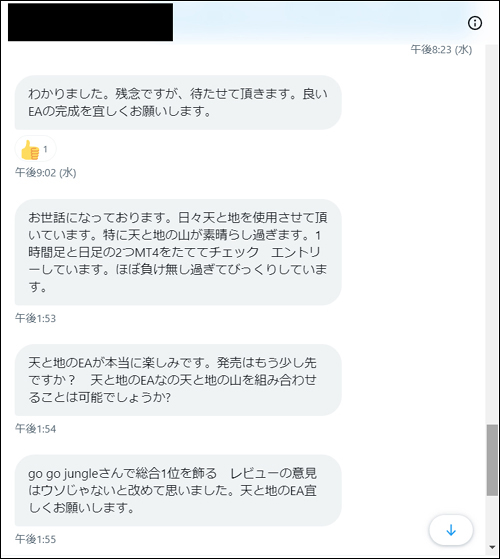
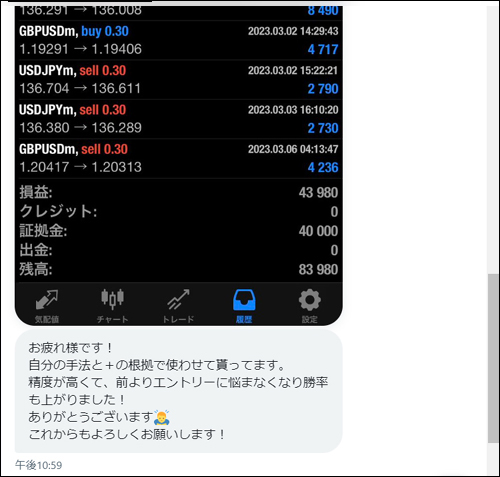
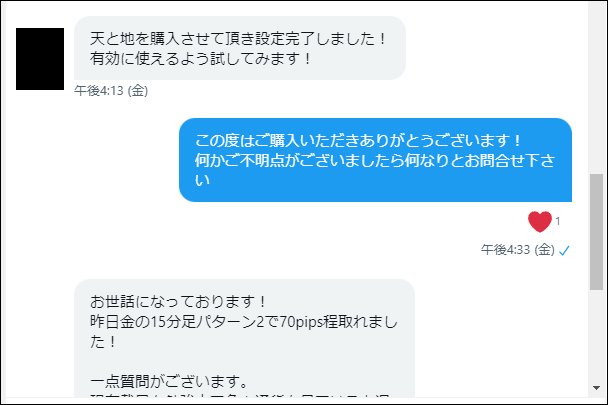
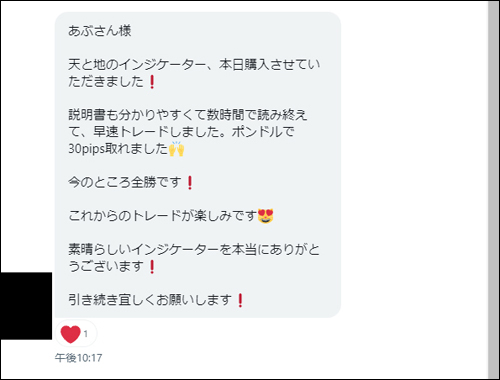
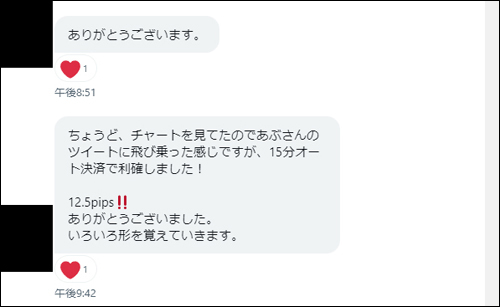
・Feedback from users who actually used Heaven and Earth Indicators (Review version)
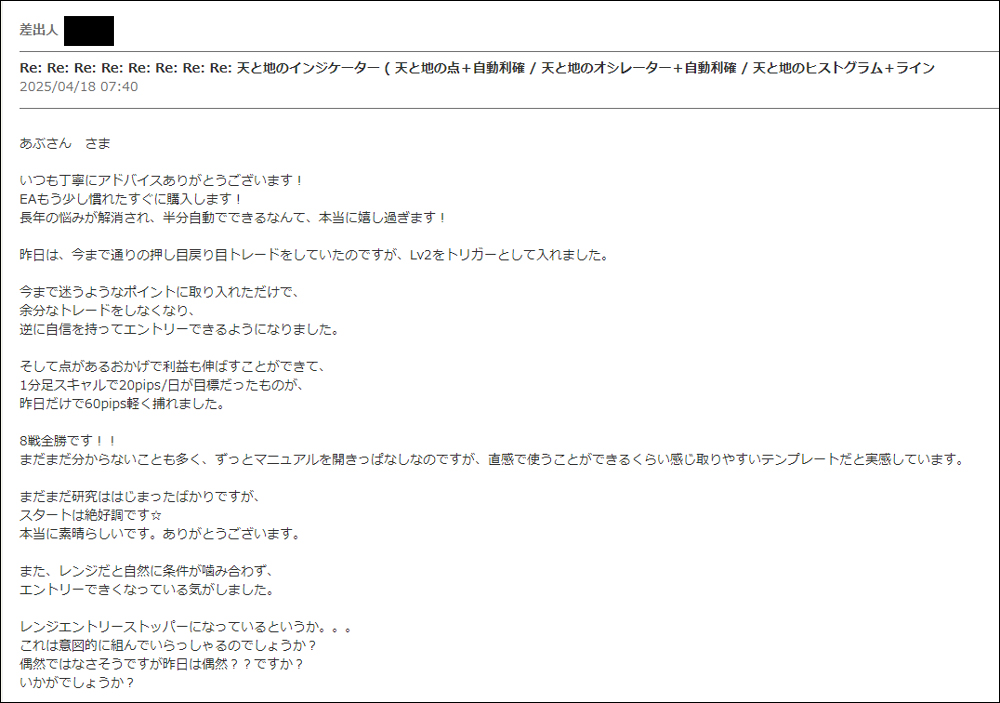
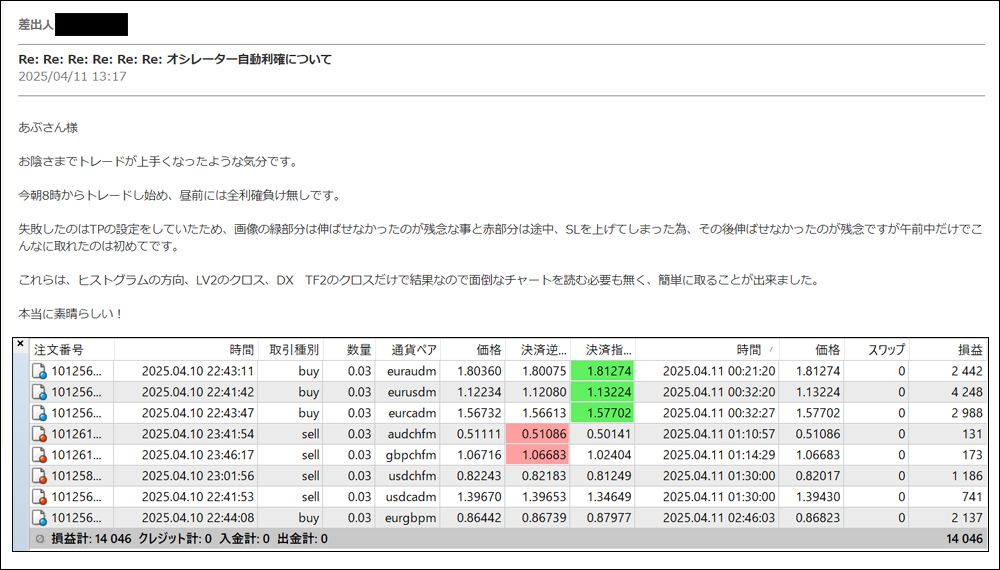
・Feedback from users who actually used Heaven and Earth Indicators (DM version)
・Search “#Heaven and Earth Indicators”
・Introducing posts from monitors who actually used Heaven and Earth Day Swing
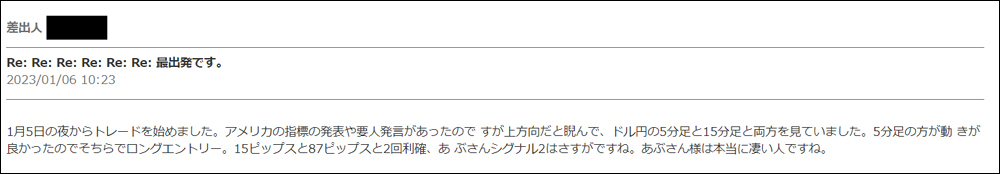
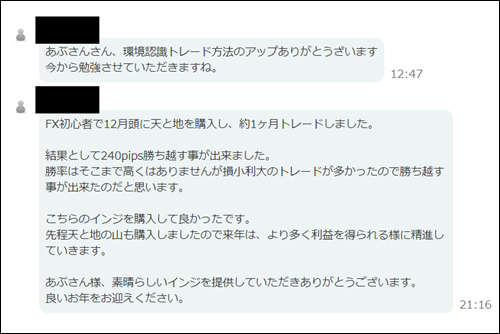
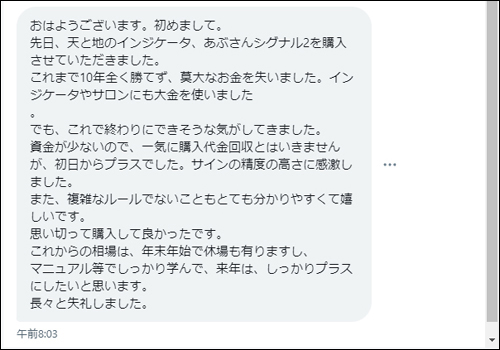
・Feedback from users who actually used Heaven and Earth Day Swing

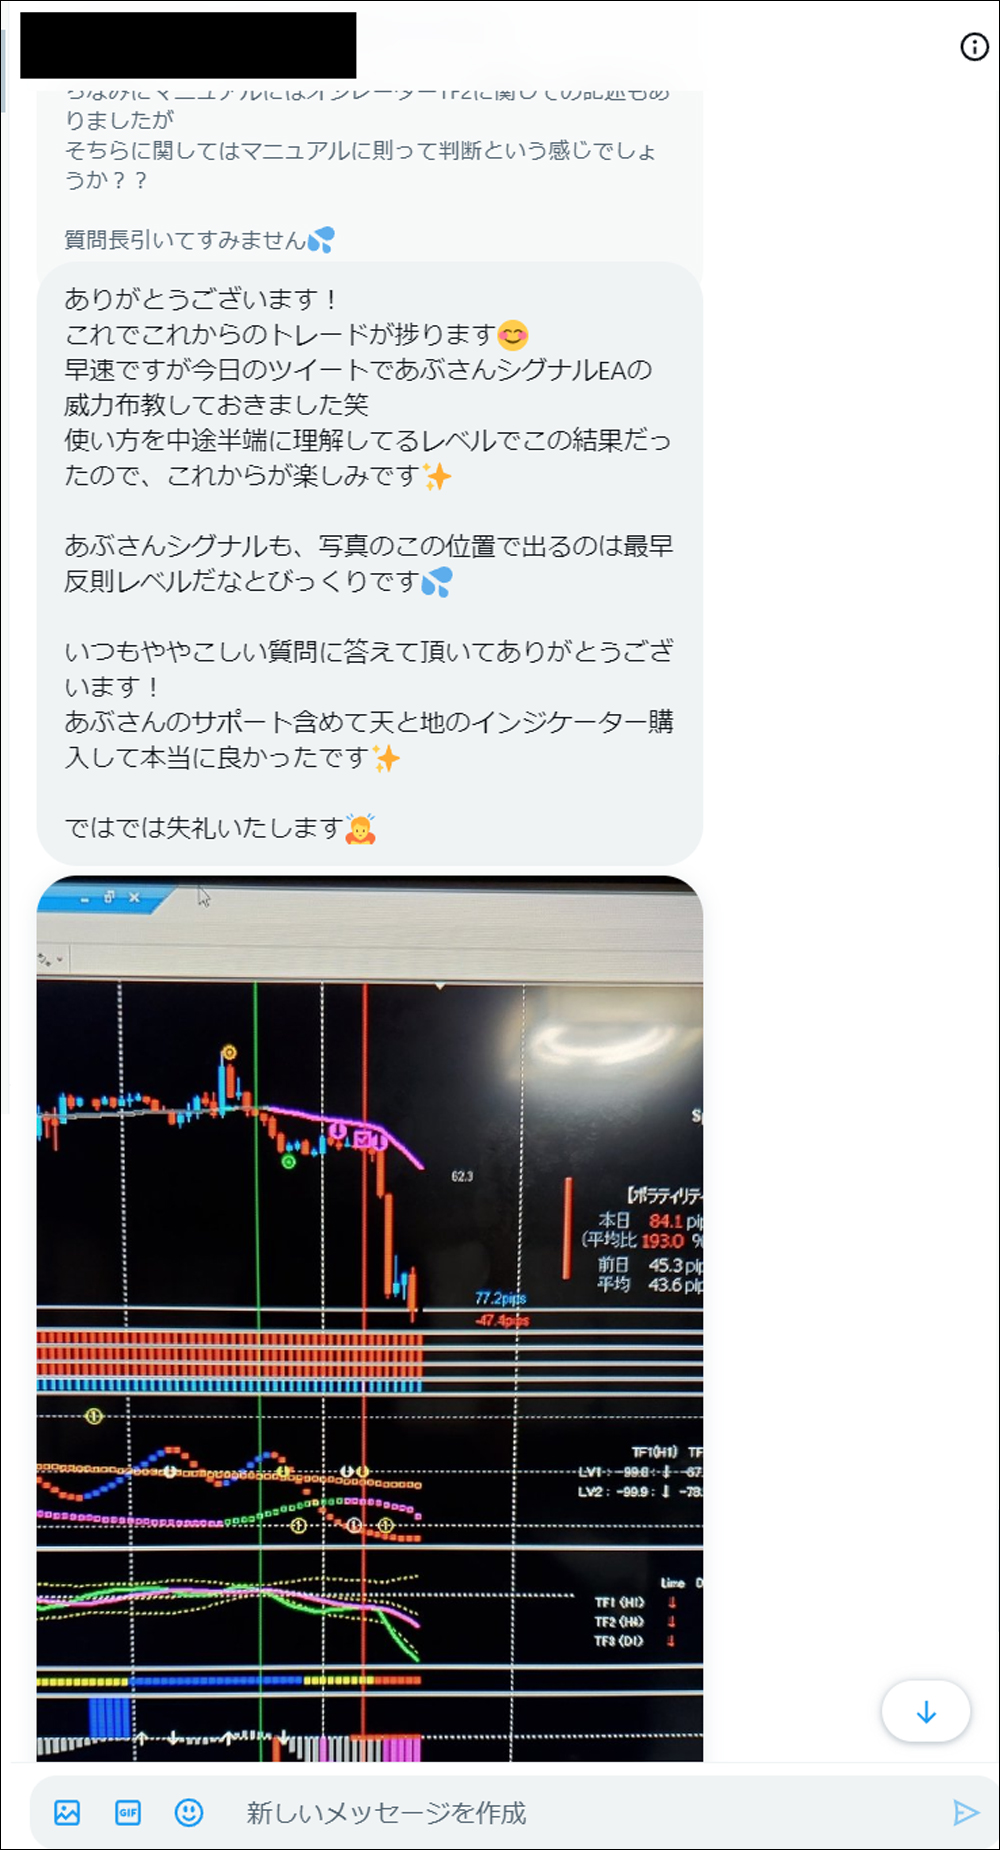
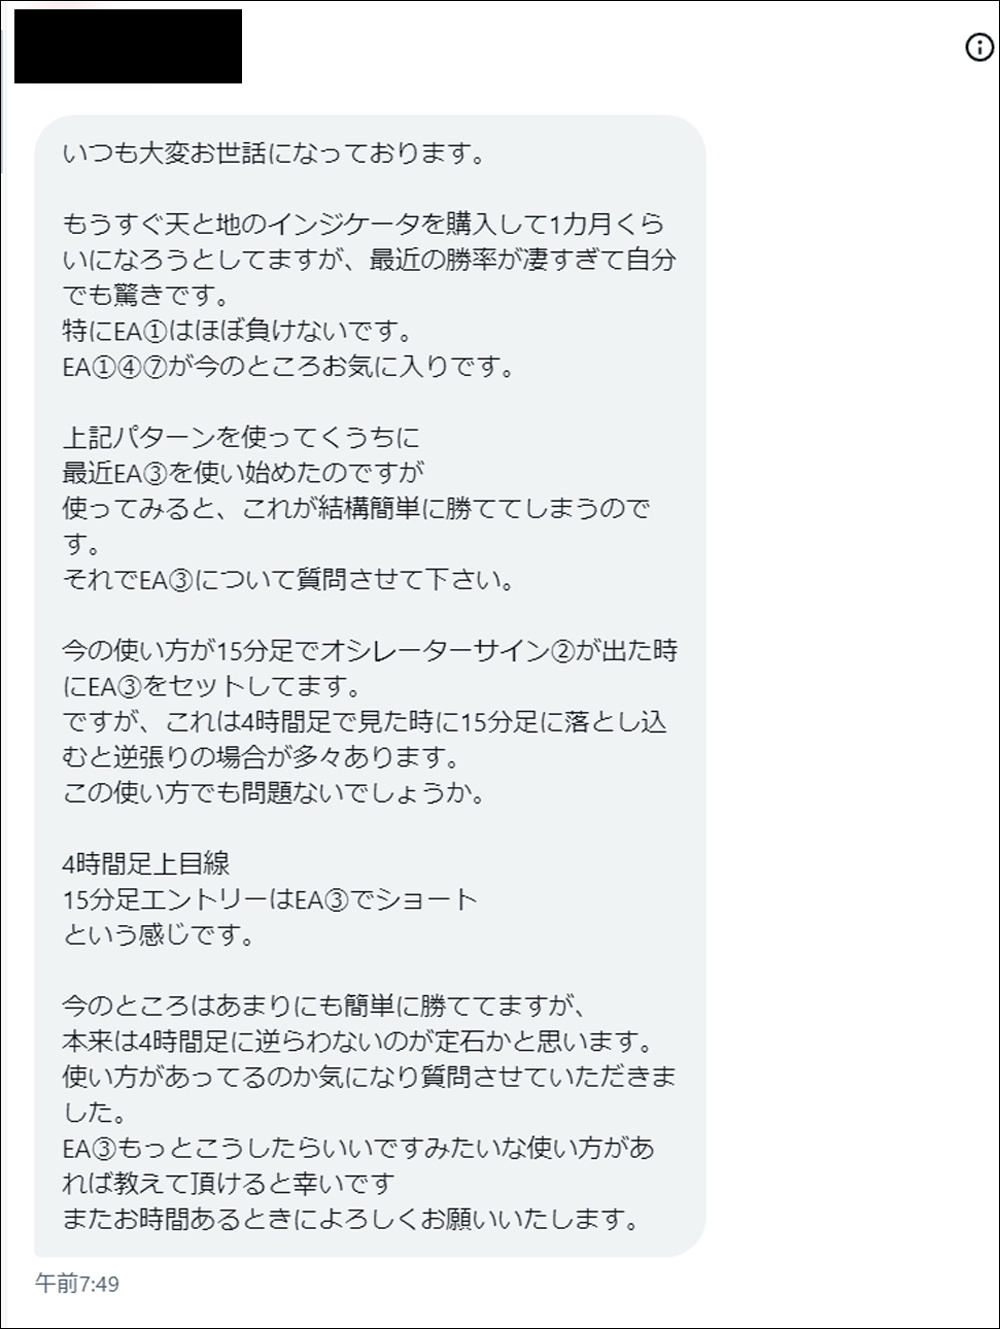
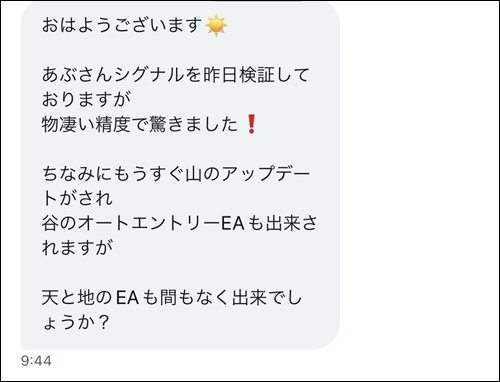
・Heaven and Earth Indicators is a trading method that uses an original indicator developed by me, Abusan, released in February 2022.Thanks to everyone’s support,「GogoJungle Award 2022, 2023, 2024 has been awarded for three consecutive years.
・In this article,“Heaven and Earth Indicators” is used to validate and discuss the“Heaven and Earth Day Swing”Day Swing method. For the basic trading method of Heaven and Earth Indicators, please refer toarticles before August 2024.


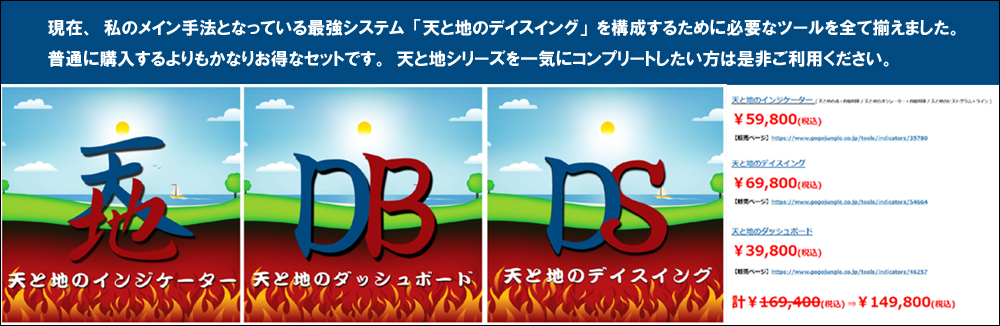
【Limited Release】Heaven and Earth Full Set
【Abusan / Special Video Vol.1】Over 3,200 users are impressed! Are you still trading FX without “Heaven and Earth”? Why not relax while earning?

【Abusan / Special Video Vol.2】Is it skill difference? No, equipment difference. Those who don’t use this will face a huge gap.


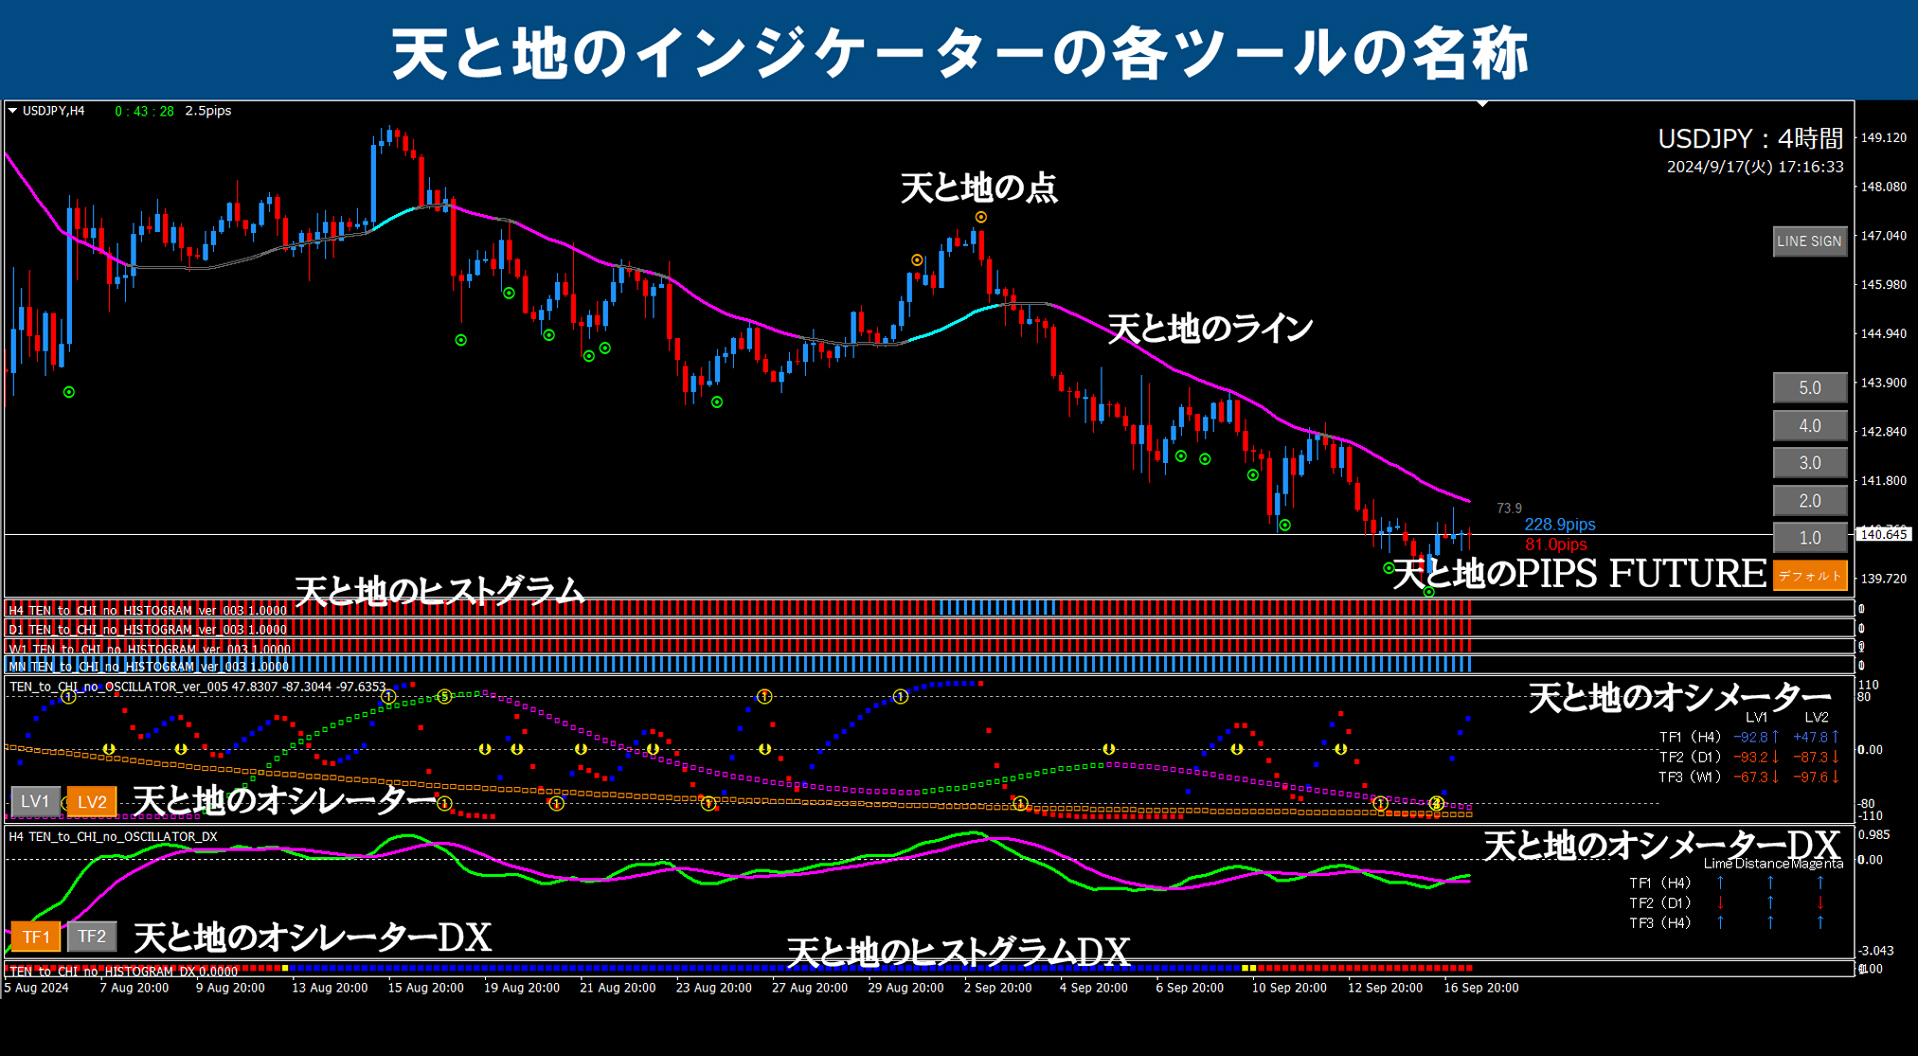
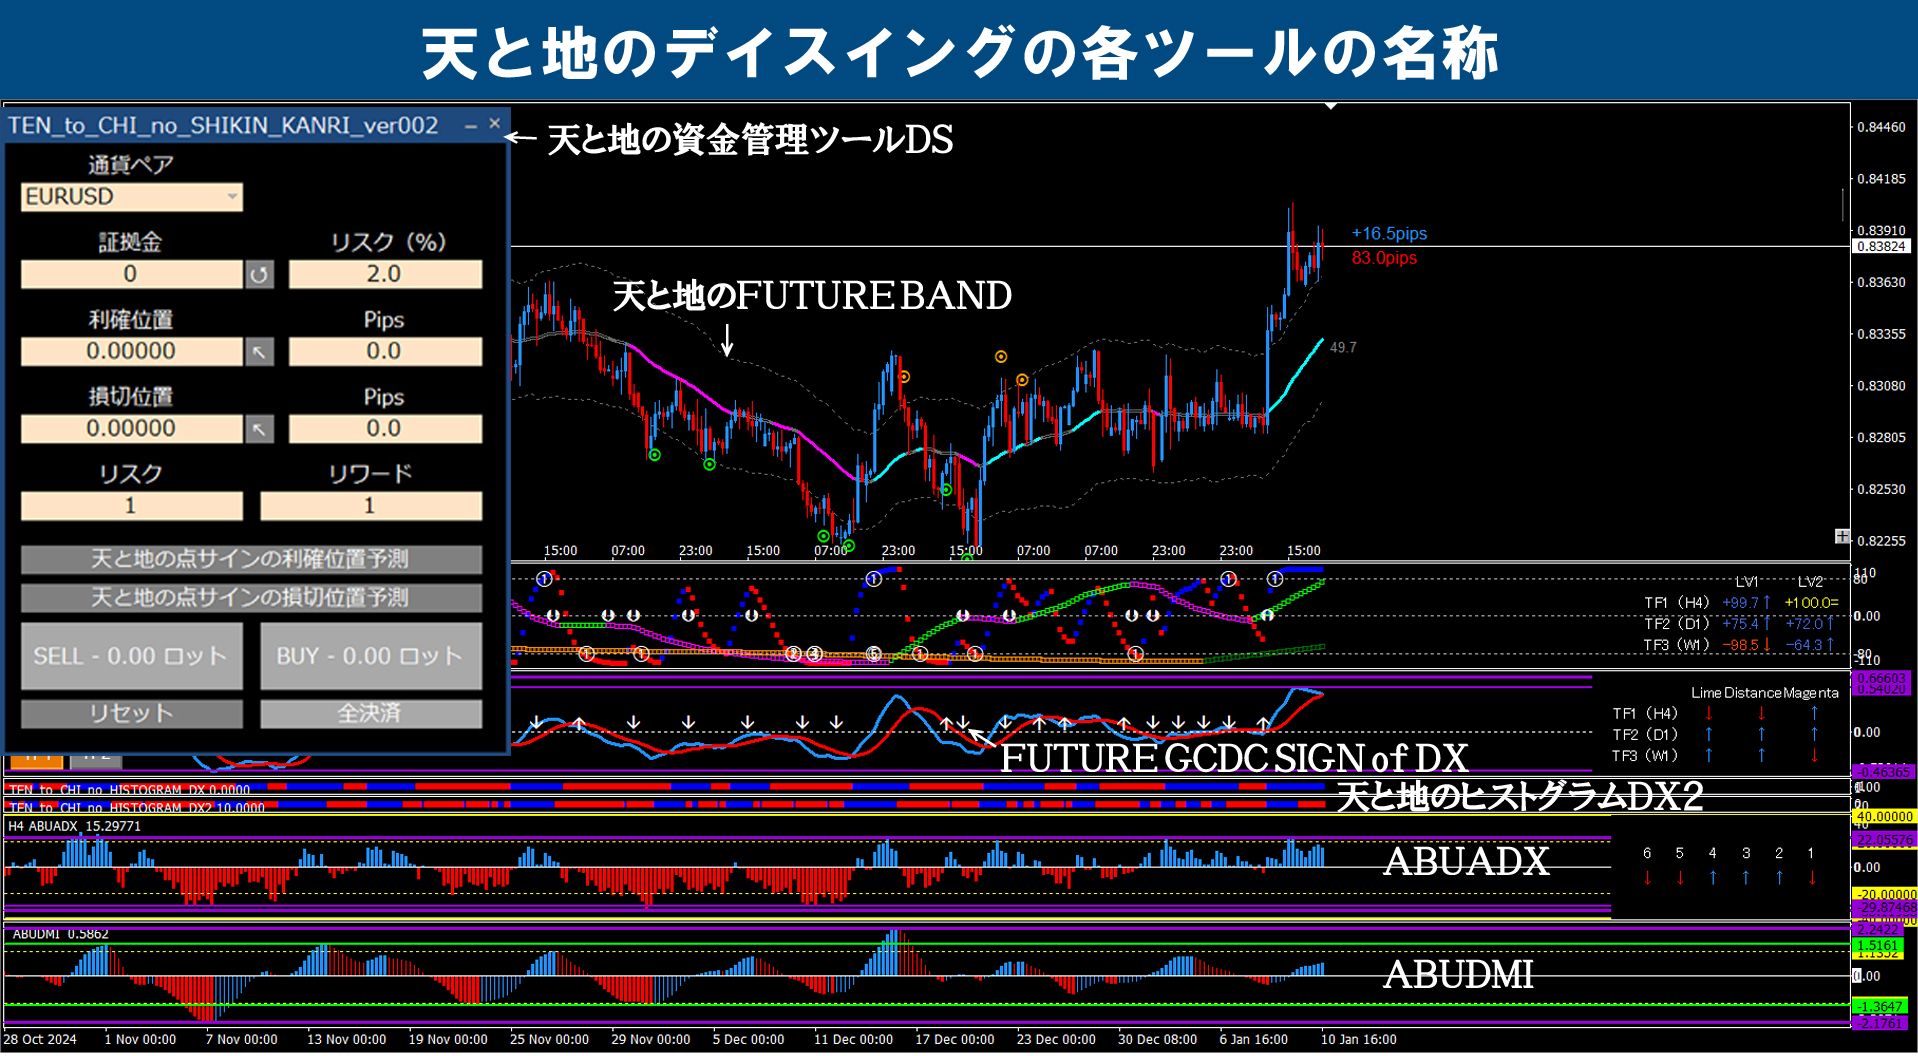
※For terms used on this blog, please refer to the image below.


EURUSD / 1-hour +4-hour + daily past verification
※ Yellow dotted line is drawn in all timeframes at the same place.
※ Yellow circles indicate important points.
※ Clicking the chart will enlarge it.
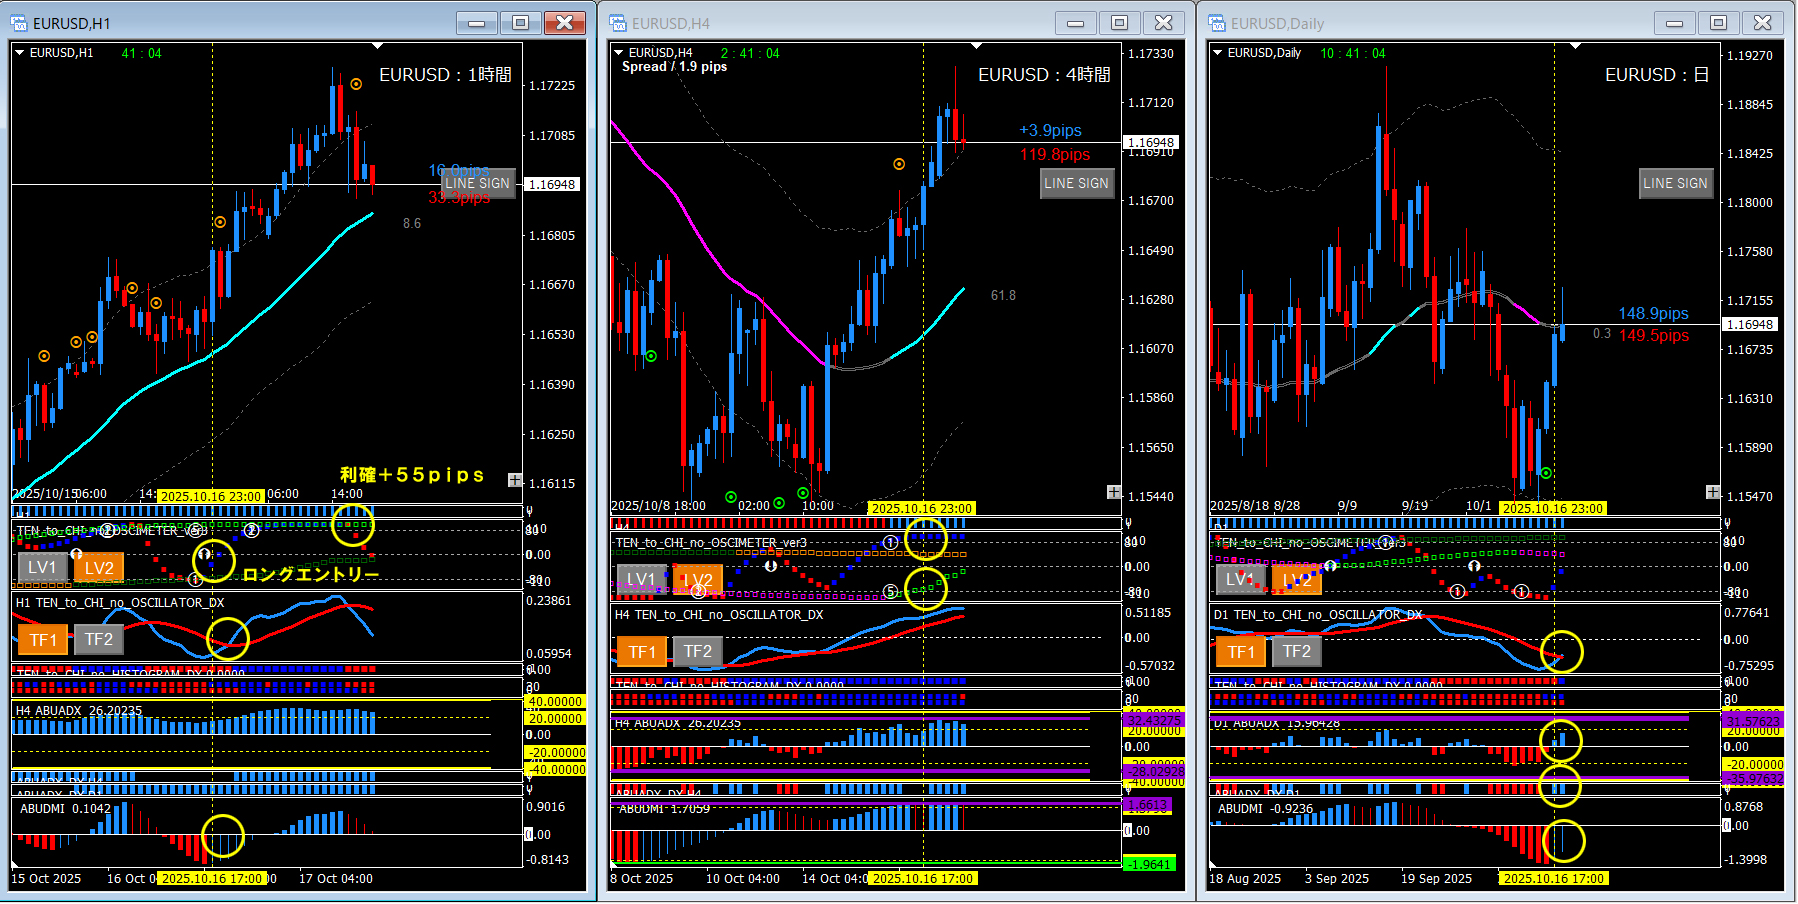
■ 1-hour chart (left: entry timeframe)
・Line touch entry
・Oscillator DX (rising cross)
・ABUDMI (rising reversal)
■ 4-hour chart (center: market awareness timeframe)
・Oscillator TF1, TF2 (rising)
・Histogram DX, DX2 (all blue)
■ Daily chart (right: market awareness timeframe)
・Oscillator DX (pre-cross rising)
・ABUADX (zero-line cross)
・ABUADX_DX (red)
・ABUDMI (pre-rising reversal)
■ Summary
Today, ABUADX_DX on the daily chart has not yet confirmed, but other indicators show favorable patterns on both daily and 4-hour charts, so I will look for a long entry point on the 1-hour chart based on those as a basis. The basic entry shape on the 1-hour chart is appearing.
■ If you use DSATEA
I judged a downward trend at the yellow dotted line, so I will initiate on the 1-hour chart with DSATEA set to short-only at this point.

I hope this is helpful to everyone, even a little.
If you press the GOOD mark, it will give me energy for future work. I would appreciate your continued support for further motivation.
