
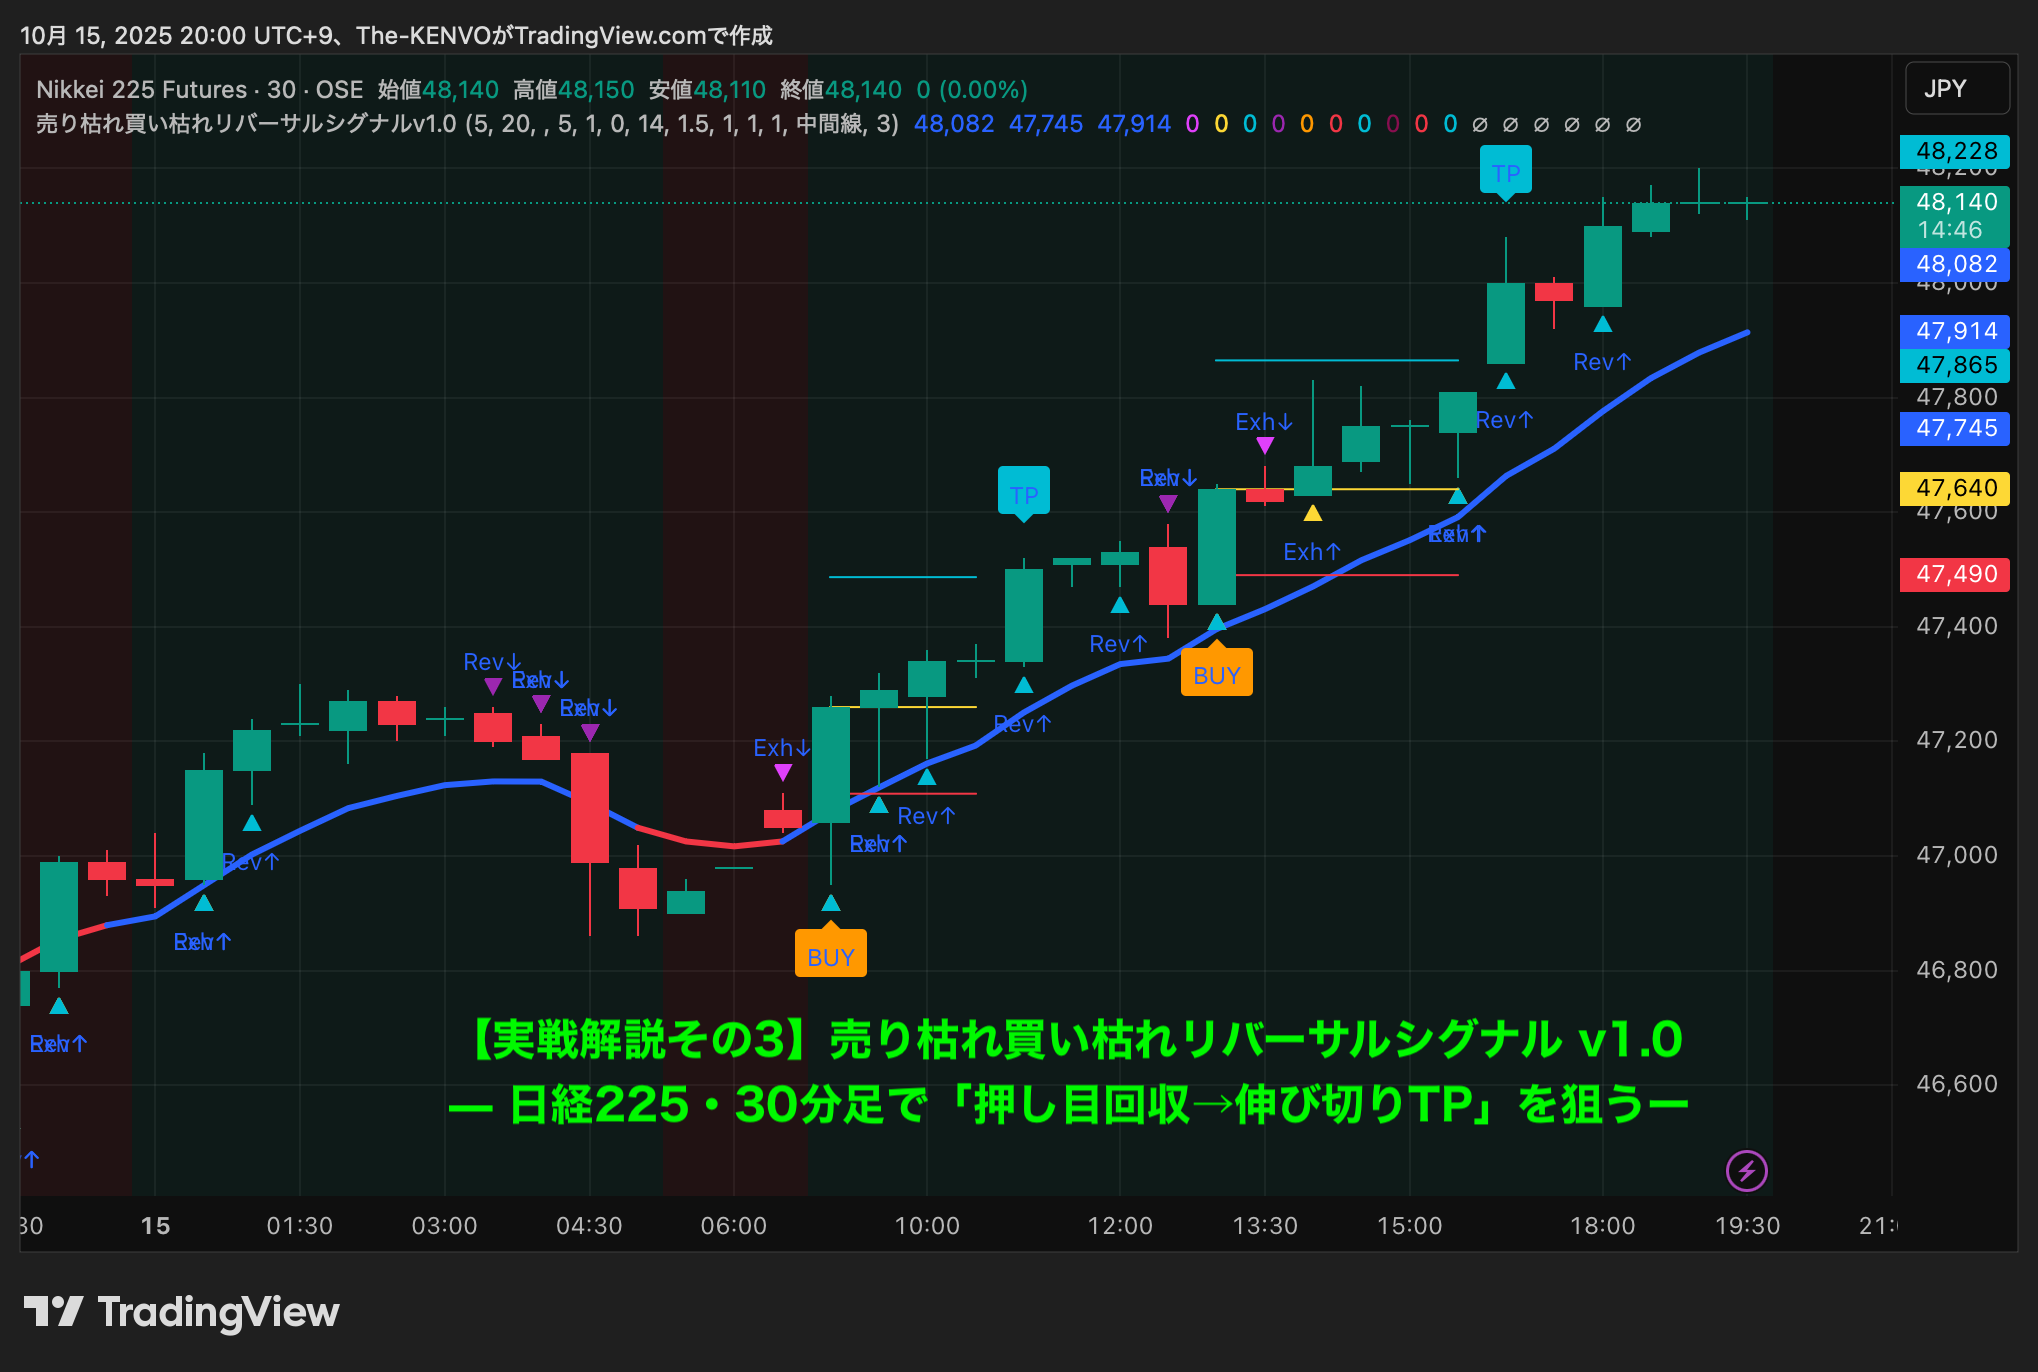
[Practical Explanation Part 3] Sell-off Exhaustion / Buy-up Exhaustion Reversal Signal v1.0 — Nikkei 225 30-minute chart aiming for “pullback recovery → full extension TP”
 Today's Conclusion (TL;DR)
Two Buy Patterns Occurred (morning and afternoon). Both followed the textbook sequence of Rev↑ → EMA convergence → TP reached.
On a pullback,Exh↑ (exhaustion of selling pressure) triggered, riding the midline (EMA band) to continue with the trend.
In a strong continuation phase, Exh↓ (excessive selling) signals light up. Partial profit-taking → break-even stop is effective.
Only these 3 tools are used
Rev (Reversal)… signs of reversal.
-Rev↑: Upward reversal signal
-Rev↓: Downward reversal signalExh (Exhaustion)… warning of exhaustion or overextension.
-Exh↑: Selling pressure exhausted (likely to move up)- Exh↓: Buying overextension (sign of a pause in rise)
Midline (EMA band)… Trend determination and “store of strength.”
- If the candlestick is above the midline → up bias, below → down bias
-Touching the line → rebound indicates an pullback candidate
Rules are simple:
“Direction with Rev” → “Confirm pressure relief with Exh” → “Enter with midline in tow”
Chart flow (30-minute chart, UTC+9)
*Explanations follow the attached chart labels (BUY/TP/Rev/Exh displayed)
① Late morning to just before noon:First BUY → TP
From the early morning pullbackRev↑ lights up.
Exh↑ also coincides, confirming exhaustion of selling pressure.
Candle breaks above the midline (EMA) → pullback forms at the same line.
System BUY lights up, TP line (horizontal) at the nearest swing high is placed.
Subsequently, it straightforwardly reaches TP (light blue label “TP”).
This is the shortest path of “Rev → midline → TP”.
A situation where one aims for a confident single shot rather than chasing more growth.
② Early afternoon to early evening:Pullback reformation → Second BUY
During the ascent, Exh↓ lights up once, signaling a mild pullback.Return to the midline
with multiple lower wicks →Rev↑ re-lights.
Two conditions align (midline above / Rev↑) → BUY lights up.
Trend recovers again toward afternoon → TP reached.
Pullbacks are taken around the midline.
Once surpassing the previous TP high zone, it tends to accelerate upward.
③ End phase:Exh↓ fireworks → partial profit-taking & break-even stop
In the phase of chasing highs, multiple Exh↓ signals (overbought) appear.
Profit-taking in parts (TP1/TP2) or move to break-even is a sensible shift.
If Rev↓ appears, avoid new longs and wait for a pullback.
Where today could be reproduced (setup steps)
Market tone check: Midline angle is rising, candles stay above ⇒ bullish bias
Signal A (direction): Rev↑ lights up
Signal B (pressure relief): Exh↑ lights up or recently lit
Backbone line: wait for pullback to midline / be light on Friday or before events
Entry:
Near the midline rebound or a break of the recent high with a stop
Profit-taking / retreat:
TP1: recent high to just before system TP line
TP2: post-breakout extension (shrinks with Exh↓ lighting)
Stop loss: clearly break the midline with a close+Rev↓: exit together
Move to break-even: after TP1 is achieved, shift stop to break-even
Three conditions to raise the quality of entries
① Advantage of simultaneous signals:Rev↑ + Exh↑ being near-simultaneous improves win rate
② Angle of the midline: enter when it is rising rather than flat
③ Recent volume spike: volume accompanying pullback rebound increases reliability
If the outcome is not favorable (alternative scenario)
Midline break + Rev↓: shift perspective. Do not buy down easily
Exh↓ firing repeatedly: prioritize profit-taking, skip new entries
Range breakout: shrink TP width, switch to higher turnover instead of chasing
Summary
Today“Direction by Rev, back by Exh, and coordinates by the midline” clearly functioned as the v1.0 baseline.
Two trades in morning and afternoon, both reached TP, partial profit-taking → break-even routine fit neatly.
Simply put, the “signs of reversal” are visible, reducing discretionary hesitation.
Usage notes (FAQ)
What time frame?: For day trading, use 5m, 15m, 30m; for swing, 4-hour is also effective.
Counter-trend or trend-following?: Capture the reversal signal and ride with the trend as the core idea.
Using with other indicators?: Works well with VWAP and volatility indicators (ATR). No need for excessive filtering.
Disclaimer
This article is not trading advice but a practical learning guide. Please make investment decisions at your own risk.
? Purchase & details here
This indicator is listed on GogoJungle.
There are approachable options:【Monthly version】 and【One-time purchase version】.
【Monthly version】 3,000 yen/month
【One-time purchase version】30,000 yen