

First, monitor whether the 1-hour chart is slanted or flat. Start from there
Reviews & videos can be viewed here
Good morning everyone.
Yesterday's USD/JPY moved as follows:As I wrote in yesterday's articlewe broke through the yellow tunnel zone, creating a selling and buying area.When it declined, we waited for a reversal and buying.
If it rises, we waited for a pullback to sell.
The market is said to be 70% in a range.
In quantitative terms, 14 out of 20 trading days were in a range or sideways.
The diagonal trend conditioning lasts only 6 days.
Among these, considering the time I can devote to the market, the actual number might be about half.
Scalping for top traders
Top Trader Chart
Top Trader Line
Using these, you can cover both range-bound and trending markets, but
a trading signal product that is simply a combination of commonly sold trend indicators can only be usable for about 6 days a month, effectively about 3 days, and you can hardly win.
In 20 trading days, trading only those 3 days is simply impossible.
Many people fail to notice this...
Well, setting aside the low-level talk, USD/JPY 1-hour & 1-minute charts
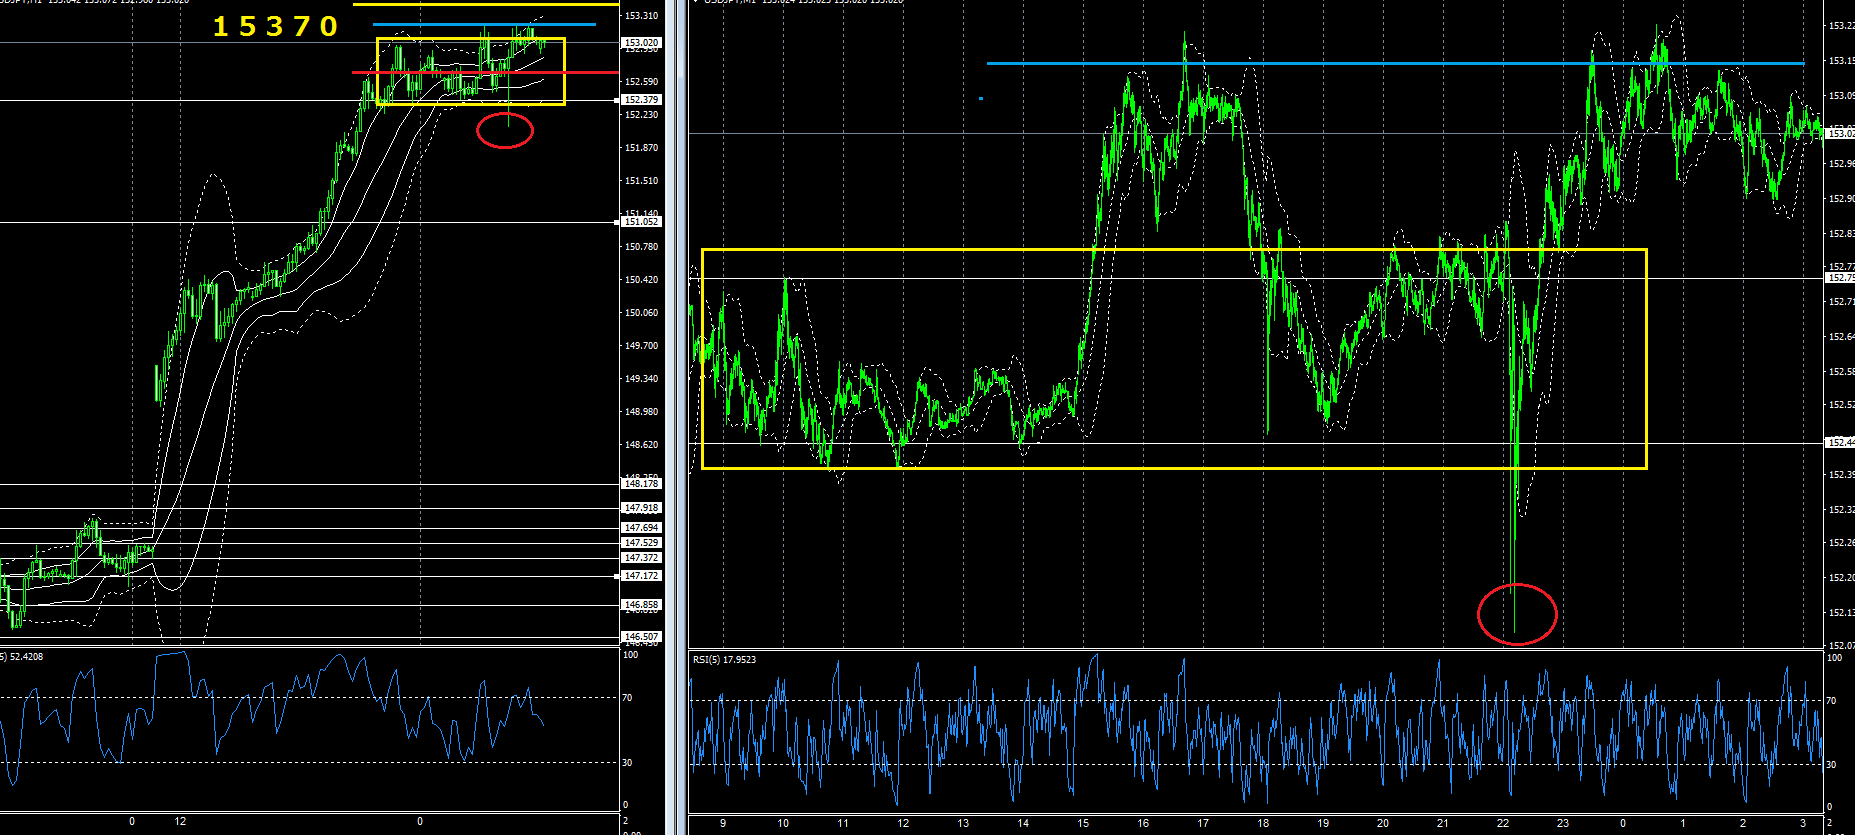
The yellow horizontal tunnel has been broken in both directions and then returned inside.
Above, the blue horizontal line marks a temporary goal, and then we pile up sandbags there to stop the decline.
Below, we saw two quick declines followed by a rise, making it an easy move to position oneself.
Red circle
There were reports of trying it.
Even an intermediate position became a perfect trade.
Today’s peak is probably around 15370, what do you think…
Top Trader's ScalpingUsers, as a procedure,
confirm a top and bottom, whether horizontally or diagonally.
Or, have the sense or feeling that that is the top or bottom.
Then
For example, if the hourly chart you just looked at determines the bottom of a decline, next check the 1-minute chart and consider positions when the chart shifts from selling to buying.
It might also be good to pick up the first pullback
It might be good to target pullbacks after high volume
It might be good to aim for a breakout with the Top Trader Line
As I have said many times, make this routine a habit.
Winning or losing comes later.
This kind of real-time chart trading cannot be provided as a buy/sell signal product.
Due to structure, system, and programming limitations, it is not possible.
What can function is a signal that works only in less than 30% of trend markets.
But do you know where that is?
If you know that in the first place, you wouldn't need a trading signal at all.
Read my articles daily, determine where you would take a position, where you would monitor, and test it yourself.
Leave national policy to the government.
Let your own finances flourish on your own.
What I as a trader recommend today are the following three products.
New Top Trader’s Scalping with Volume
FX Trading That Isn't Normal Hedging
Explosion Indicator — Turning into a Winning Trader
That’s all.
Thank you for your continued support today as well.
× ![]()