

Capture pullbacks and rebounds with high precision using Multi RCI!
Why is the indicator "RCI (Rank Correlation Index)" not included in MT5 for some reason
Are you familiar with the RCI indicator?
I think traders have heard of this indicator at least once,but for some reason it is not standardly included in MT5 (MT4).
It seems that the mathematical idea, calculation formula, and the algorithm itself are generally not subject to copyright, so it doesn’t seem to be a licensing issue, but since I also read that RCI itself is not a globally major indicator, perhaps that is the reason.
This isa very high-accuracy indicatorthat I’m talking about.
What is RCI (Rank Correlation Index)
An indicator that calculates Spearman rank correlation with price and time ranks and converts it into a readable scale
Purpose: measure the correlation between price rank andtime rankto understand market overheating (overbought/oversold) and the strength/direction of trends as an oscillator.
Basic idea: assign ranks to price data over a certain period, calculate the correlation from the differences between price ranks and time ranks. If prices have risen in a perfectly orderly sequence from the past (or fallen), there is strong correlation = there is a trend; larger rank differences indicate anti-correlation = reversal or range.
Calculation flow:
- Prepare N-period closing prices (or highs/lows).
- Assign a price rank to each value.
- Calculate the difference between the time-series rank (time rank) and the price rank.
- This value falls in the range from -100 to +100.
- If close to +100 → "strong uptrend" (price rank aligns with time rank); if close to -100 → "strong downtrend".
Interpretation (typical usage):
- RCI high (e.g., +80 or higher) → overheated (overbought), watch for a pullback.
- RCI low (e.g., -80 or lower) → oversold, watch for a rebound.
- Around the center (near 0) → weak trend or ranging.
- Crosses of the zero line or threshold, and divergences at extreme +/− values (e.g., price makes new highs while RCI does not) can be used as buy/sell signals.
Features:
- Since ranks are used, it is less affected by outliers and has noise resistance.
- Calculation is relatively simple, and by changing period N you can capture short- to long-term behavior (displaying multiple RCIs simultaneously is effective).
- Functions similarly to RSI and stochastic oscillators but offers a unique perspective via rank correlation.
Why is RCI so accurate?
Most representative indicators are calculated based on past prices.
They are based on averages or volatility, but they calculate using the price itself.
RCI also references price, but instead of using that value to compute,it only looks at the ranks, so the magnitude of the differences is irrelevantwhich sets it apart.
In other words, it is not influenced by outliers, so you can read the flow calmly.
It can also be said to exclude the phenomenon of getting excited by extraordinarily long candles.
What happens when you view RCI across multiple periods?
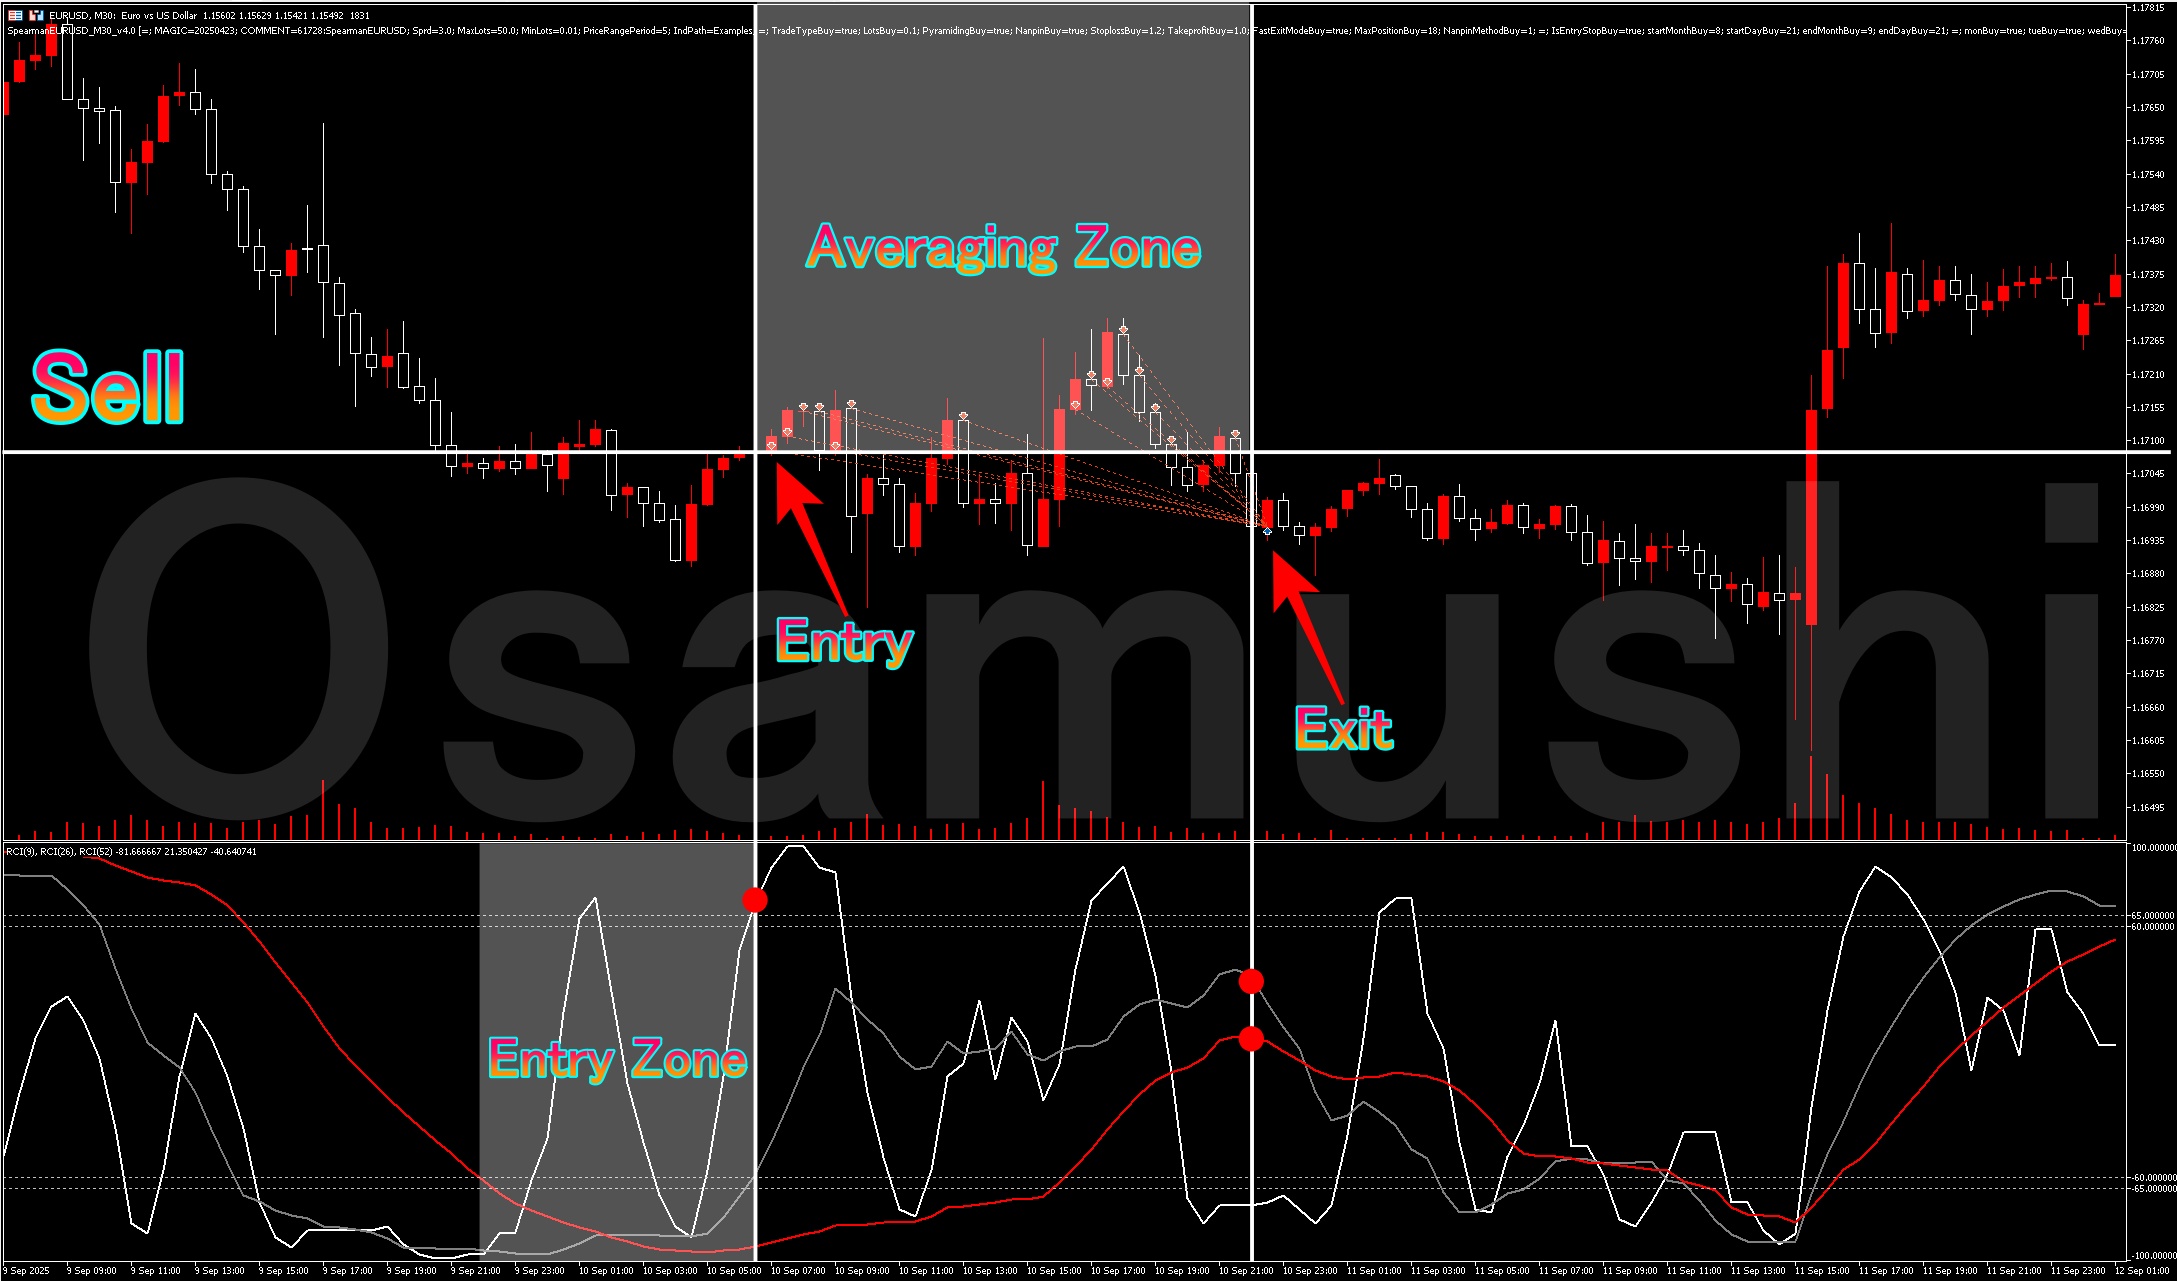
When the long-term is bullish and the short-term becomes oversold,there is a possibility of a pullback formingas a result.
Entry logic improvements
I add a mid-term and look at three RCIs, finding an edge in entries (or the opposite) when the mid-to-long term is buying-dominant and the short term is oversold.
Periods used are the same as in Ichimoku Kinko Hyo: 9, 26, 52
There is no special meaning to these periods, but they are the most popular combination and I believe no optimization is necessary.
Although not standard in MT5 (MT4), there are many free versions available on the web, so if you have never tried it, why not give it a go?
I have developeda multi-RCI EA, and its performance as of the time of this post is quite goodso please take a look.
It also features thoughtful lot sizing and is a very reliable EA.
Past performance is also included in the description, and the official logs have accumulated a little, so please refer to them.
SpearmanEURUSD_M30