
?【Practical Commentary Part 2】Sell-off Exhaustion Buy-side Exhaustion Reversal Signal v1.0 — Distinguishing “pullback aiming” and “top sign” within an uptrend —
 ◆ Today's Market Background
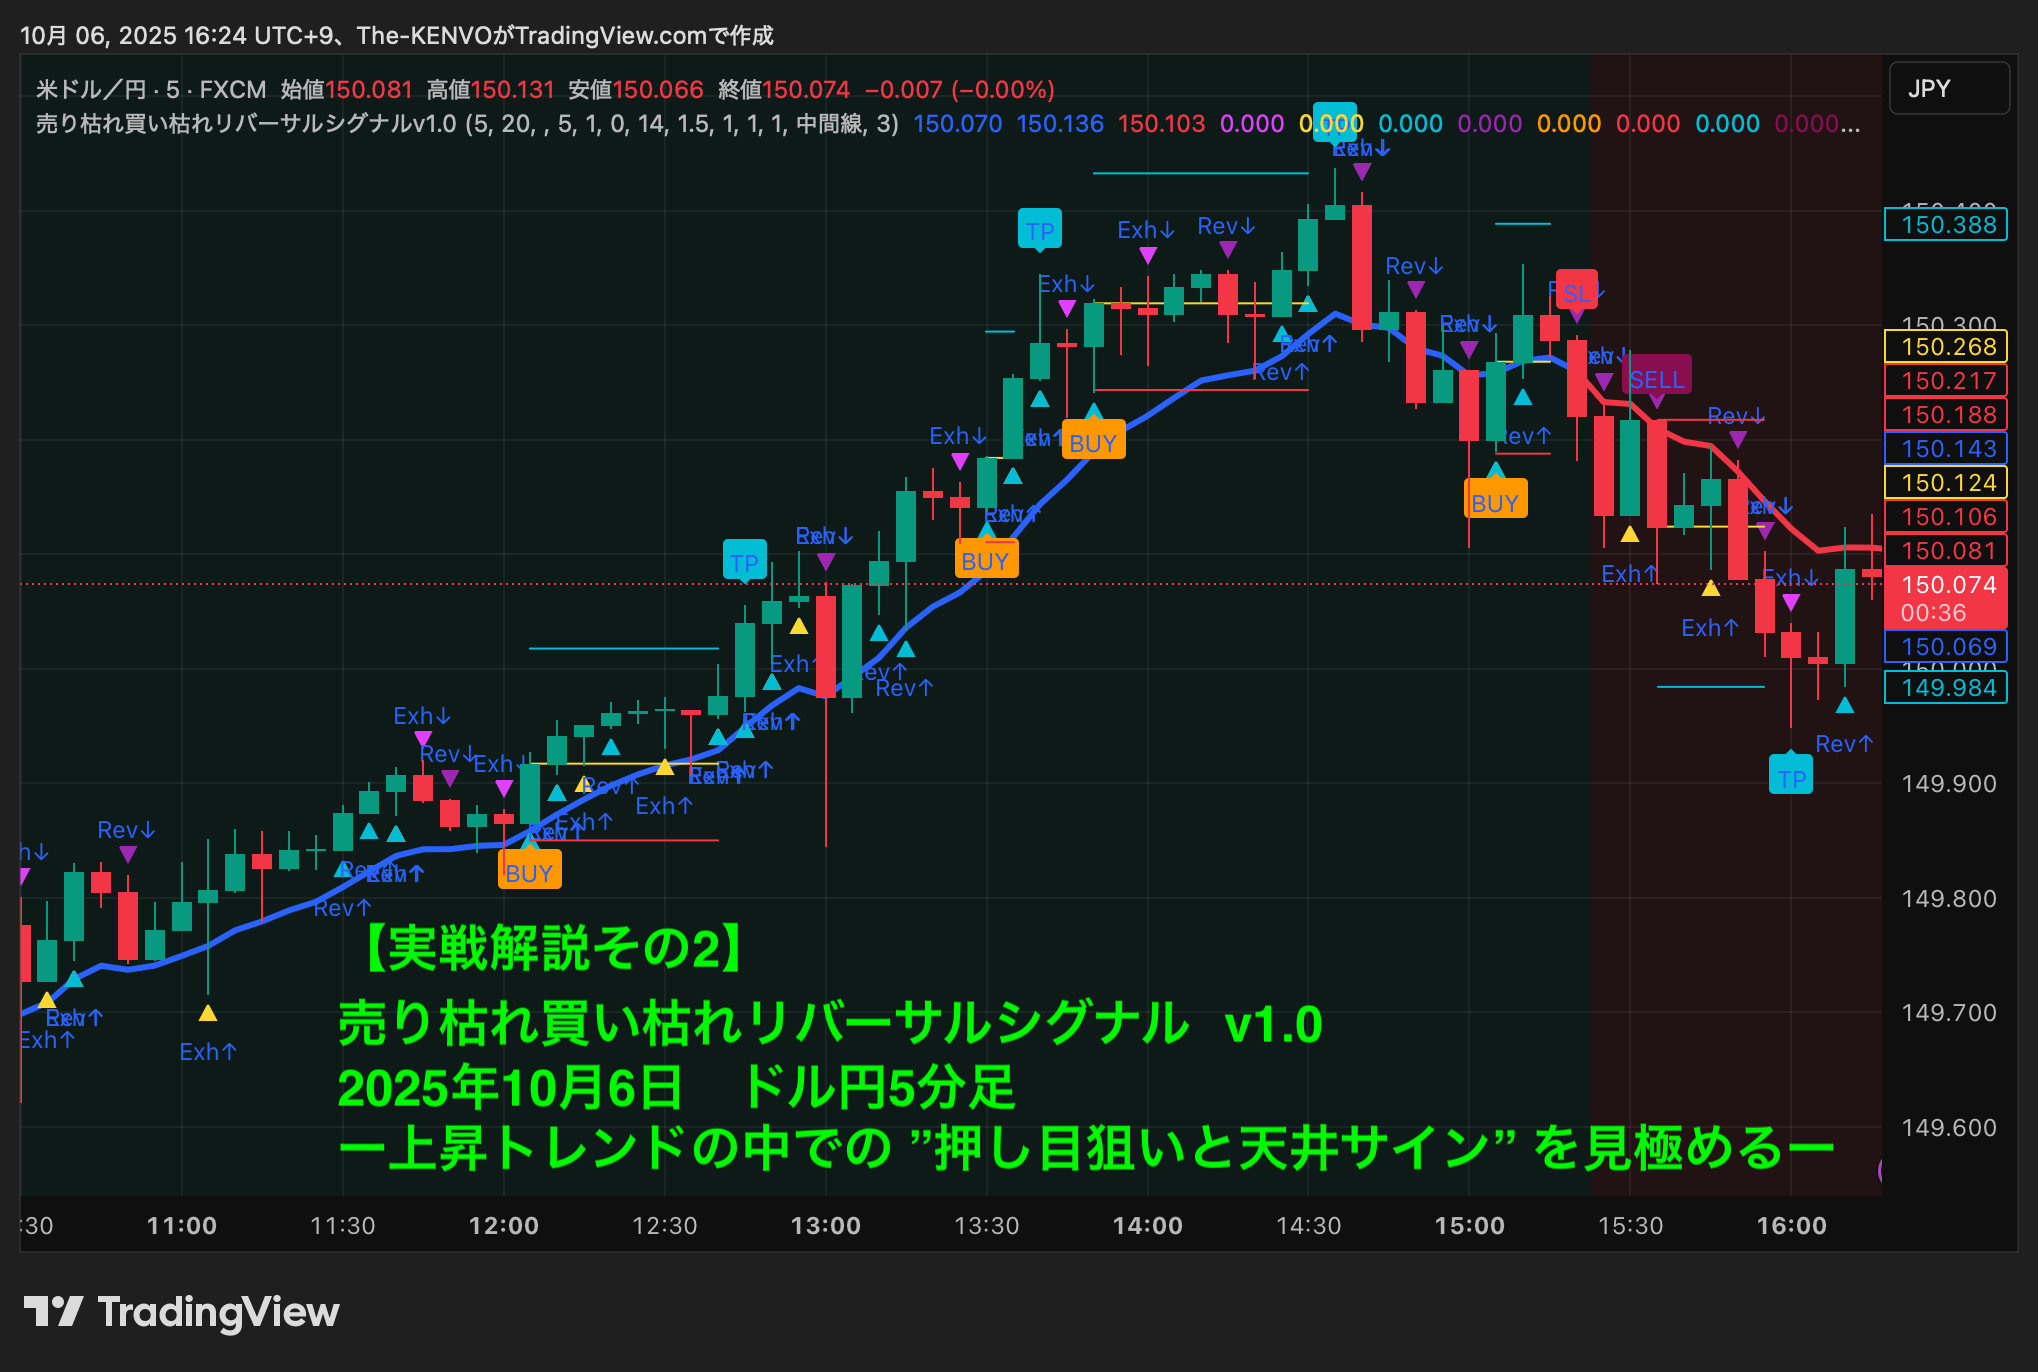
The USD/JPY on October 6, 2025 formed a strong upward trend from Tokyo to European hours.
In the morning it inched higher around 150, and in the afternoon briefly broke through 150.30.
Afterward, ahead of the New York session, gains eased somewhat, shifting to a retreat after the rally.
Thus, it was a two-part day: early uptrend followed by a later reversal and decline.
The signal “Sell Exhaustion/Buy Exhaustion Reversal v1.0” captured this transition vividly.
◆ Detailed explanation of the signal flow
? ① Tokyo to early afternoon (initial buy signal during the rise)
・From 11:30 to 12:00 multiple signals: “Exh↑” and “Rev↑” turned on
・Around 12:00, first BUY signal occurred
→ At this point the short-term EMA blue line turned up, initiating the uptrend.
If entered according to the signals,
around 13:00 the “TP” (take profit) mark was confirmed.
This is a典型 example of a “sell exhaustion → engulfing candle → trend re-start” early signal.
It reproduces the textbook situation of a pullback-buying opportunity.
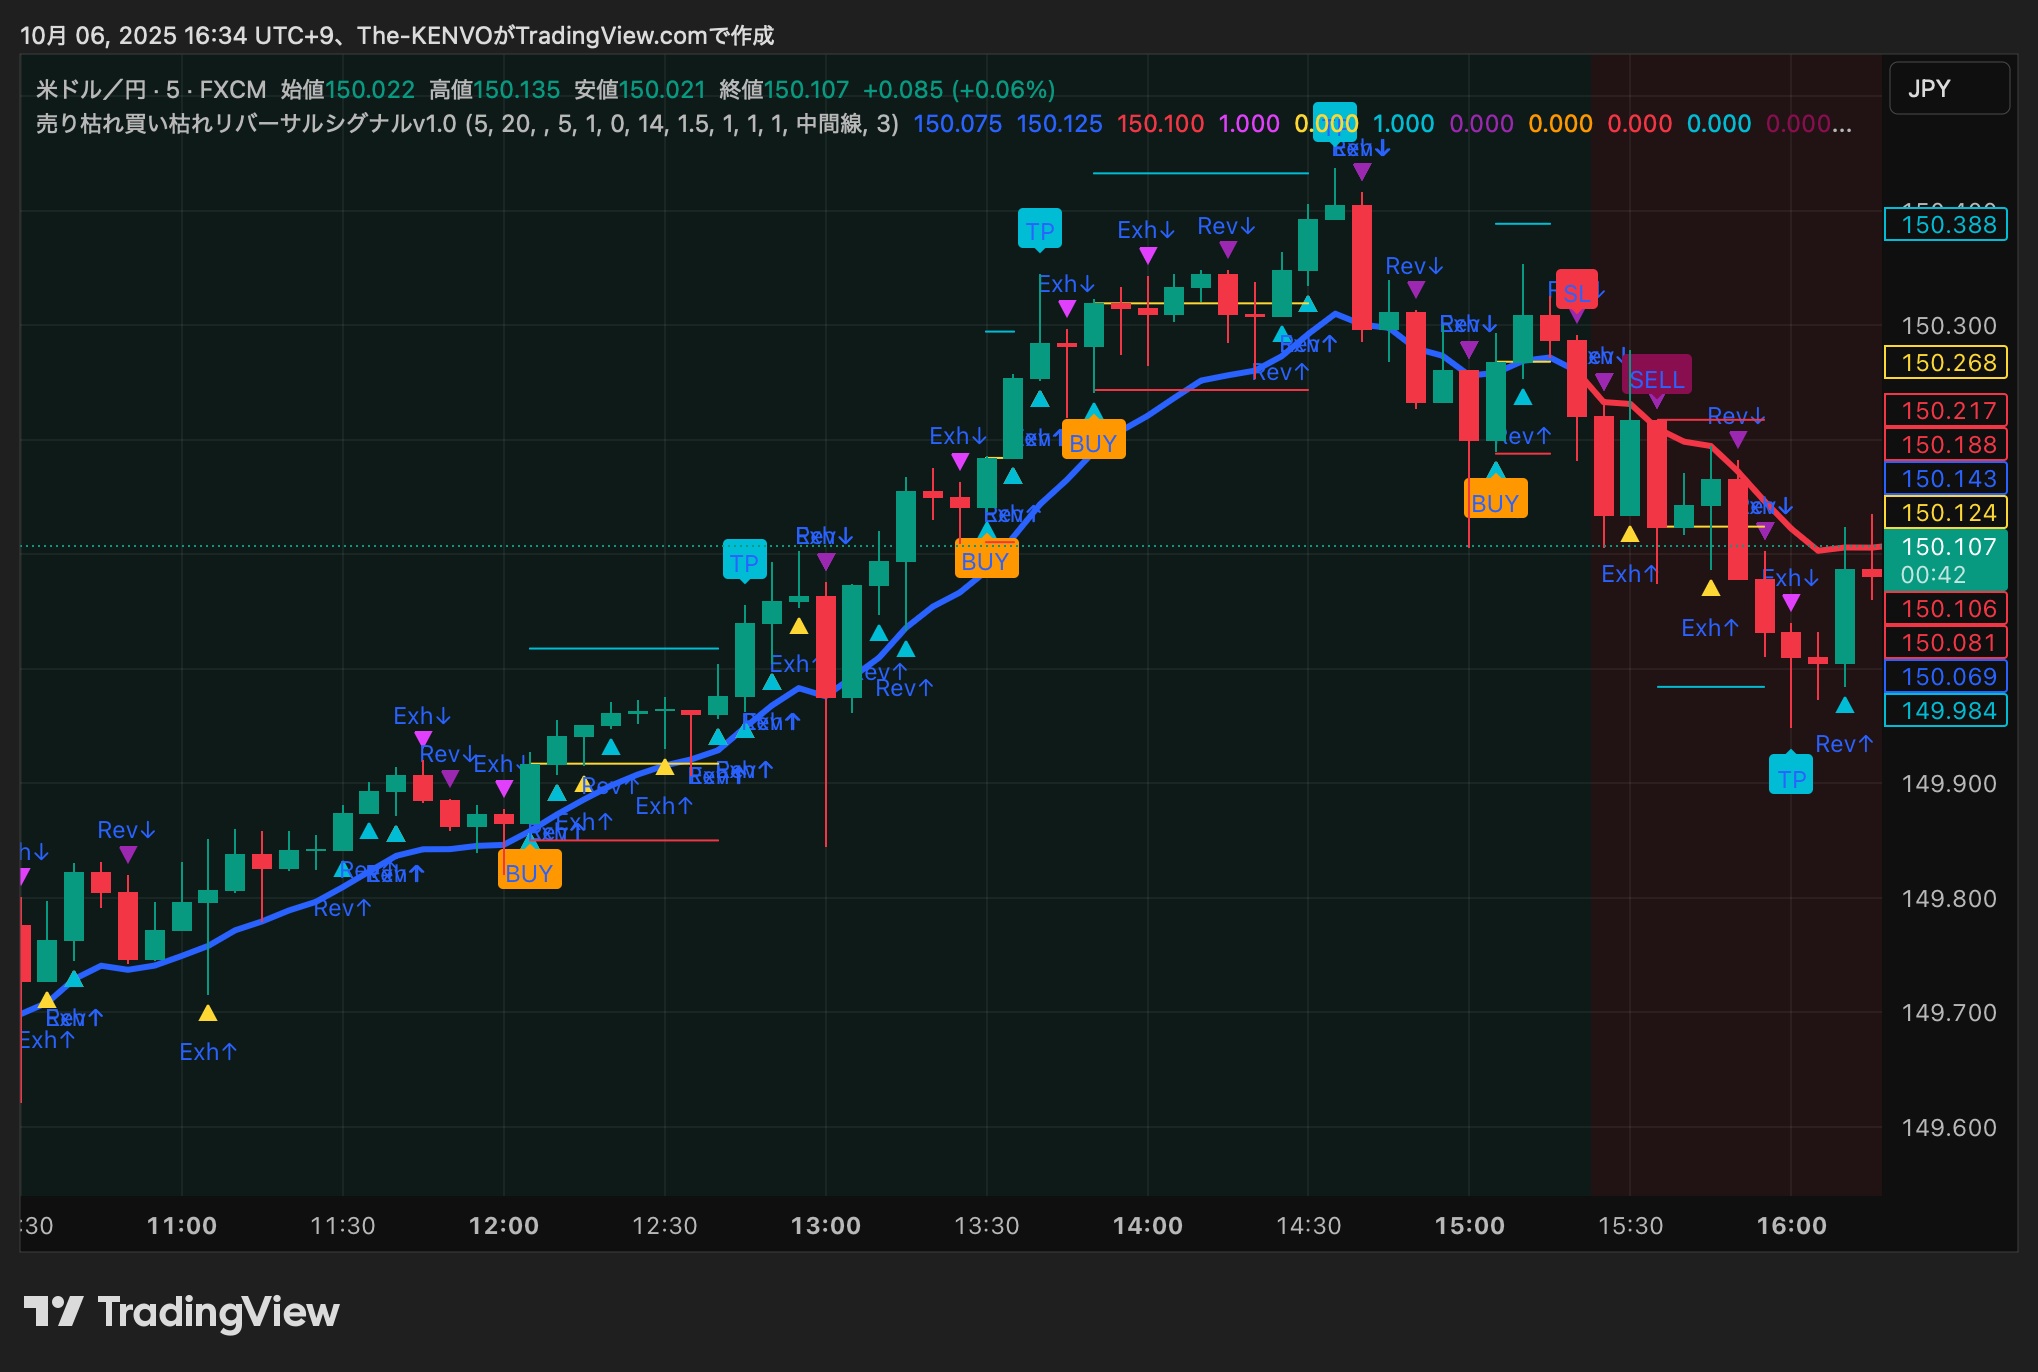
? ② 13:00–14:30 (additional signals during the ongoing trend)
・From 13:15 to 13:45 a second BUY lights up
・14:00s show consecutive Exh↑ and Rev↑
→ Indicates strong buying dominance, EMA angles further upwards.
Multiple TP marks are confirmed, showing the reversal signal also functioning as a trend-following type.
? ③ From 15:00 onward (trend reversal and sell signals)
・From 15:10 to 15:30 rapid increases in “Exh↓” and “Rev↓”
・Around 15:20 EMA turns red, SELL signal appears
・In the subsequent decline, a TP mark lights up before 16:00
→ Clearly a pattern of upsurge then reversal to decline.
The sequence is a
“energy of buying exhaustion → engulfing candle → trend reversal”
as the reversal structure itself.
◆ Summary for today
| Time | Signal | Meaning | Result |
|---|---|---|---|
| 11:30–12:00 | BUY (initial) | Sell exhaustion → upturn | TP reached |
| 13:00–14:30 | BUY (continuation) | Re-start of pullback buying | Multiple TP |
| 15:10–15:30 | SELL | Buy exhaustion → reversal decline | TP reached |
Today, every phase—upward initial movement, trend continuation, and turning decline—signal worked effectively.
In particular, the reversal after 15:00 is a phase often overlooked by standard trend indicators.
With the triple signals of “Exh + Rev + EMA reversal,” the top sign was clearly visualized.
◆ Application to trading strategies
Blue EMA + BUY signal = trend-following entry
Red EMA + SELL signal = aim for the initial move of reversal
Repeated appearance of Exh (Exhaustion) + Rev (Reversal) is treated as a definitive signal
By following this rule,
you can flexibly respond in both ranging and trending markets.
◆ Final takeaway
“Sell Exhaustion Buy Exhaustion Reversal Signal v1.0” is not merely a contrarian indicator,
it is a trend reversal detection tool that quantitatively captures market energy depletion.
In this chart as well,
Upward initial movement
Trend acceleration
Turning decline
are all anticipated by signals,
reinforcing the effectiveness of a strategy that targets initial reversals.
? Purchase details and more here
This indicator is listed on GogoJungle.
There are approachable options: [Monthly Version] and [One-time Purchase Version].
【Monthly Version】 3,000 JPY per month
【One-time Purchase Version】30,000 JPY