
?【Practical Commentary Part 1】 Sell-off Exhaustion and Buy-signal Reversal Signal v1.0 — Learning the "Reversal First Move" Strategy from the USD/JPY 5-minute Chart on the Night of October 3, 2025
◆ Introduction
Even on nights when the market seems not to move,“selling exhaustion” and “buying exhaustion” create energy turning pointsexist.
Visualizing that “moment” is the **“Sell Exhaustion / Buy Exhaustion Reversal Signal v1.0”**.
This indicator is not merely a contrarian tool, but has a structure aiming for the “first move of reversal”
“Sell cycle complete → bullish engulfing → trend re-start”.
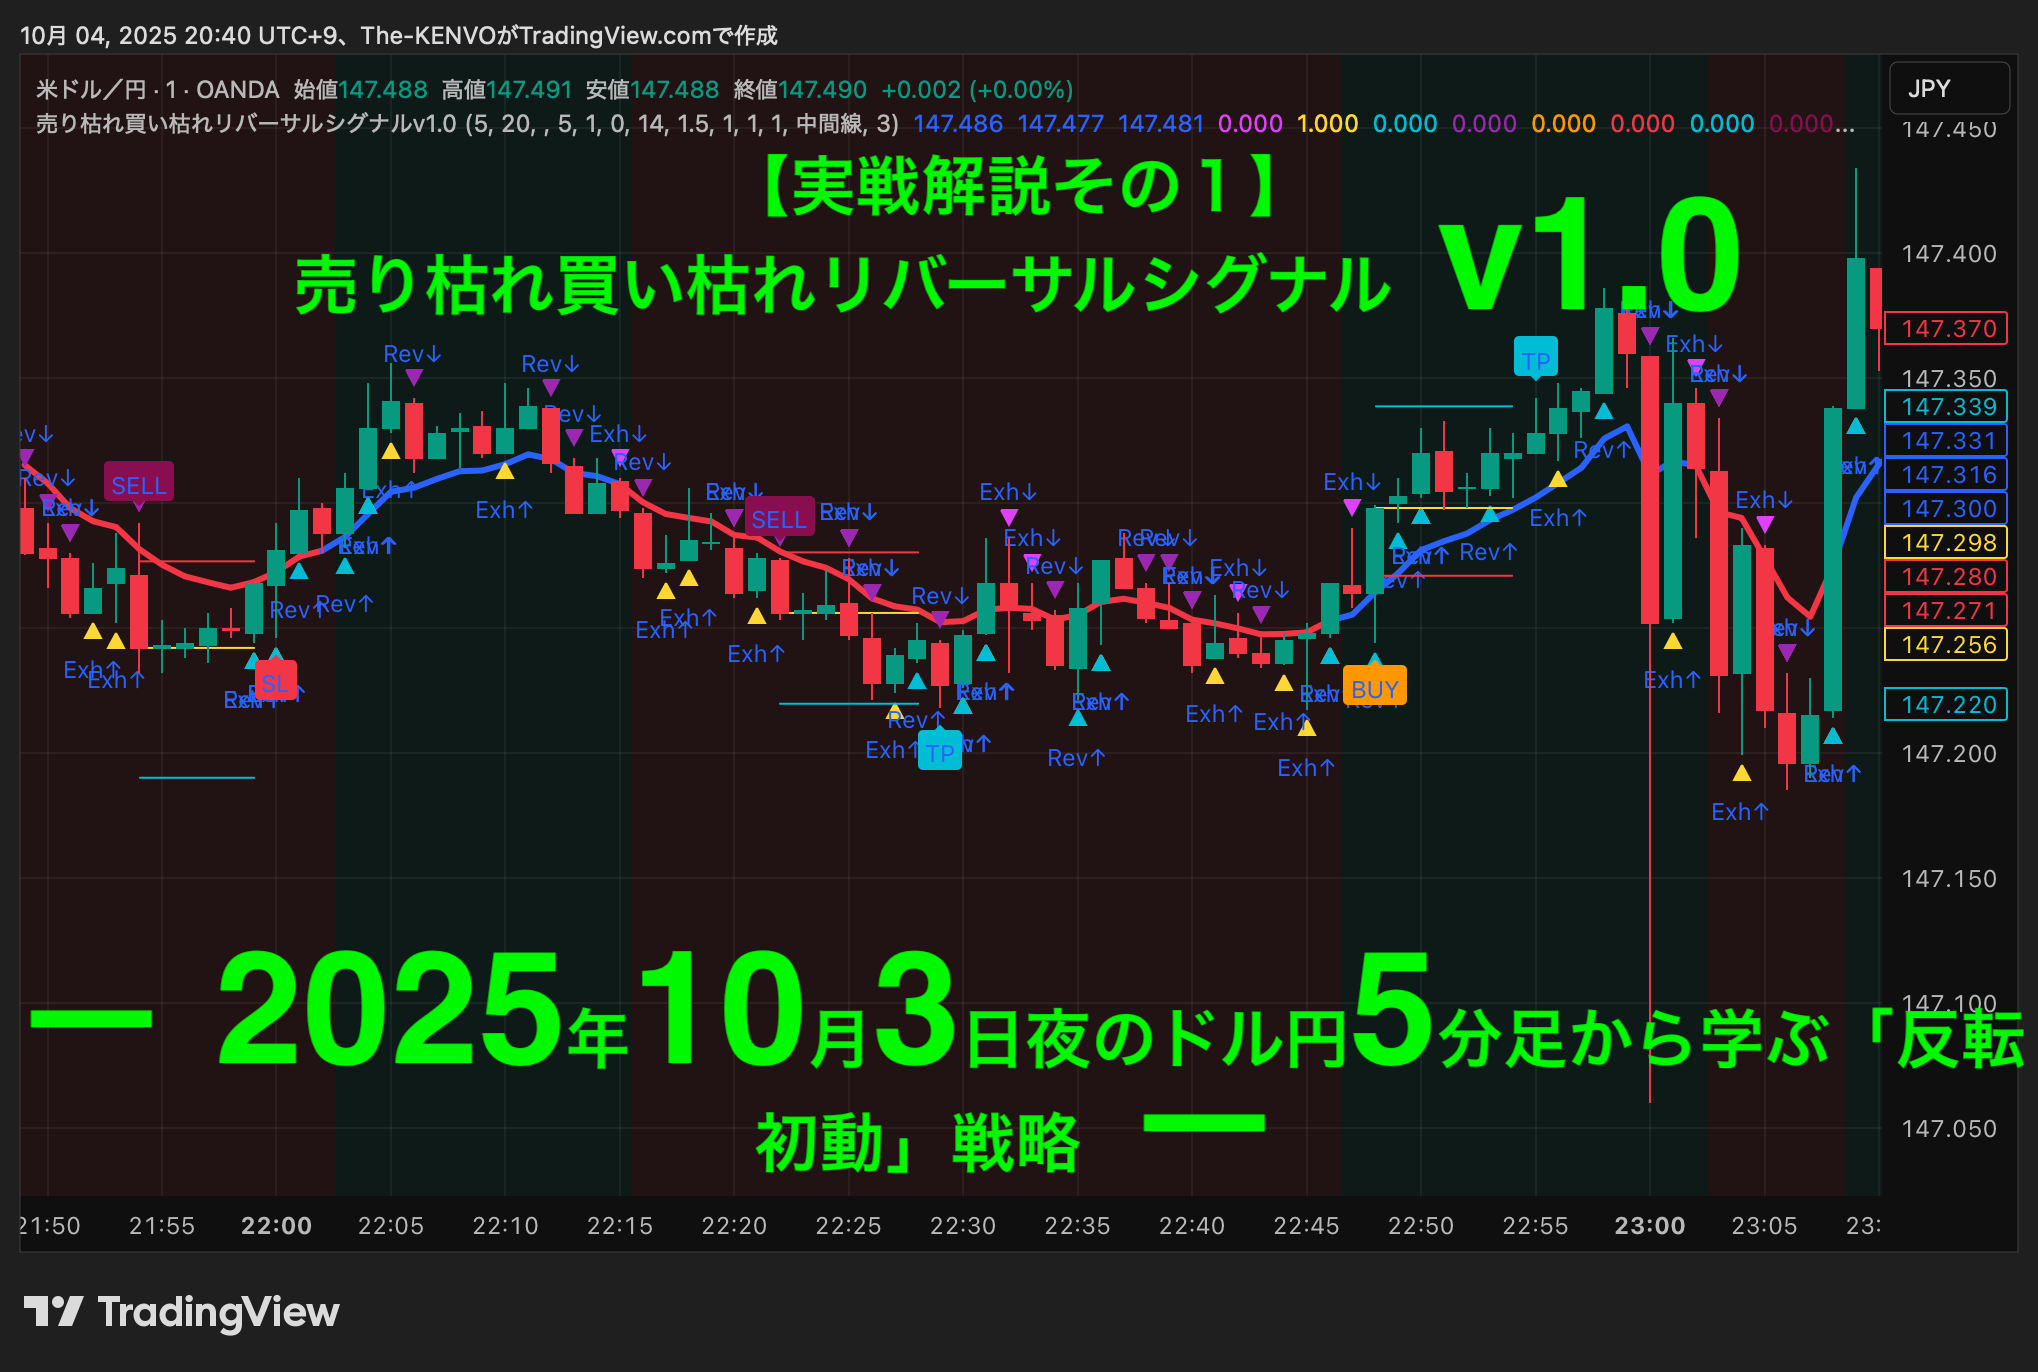
◆ Practical chart this time: USD/JPY on October 3, 2025, night, 5-minute chart
The USD/JPY that night lacked a clear direction in New York time's latter part,
and moved in a short-term range with“up and down”repeating.
However, the “Sell Exhaustion / Buy Exhaustion Reversal Signal v1.0”
is a type that thrives in such markets.
Especially in the 22:40–23:00 interval,Buy reversal → trend reversal → take-profit reacheddisplayed an ideal development.
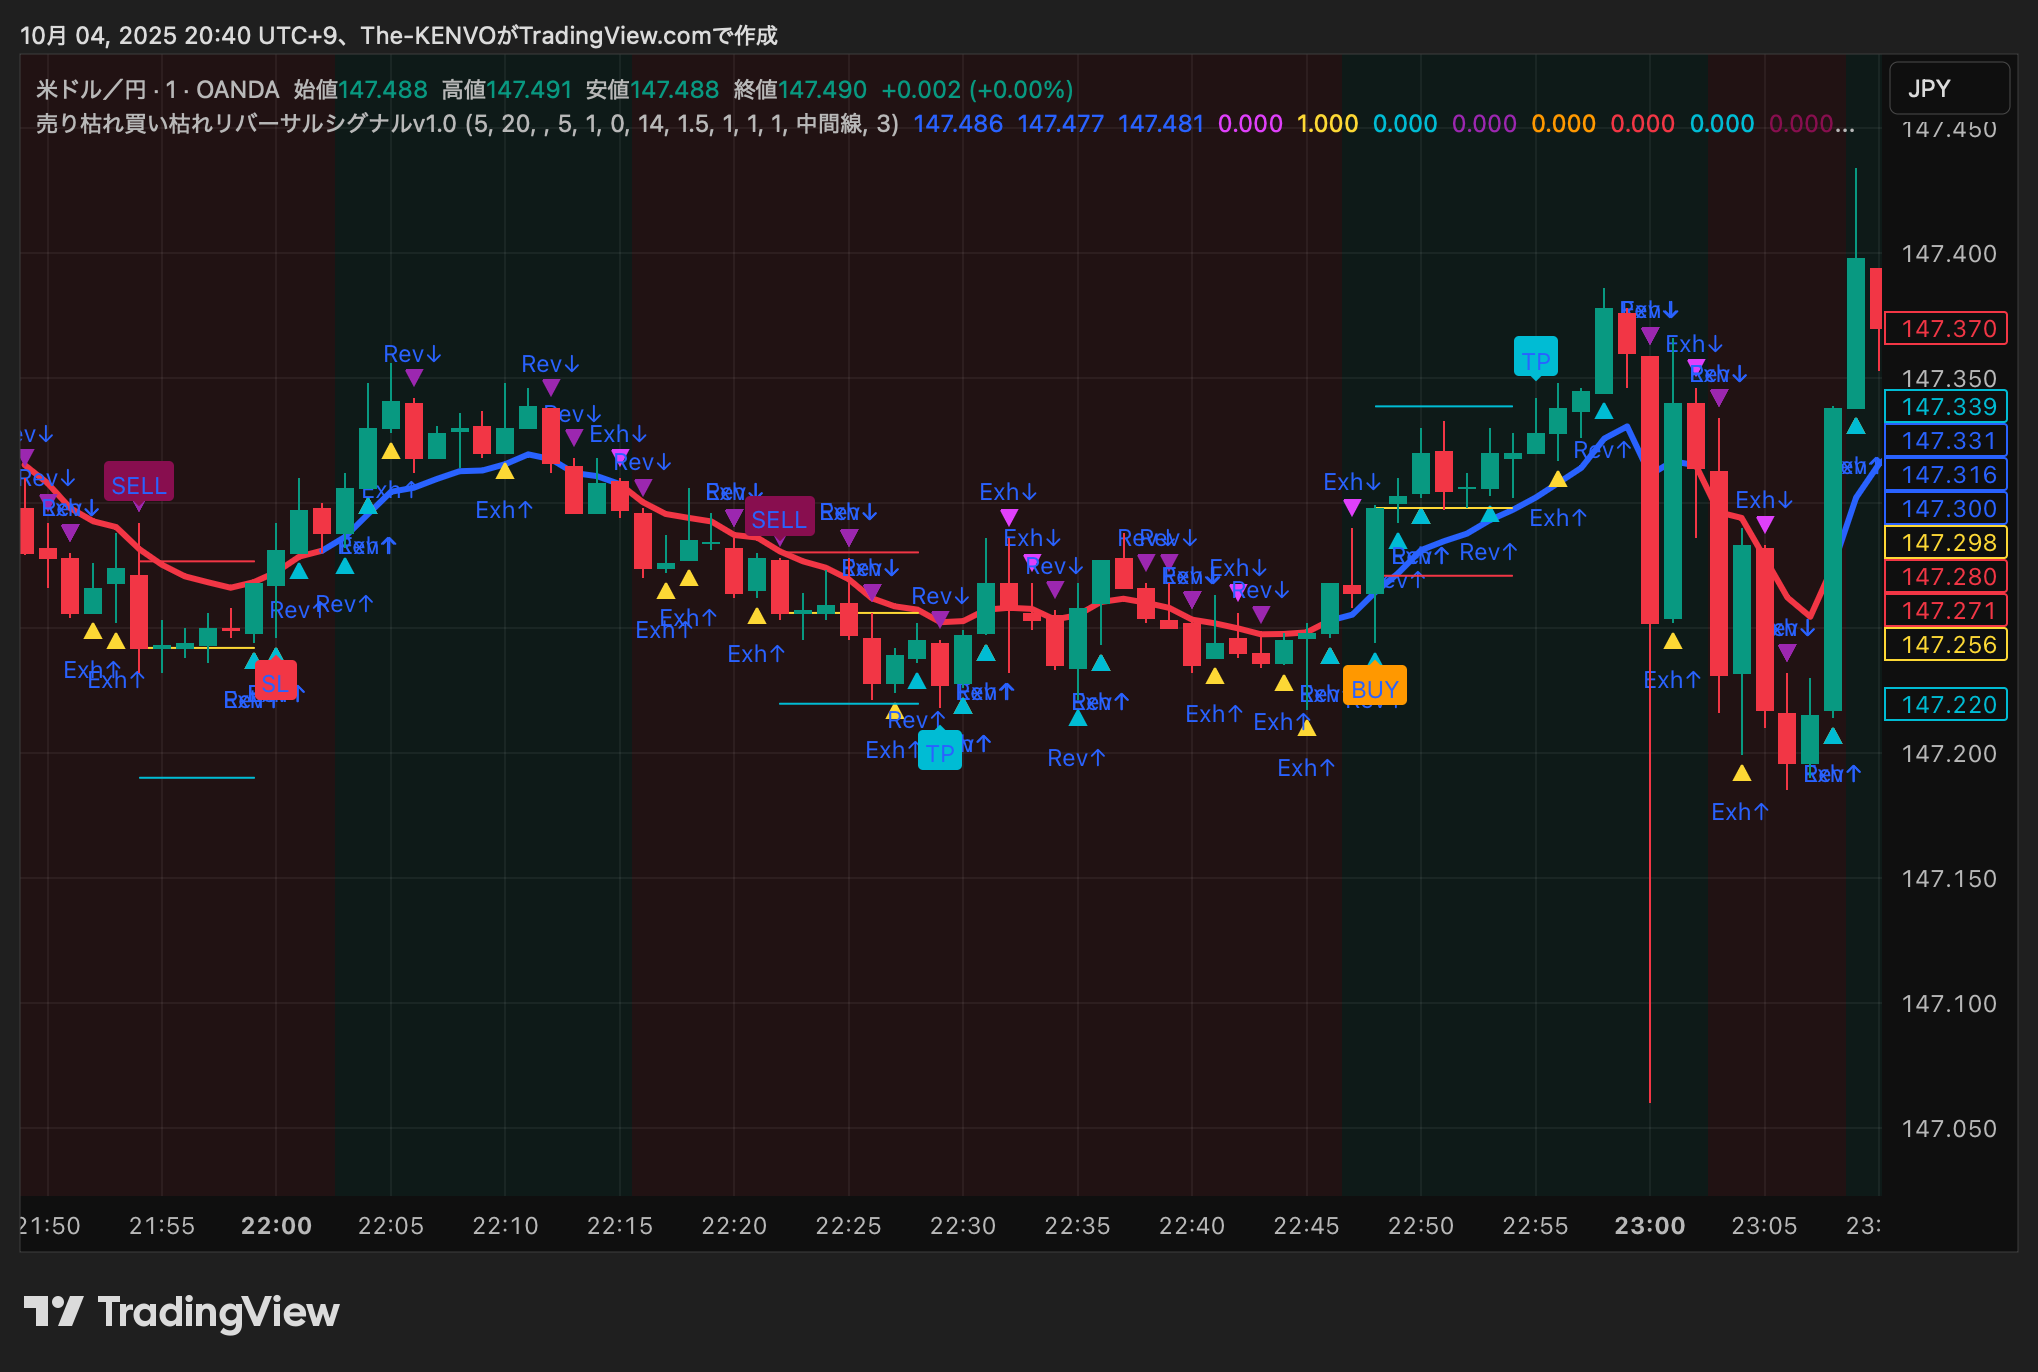
◆ Detailed explanation of signal flow
? 22:00–22:20 Early downtrend phase
・Multiple “SELL” signals light up
・“Exh↓ (exhaustion)” and “Rev↑ (reversal cue)” cross each other
→ signals indicating energy depletion increase
At this stage, there is no clear reversal yet.
However, the appearance of “Sell Exhaustion” began to indicatethe limit of downward energy.
? 22:40–22:55 Reversal initial move captured by BUY signal
・Around 22:45, “Exh↑” and “Rev↑” light up in succession
・EMA short-term line breaks upward,blue turn (uptrend confirmation)
・From 22:47 to 22:50, a “BUY” signal occurs
After that, the price continues to rise,
and before 23:00 the“TP” mark (profit target reached)appears.
This sequence truly reproduces a textbook example of “Sell Exhaustion → Engulfing → Trend reversal.”
? After 23:05, reversal signals again
・After consecutive lighting of “Exh↓,” the short-term EMA reverses
・Indicates a complete rise and reemergence of selling pressure
Thus, the indicatordetects reversal first moves in both directions in real time, and each time visualizes the background signal with the labels “Rev (Reversal)” and “Exh (Exhaustion).”
◆ Features of this indicator
| Item | Content |
|---|---|
| Applicable timeframes | All timeframes supported |
| Assets | FX, stocks, futures, cryptocurrencies |
| Main logic | Extreme volume skew (Exhaustion) + engulfing判定 + trend filter |
| Notification | Alerts can be sent when signals occur |
| Color scheme | Blue = bullish dominance / Red = bearish dominance |
◆ Tips for use
Pay attention to the overlap of Exh + Rev just before the EMA color changes
→ This is the most reliable “first move of reversal” point.Confirm profit-taking at the TP mark
→ Visually assess win rates for each signal.Can also be used as a hint for major trend reversals
→ On H1 or H4, you may catch a turning point at the daily chart level in advance.
◆ Summary
Rather than guessing the bottom or top, grasp the signs
Not “bottom guessing,” but riding the signals of reversal.
That is the philosophy of the “Sell Exhaustion / Buy Exhaustion Reversal Signal v1.0.”
Whether short-term or swing trading,
by visually capturing the “first move of reversal,”your trading patience and action judgment improve dramatically.
The market on October 3 described in this article is a good example where even in a thin-range, a clear reversal signal appeared.
“Sell Exhaustion” and “Buy Exhaustion” tell you about the premonition of a trend forming.
With this signal in hand,go ahead to seize the next initial reversal.
? Purchase / Details here
This indicator is listed on GogoJungle.
There are easy-to-try options【Monthly version】and【One-time purchase version】.
【Monthly version】3,000 yen/month
【One-time purchase version】30,000 yen