

Use of the "Visualization Indicator" (Part 219)
“Visualization Indicator” utilization (Part219)”
1. Further evolve the “28 Currency Pairs List Indicator” into an indicator
“8CPVisualization Indicator”to drawAUDCAD.
There is an8CP for Oceania,London version,NewYork version,AnyCP version. This time, we used the version.
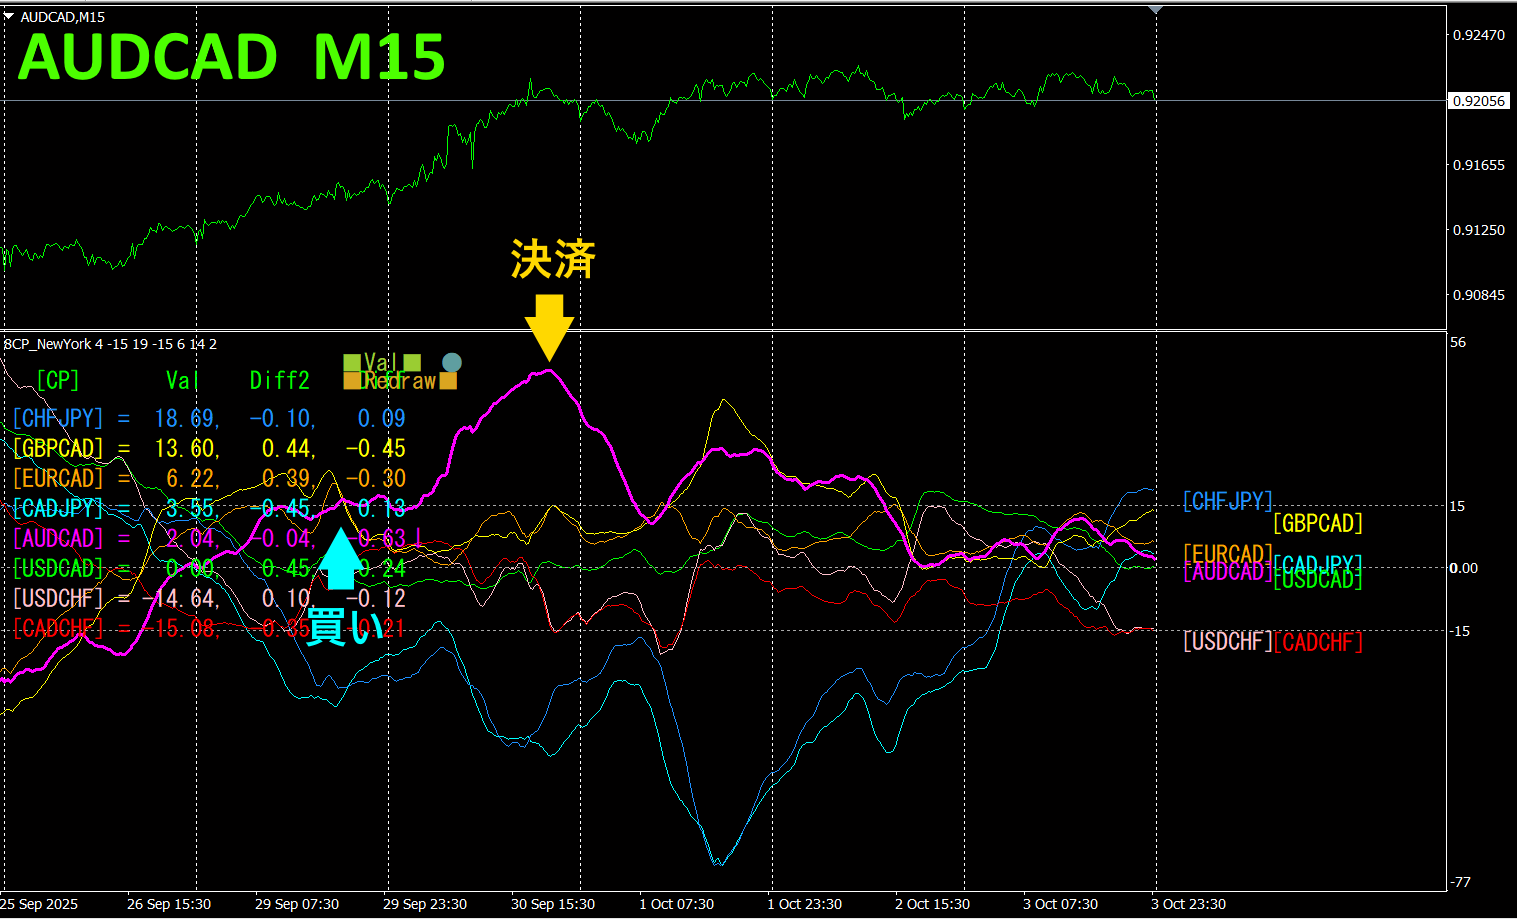
The upper half is theAUDCAD 15-minute chart. The lower half is from the “8CP Visualization Indicator”; the red-purple line graph corresponds to.
On Monday, the chart broke above the others, so we went long. It peaked on Wednesday and we closed the trade. About of profit was realized.
Currency Strength/Weakness Chart
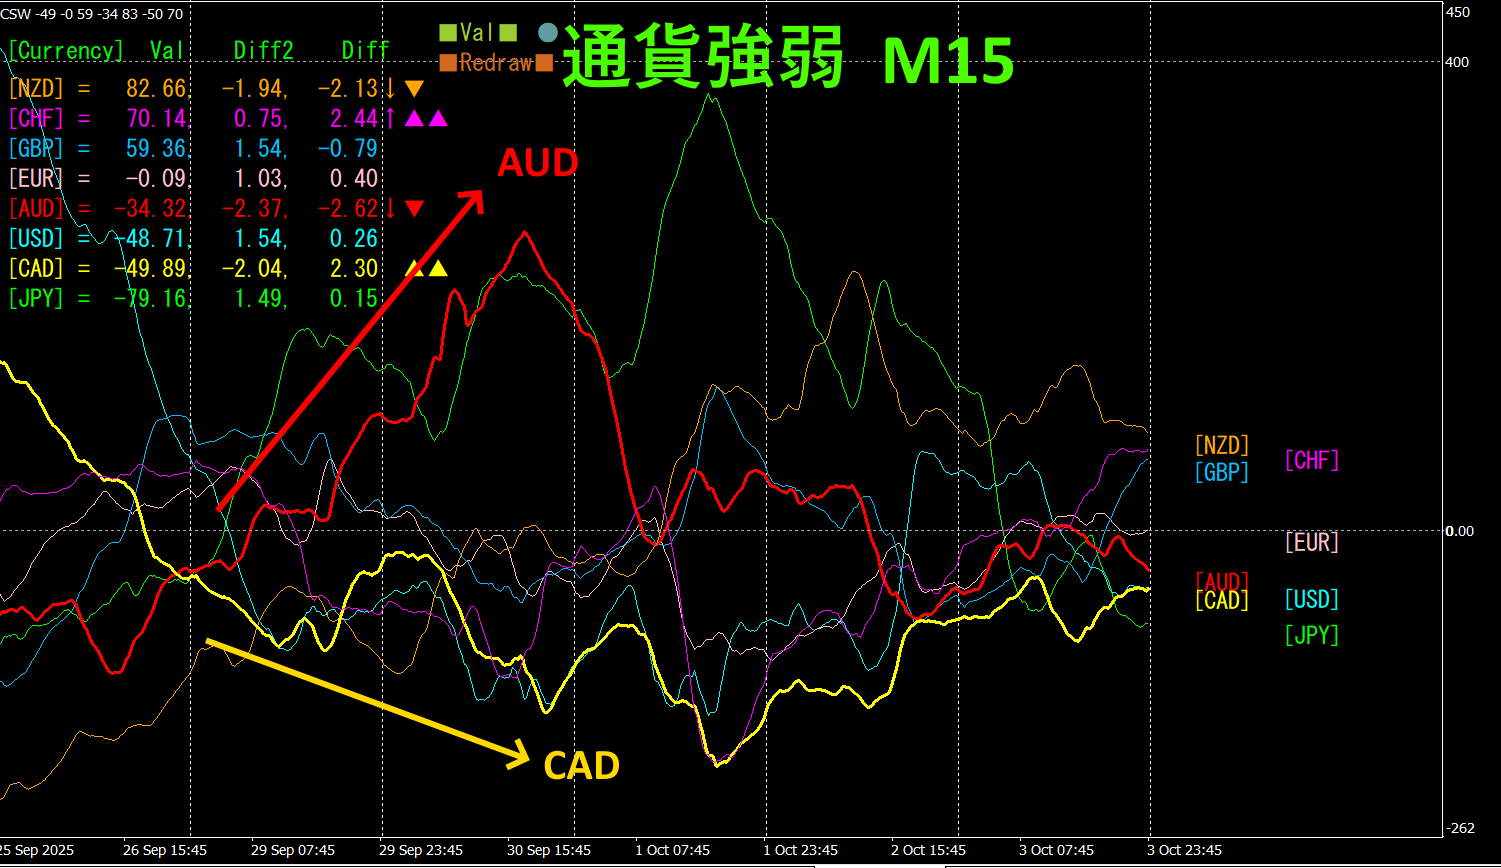
Looking at the 15-minute currency strength chart,AUD and CAD show a striking inverse correlation.AUD and CAD converge then diverge; since > , profitable buys on are possible.
If you choose the currency pair that is currently growing the most and is in a reverse correlation, your results will follow naturally.
“Aim for Currency Strength Reversal!” is FX golden rule.
If you use TrendLine-EX, entries and exits can be automated by breaks of diagonal trendlines. You can just leave it as is for easy trading. “TrendLine-EX is a semi-automatic EA that can short-sell on breaks below the trendline and automatically close on breaks above it.
2. Best Select indicator trial
The figure below is a screenshot fromOct 01 2025 at 16:21 (JST).
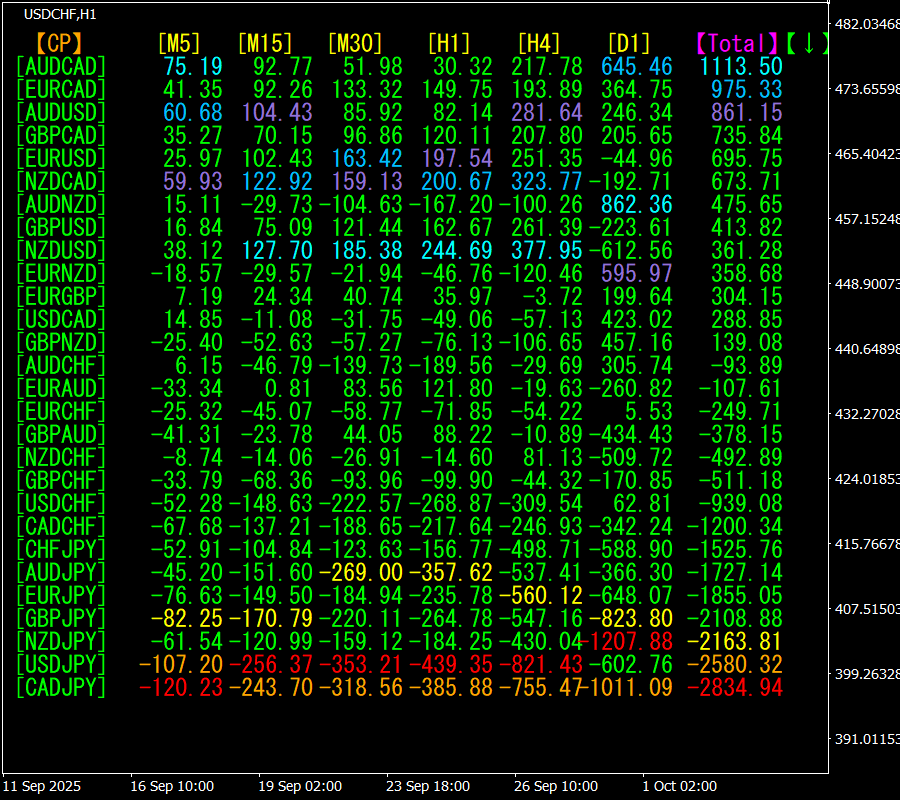
[Total]The values are sorted in descending order. CADJPY at the bottom shows red color across all timeframes.Total value is-2834.94, indicating a strong downward trend for CADJPY.
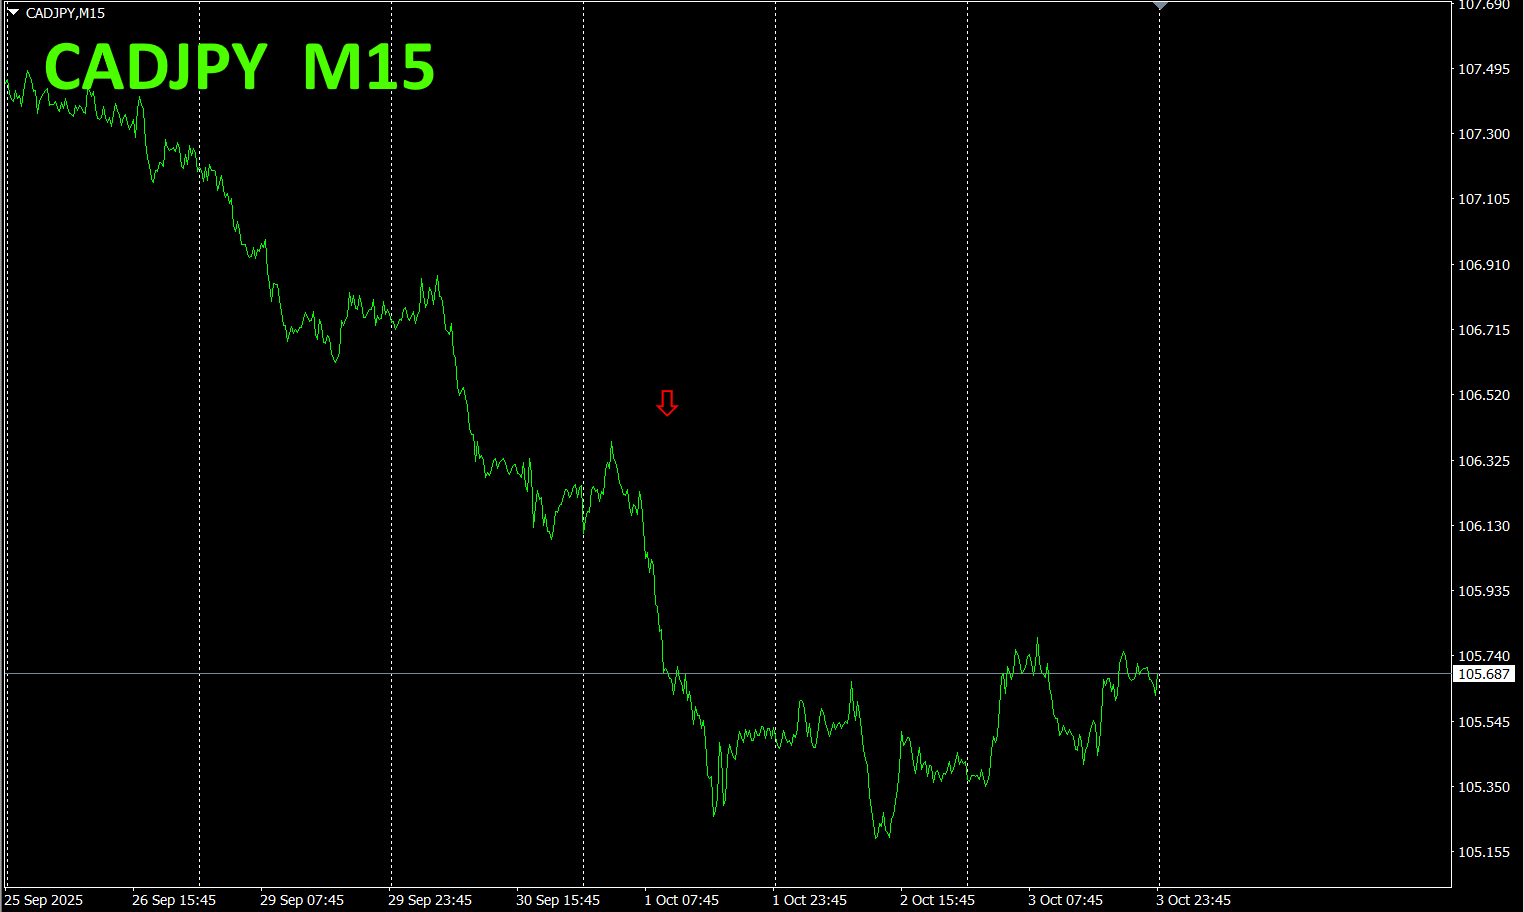
Now, let’s look at the CADJPY chart.
The red arrows mark where the screenshot was taken. It captures a large, steep drop.
“28 currency pairs Best Select allows you to easily find which currency is currently in the strongest trend among the 28 pairs. It also tells you whether to trade now with numbers and colors. It lets you determine the overall movement of all currency pairs at a glance.
“28 currency pairs Best Select indicator.”
https://www.gogojungle.co.jp/tools/indicators/35128
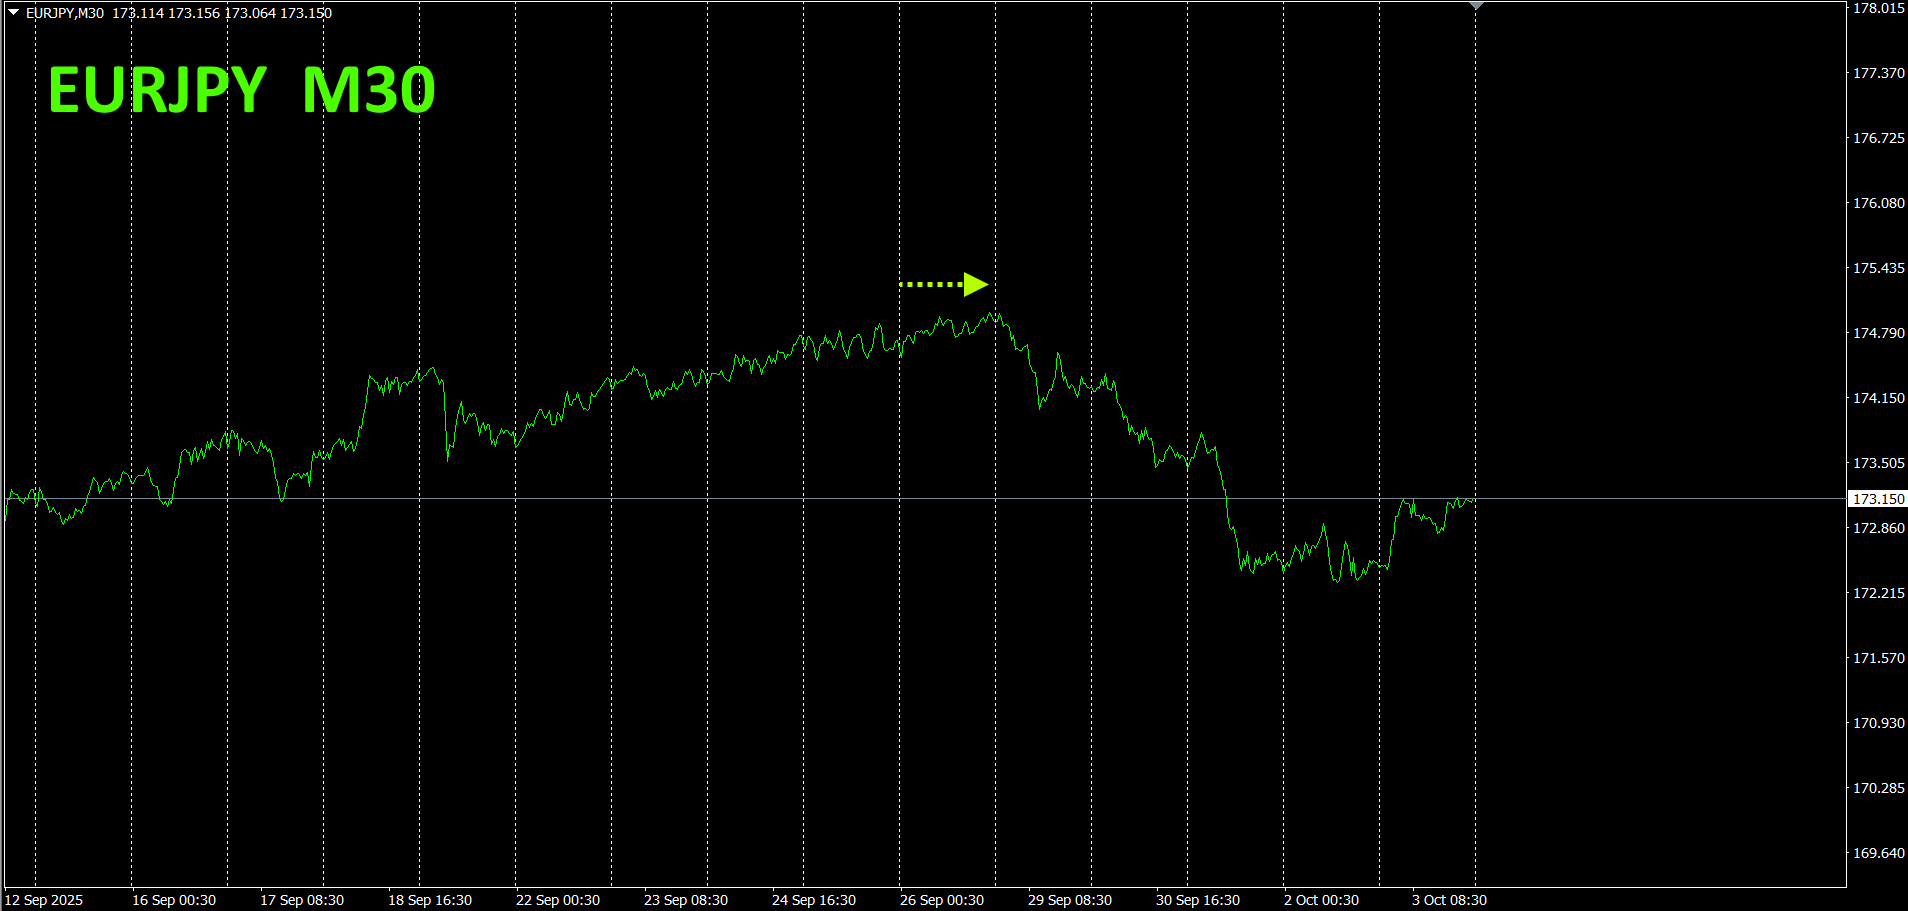
3. 2021年5月から追っているEURJPYの動きはどうなった?
2021年5月からの動きを追っています。
全体の流れを見るため、30分足チャートで直近約3週間分を描いています。
前回は、次のように書きました。
ピンク色がEUR、緑色がJPYです。EURもも、水平からやや上向きになっています。通貨強弱としては、EURがの上に位置するので、>の関係ですが、方向感が読めません。は、レンジ気味に推移するものと考えられます。
予想に反して、下落してきました。この間、がよりも強くなってきた結果だと考えられます。
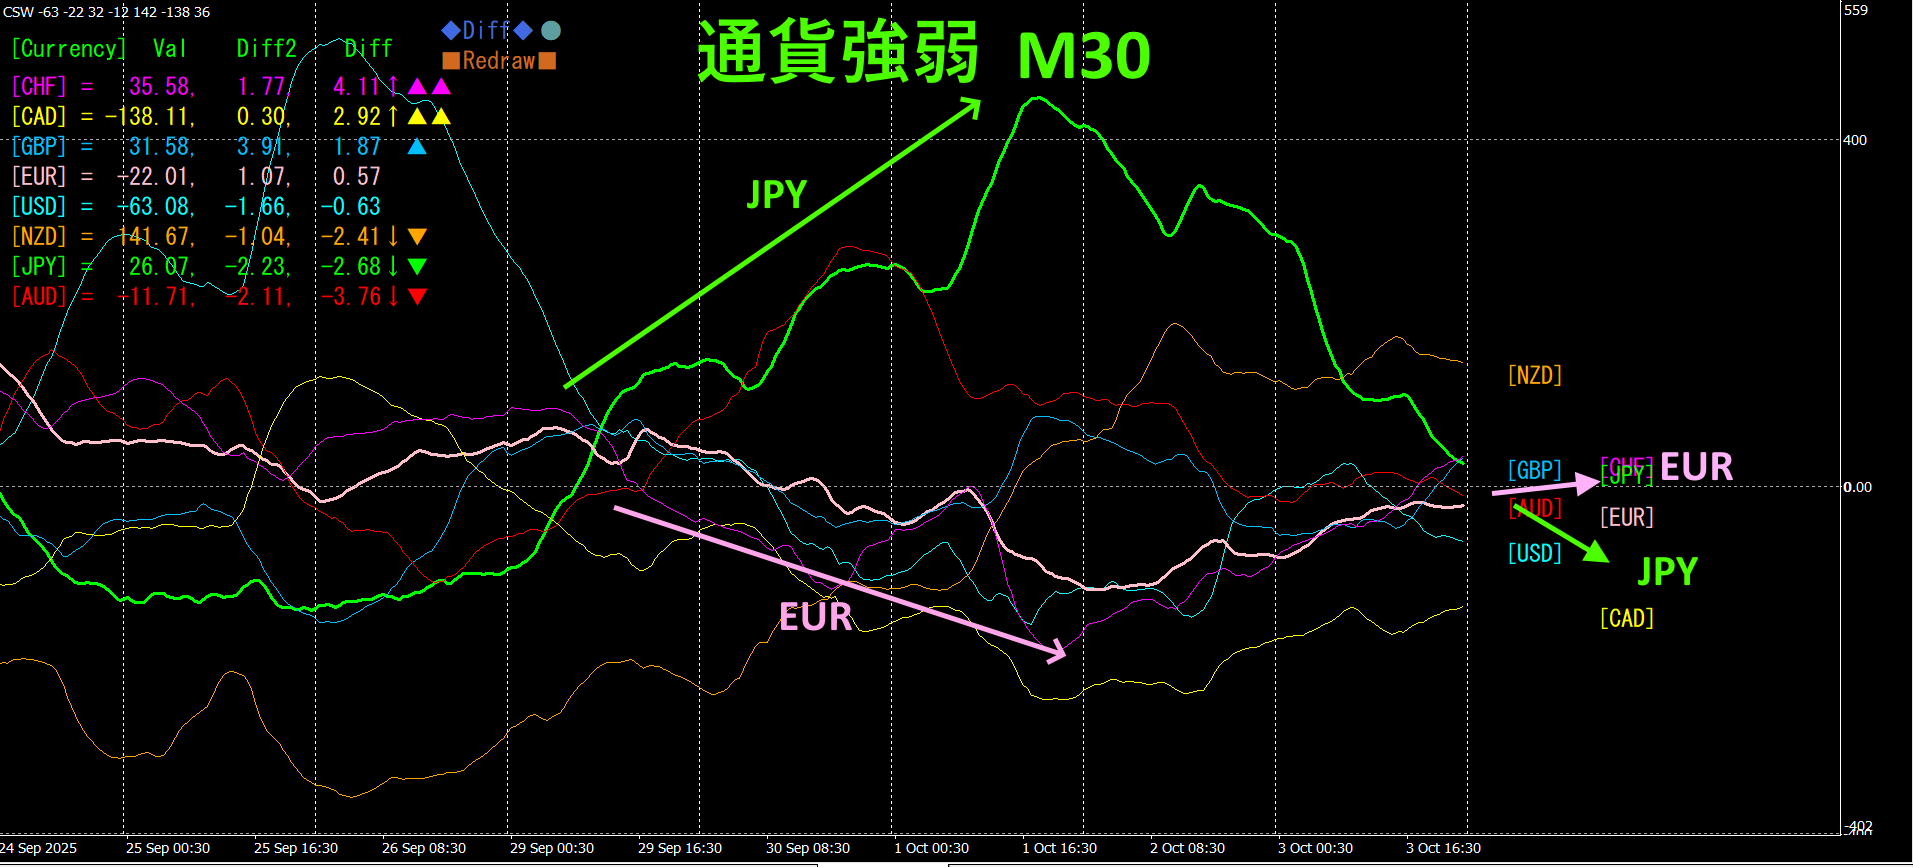
30分足の通貨強弱チャートです。
ピンク色がEUR、緑色がです。は水平からやや上向きに、はやや下向きになっています。あまりはっきりした方向が出ていませんが、は、上昇気味に推移するものと考えられます。
4.New indicator Dual_MACD_Trend_Indicator was tested.
New Indicator “Dual_MACD_Trend_Indicator” please see below.
MT4 version:https://www.gogojungle.co.jp/tools/indicators/62199
MT5https://www.gogojungle.co.jp/tools/indicators/62202
A trend indicator that clearly shows trend direction with color. If the color bar is Lime, it’s a buy; if Red, it’s a sell. It’s easy for beginners to use. If the bar is green, it’s an uptrend; if red, a downtrend; if no color, there is no trend. With color display, you can grasp the trend at a glance.
I installed this indicator on the AUDCAD 1 hour chart.
The red sell zone and green buy zone are clearly separated, making trading straightforward. In an uptrend, you just buy in the indicator’s green zone. This lets you focus only on the parts where the trend is rising and profit without forcing it.
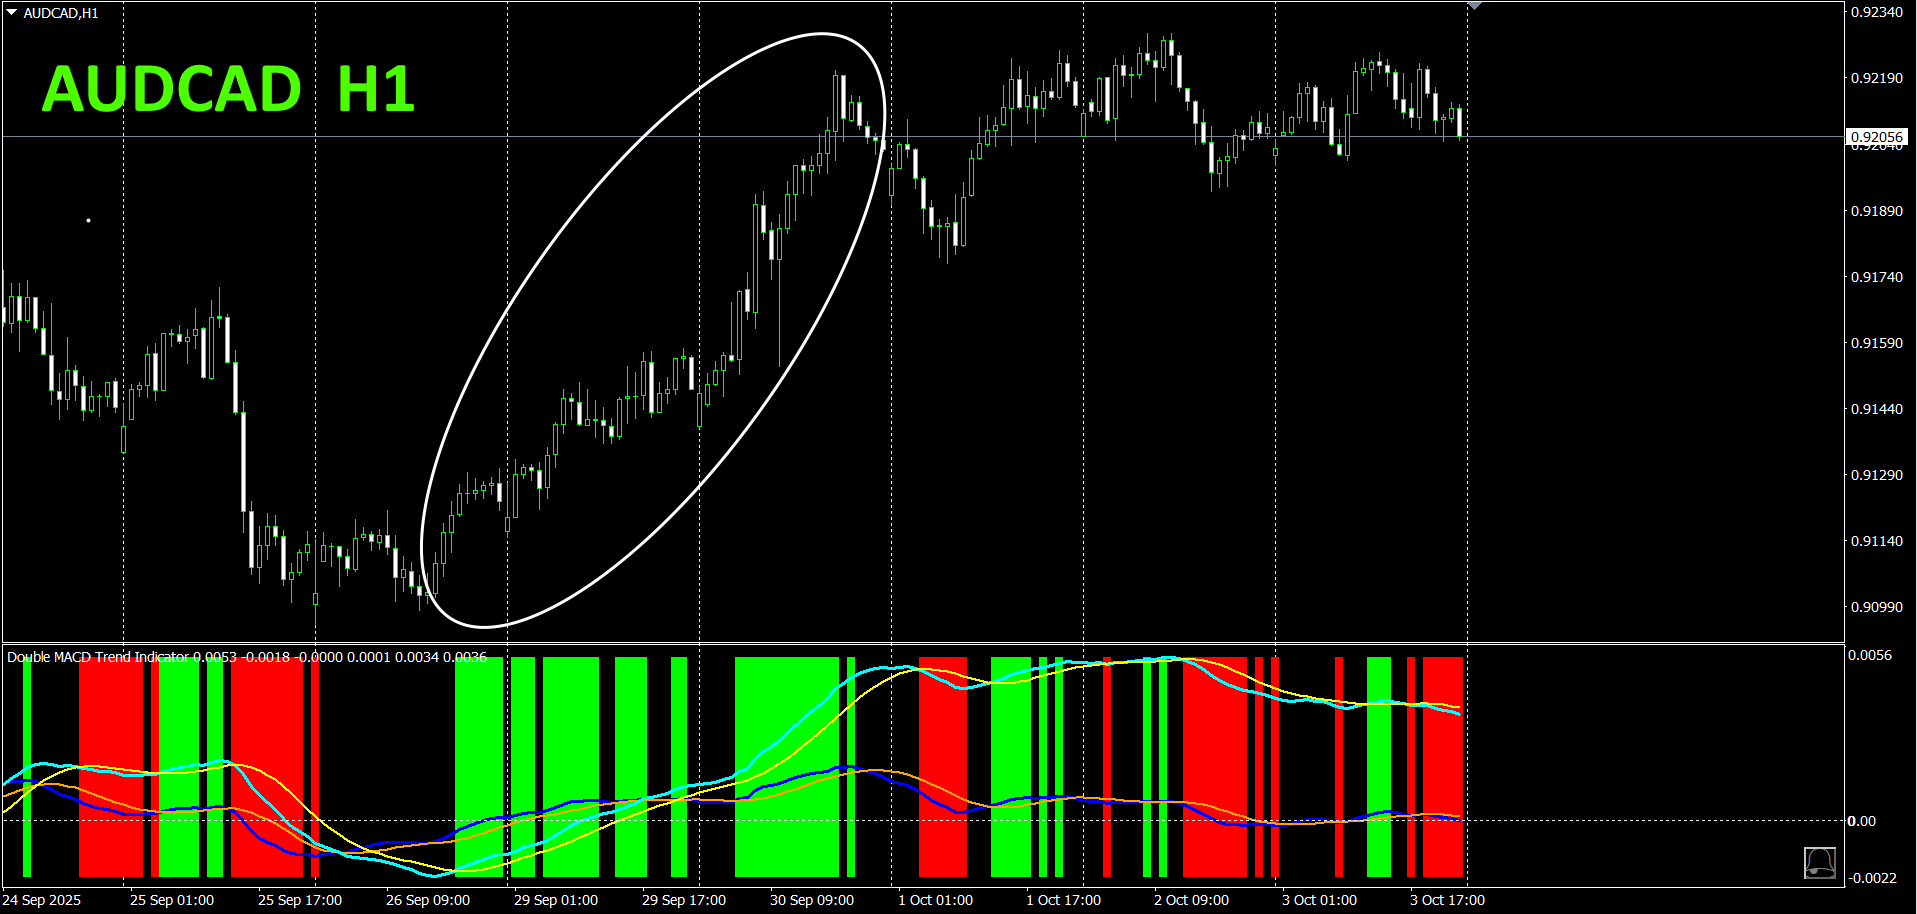
Using “, buy in the green zones, sell in the red zones, and do not trade otherwise.
With, you will no longer hesitate about the trading direction.
5.
“Hyper-CSW” has been released
“Hyper-CSW is a high-performance indicator that visualizes the strength of the eight major currencies at a glance. It records the strongest currency and a score for the past ten bars on the active timeframe, accurately capturing trend persistence and turning points. Additionally, it supports multi-timeframe analysis showing currency strength rankings (top four currencies) across multiple timeframes like M15, H1, H4, D1, and W1 with scores. Its highly legible color lines and separate window display give you the power to determine market direction.
https://www.gogojungle.co.jp/tools/indicators/65082
※Recommended indicators
“8CFD Visualization Indicator Any
https://www.gogojungle.co.jp/tools/indicators/32288
“Toretore Indicator”
https://www.gogojungle.co.jp/tools/indicators/50115
“TrendLine-EX”


https://www.gogojungle.co.jp/tools/indicators/42257
“8C Currency Strength Visualization Indicator” is described on the following page.

MT4 version https://www.gogojungle.co.jp/tools/indicators/39150
version https://www.gogojungle.co.jp/tools/indicators/39159
【My items for sale】


