

How will the USD/JPY 1-hour chart break above 14850, or…

Reviews & videos can be viewed here
Hello everyone.
Because I’ve been writing some quite important articles these past few days, I didn’t update the Investment Navigator yesterday so you could review them a few more times.
If there are no updates, the simple idea is that readers will reread the articles again.
Thanks to that, the number of readers has been increasing.
The USD/JPY is currently at a critical point.
USD/JPY 1-hour and 5-minute charts
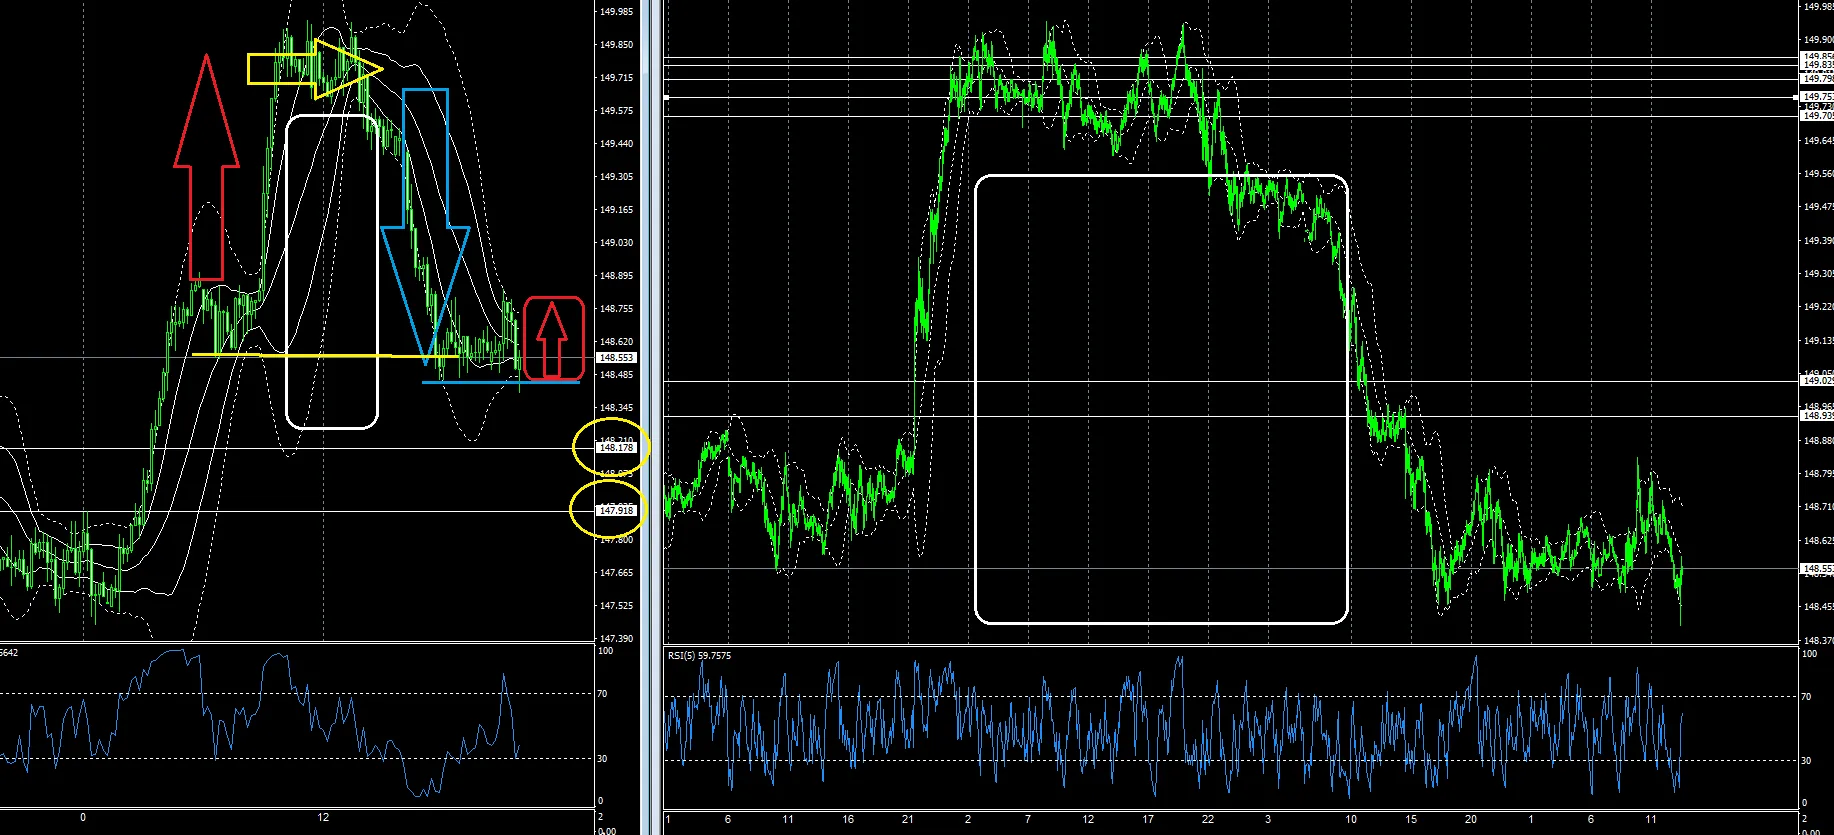
I switched to 5-minute intervals instead of 1 minute to view about three days.
As mentioned in recent articles, on the 1-hour USD/JPY chart, what rose also fell.
There is a range in the middle, but using the upper edge of that range as the peak, it seems to have dropped smoothly as usual.
A solid billion-trader line was drawn in the white square zone.
Going forward, will it form a range starting from the yellow horizontal line as before, break below the blue horizontal line, or form a range similar to the yellow line section, or perhaps continue rising toward the upper edge of the range as shown by the red arrow? It’s a four-way choice.
If a decline occurs, the target levels from the billion-trader chart seem to be around 14817 and 14791.
From the current price, that would be about 50–60 pips.
At the current stage, with about 40 pips of movement, considering a target of 1 yen, another 60 pips might move?
If it goes down, it would be a decline tightly aligned with the billion-trader line.
If it goes up, perhaps 14900 is the retracement limit.
I’m paying attention to what happens after London.
As a trader, I would recommend the following three products:
New Billionaire Trader Scalping: Volume Plus
FX Trading: Not Your Ordinary Hedging
Explosive Indicator: Turning into a Winning Trader
There you have it.
Thank you for your continued support today as well.
× ![]()