

Usage of the “Visualization Indicator” (Part 218)
"Visualization Indicator" usage (part218)
1. Further develop the "28 Currency Pairs List Indicator" into an indicator
"8CPVisualization Indicator"to plotUSDJPY.
There are versions of the "8CPVisualization Indicator": Oceania,London版版、NewYorkAnyCP版. This time, we used the London version.
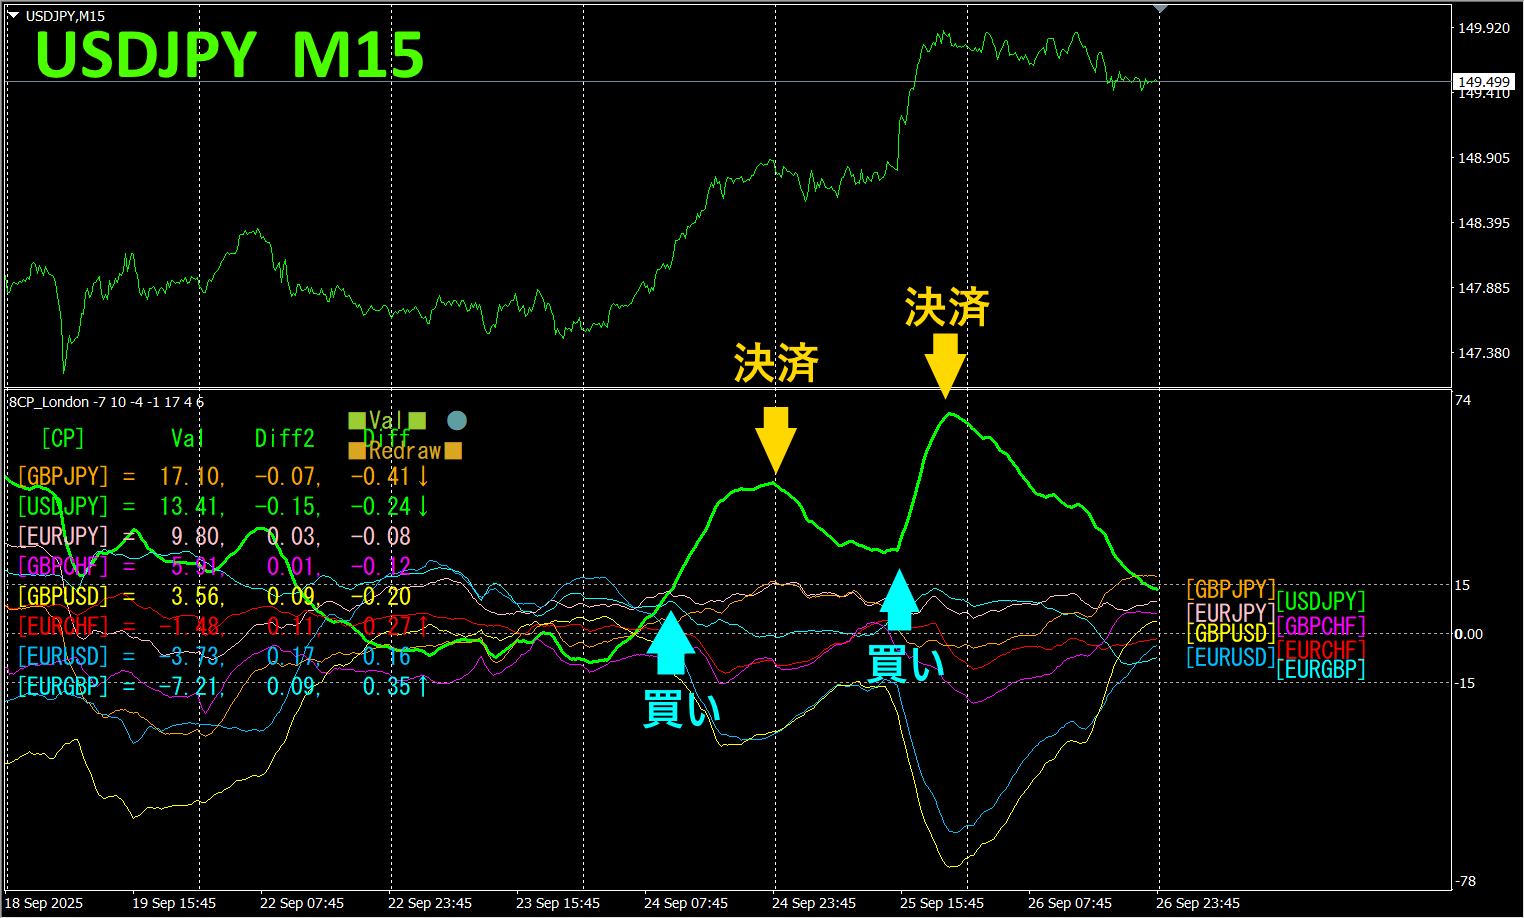
The top half is USDJPY's15minute chart. The bottom half is from the "8CPVisualization Indicator"; the green bold line graph corresponds toUSDJPY.
On Wednesday, the USDJPY chart rose above the other chart groups, so I took a long position. Similarly, on Thursday the graph rose, so I opened a long entry. Each moved roughly80pips and roughly100pips, for a total around180pips profit.
Currency Strength Graph
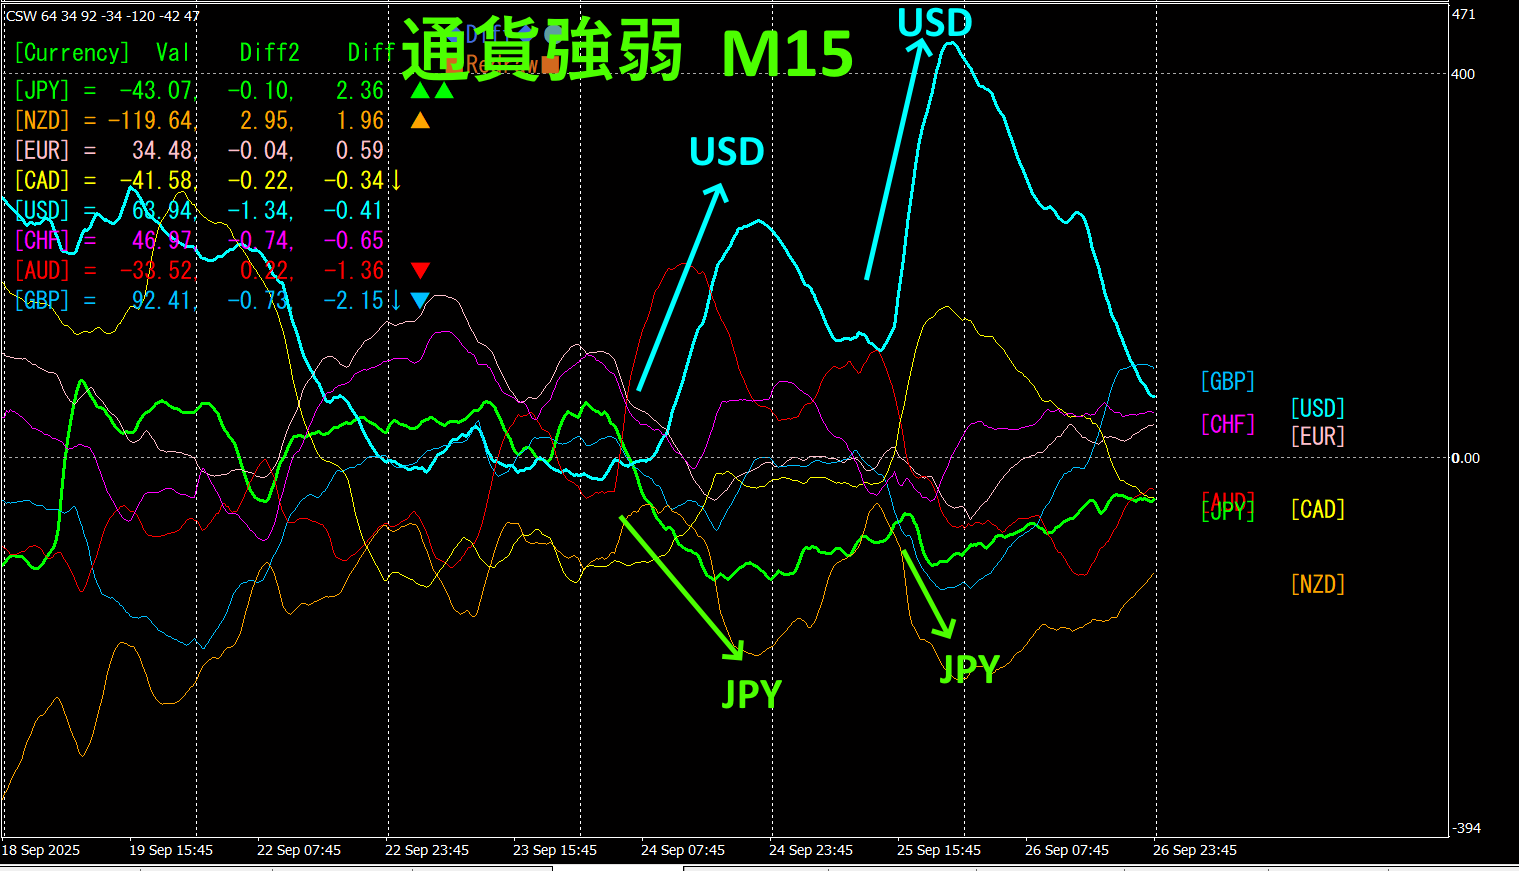
Looking at the 15-minute currency strength graph, USD and JPY show a remarkable inverse correlation.USD andJPY move from convergence to dispersion, soUSD>JPY, thus USDJPY profits by buying. The currency strength graph shows that both times USD got stronger, leading to the result.
If you pick the currency pair that is growing the most and is in a reverse correlation, trading will naturally yield results.
"Aim for currency strength reverse correlation!"isFX's law.
If you are using theTrendLine-EX, you can automate entry and exit when breaking diagonally through trendlines. You can leave it as is for easy trading. TheTrendLine-EX is a semi-automatic EA that can automatically sell on a break below a trendline and automatically close on a break above a trendline.
2. Best SelectIndicator to try
The figure below is a screenshot taken on2025 year9 month25 day 23:21 (JST)
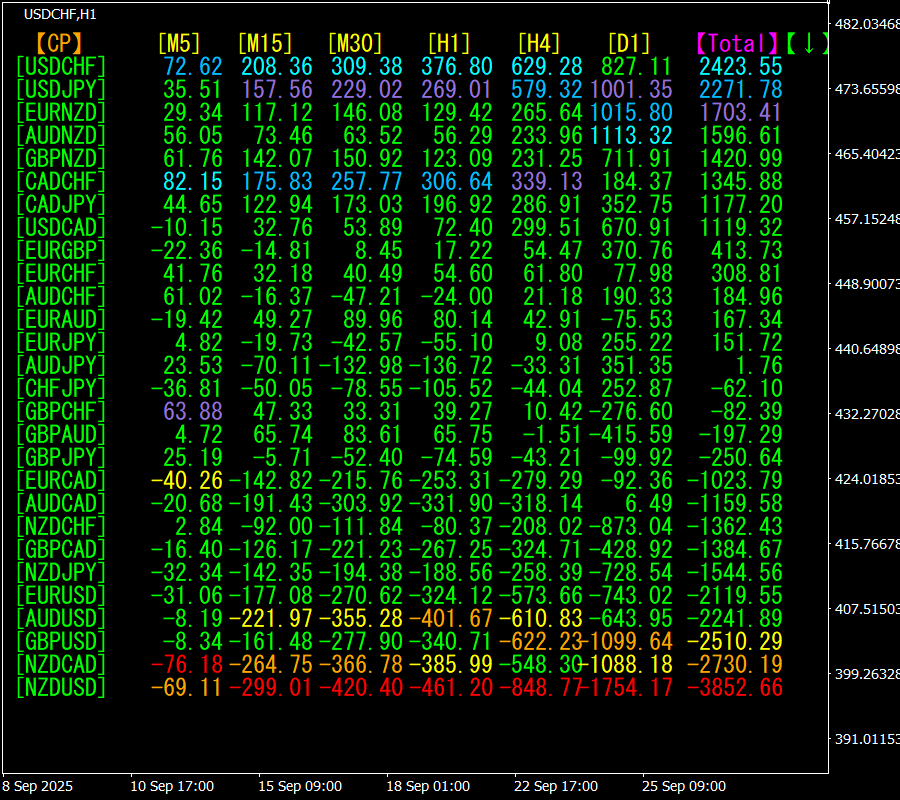
[Total]Numbers are sorted in descending order. The lowest one,NZDUSD, shows red across all timeframes. value isTotal-3852.66, a large negative number. This suggests a strong downtrend in NZDUSD.
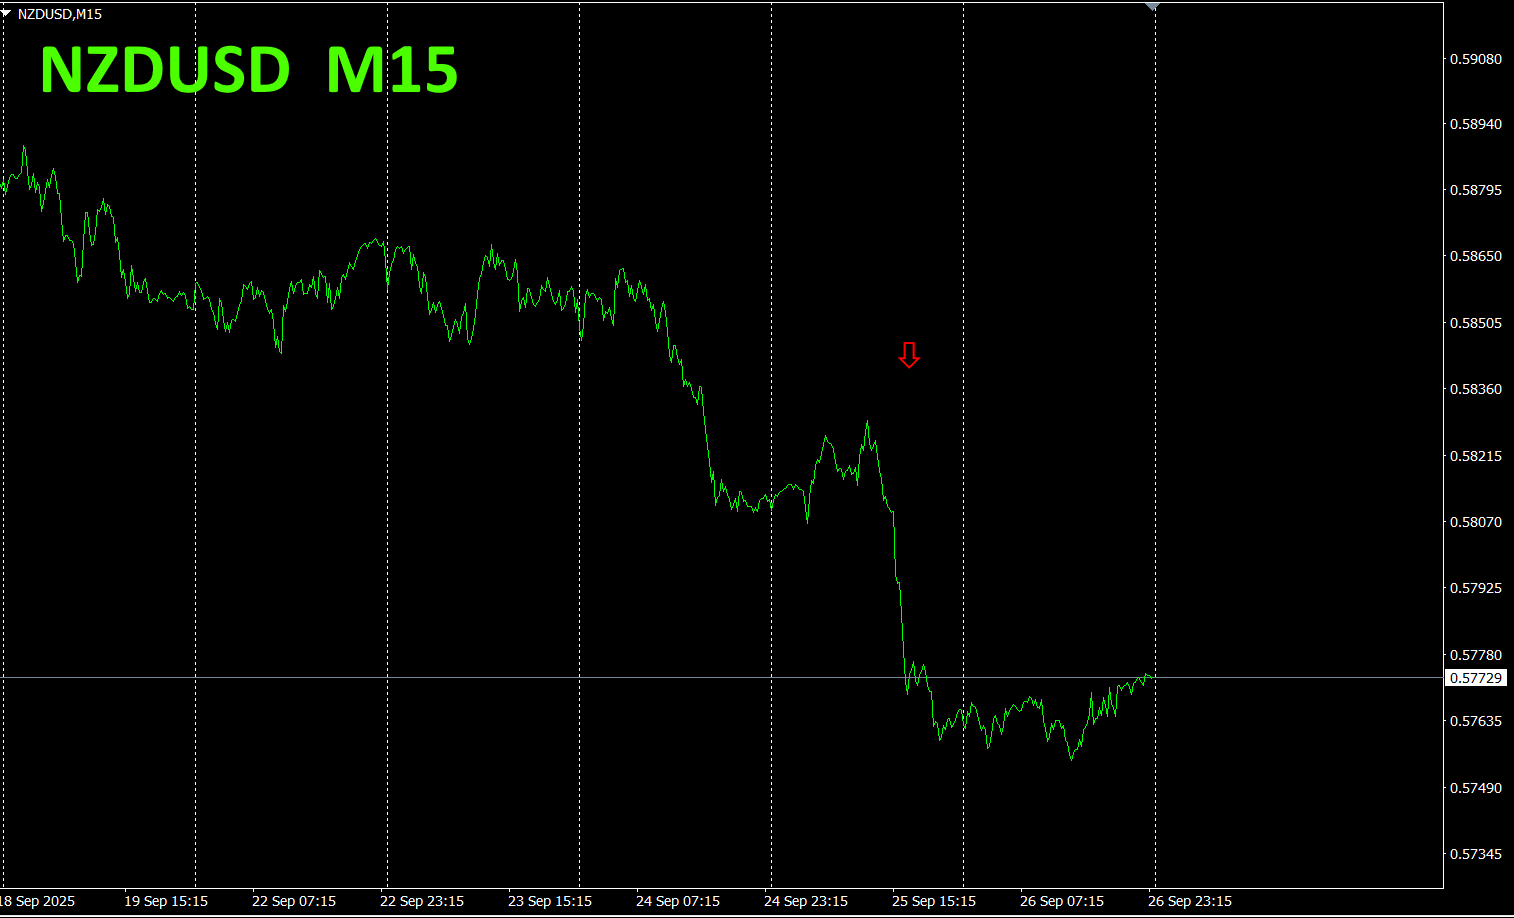
Now, let's look at the NZDUSD chart.
The red arrows indicate where the screenshot was taken. They capture a significant and sharp drop.
"28 Currency Pairs Best Select Indicator allows you to easily identify which currency is in the strongest trend among 28 currency pairs. It also tells you, with numbers and colors, whether you should trade now. It is an excellent indicator for quickly judging the overall movement of all currency pairs.
"28 Currency Pairs Best Select Indicator"

https://www.gogojungle.co.jp/tools/indicators/35128
3. 2021 year5 month to present
Since year5 month movement has been tracked.
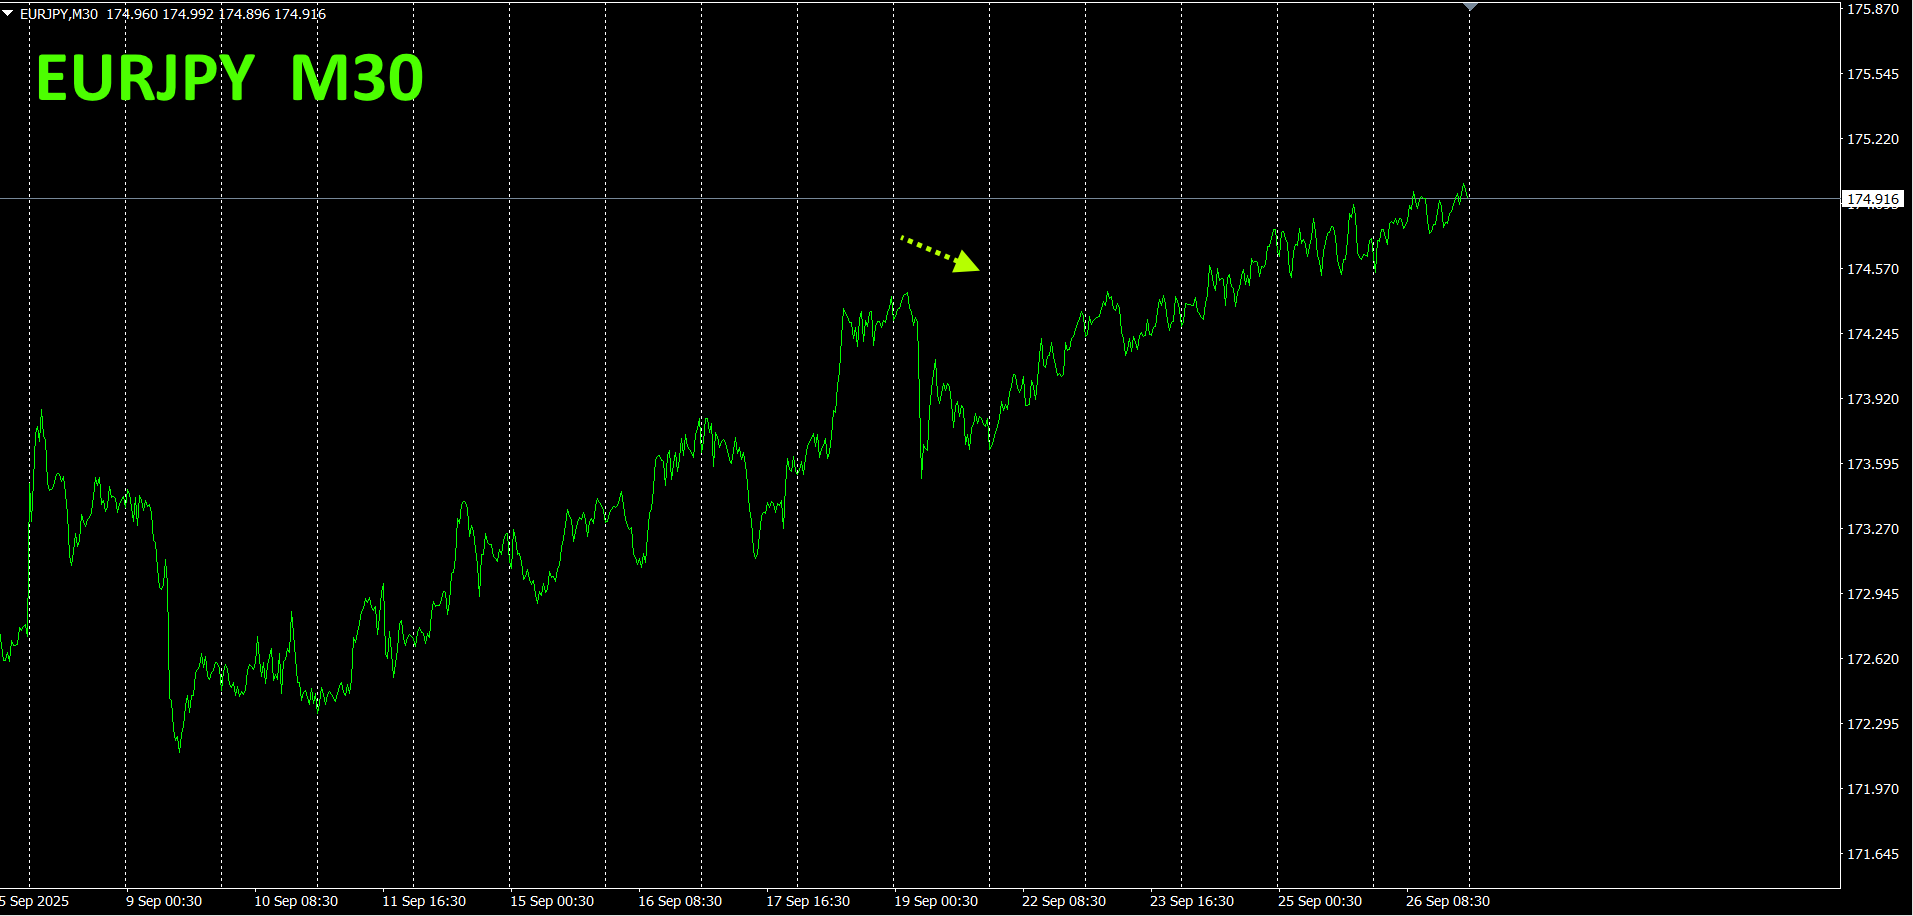
To view the overall trend, a30 minute chart depicting roughly the last3 weeks is drawn.
Previously, I wrote as follows.
Pink isEUR, green isJPYJPY. EUR is slightly upward from a flat level. In the future, is expected to show a stronger EUR vs JPY, so EURJPY is anticipated to trend slightly downward.
Contrary to expectations, it rose steadily.30-minute currency strength chart movement sometimes misses predictions.
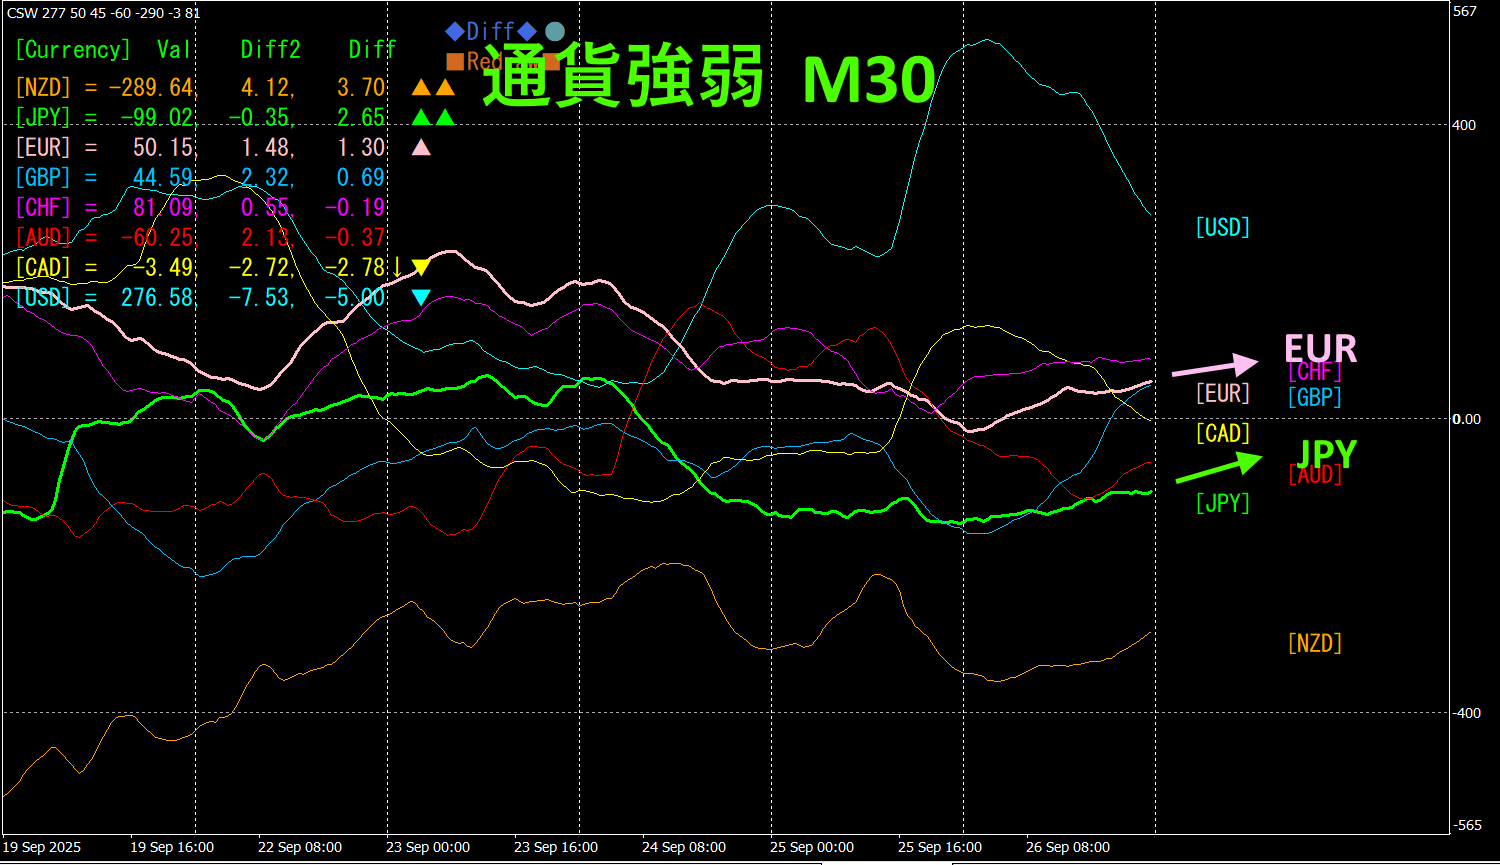
30-minute currency strength chart.
Pink isEUR, green isJPY. Both EUR are slightly upward from flat. In terms of currency strength, EUR sits above JPY, so >JPY, but direction is unclear. is expected to move in a range.
4. New IndicatorDual_MACD_Trend_Indicator trialed
New indicator “Dual_MACD_Trend_Indicator” please see below.
MT4 version:https://www.gogojungle.co.jp/tools/indicators/62199
https://www.gogojungle.co.jp/tools/indicators/62202
An indicator that clearly shows the direction of trend with color. If the color bar isLime, it is a buy; ifRed, it is a sell. It is an easy-to-use indicator for beginners. If the bar color is green, indicates an uptrend; if red, a downtrend; if no color, no trend. With color display, you can grasp the trend at a glance.
I have installed this indicator on USDJPY on the1hour chart.
The red sell zone and the green buy zone are clearly separated, making trading easy at a glance. In a downtrend, just keep selling in the red zone; in an uptrend, keep buying in the green zone. This allows you to focus only on the parts where the trend is strong and profit more comfortably.
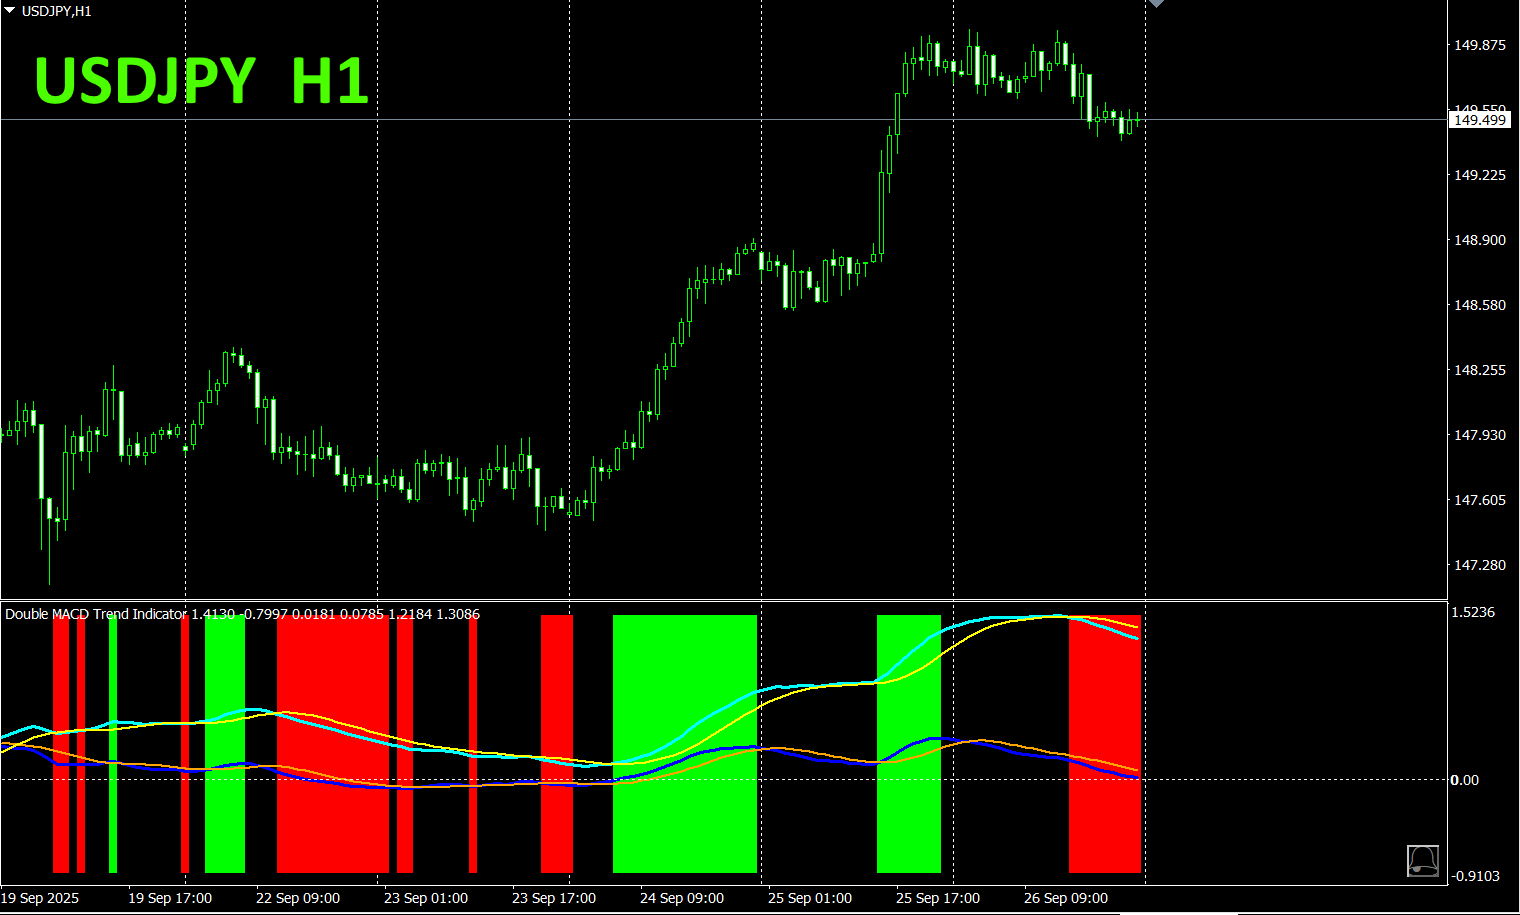
WithDual_MACD_Trend_Indicator, follow the simple rule: buy in the green zone, sell in the red zone, and do not trade otherwise.
UsingDual_MACD_Trend_Indicator removes any doubt about trading direction.
5.
“Hyper-CSW” has been released
“Hyper-CSW” is a high-performance indicator that visualizes the strength of the eight major currencies at a glance. It records the strongest currency and score for the current timeframe, enabling precise tracking of trend durability and turning points. Furthermore, it supports multiple timeframes (M15, H1, H4, D1, W1) showing currency strength rankings (top 4 currencies) with scores in a second window. Its highly legible color lines help you interpret market trends quickly and effectively.
For more details, see the following link.
https://www.gogojungle.co.jp/tools/indicators/65082

Recommended indicators
“8CFD Visualization Indicator version”
https://www.gogojungle.co.jp/tools/indicators/32288
“Toretore Indicator”
https://www.gogojungle.co.jp/tools/indicators/50115
“TrendLine-EX”

https://www.gogojungle.co.jp/tools/indicators/42257
“8C Currency Strength Visualization Indicator

version https://www.gogojungle.co.jp/tools/indicators/39150
【My listed products】


