

Utilization of the “Visualization Indicator” (Part 217)
“Visualization Indicator” usage (part217)
1. Further evolve the “28 Currency Pairs List Indicator” into an indicator
“8CP Visualization Indicator”to drawNZDUSD.
The “8CP Visualization Indicator” includesOceania version,London version,NewYork version,AnyCP version. This time, I used theOceania version.
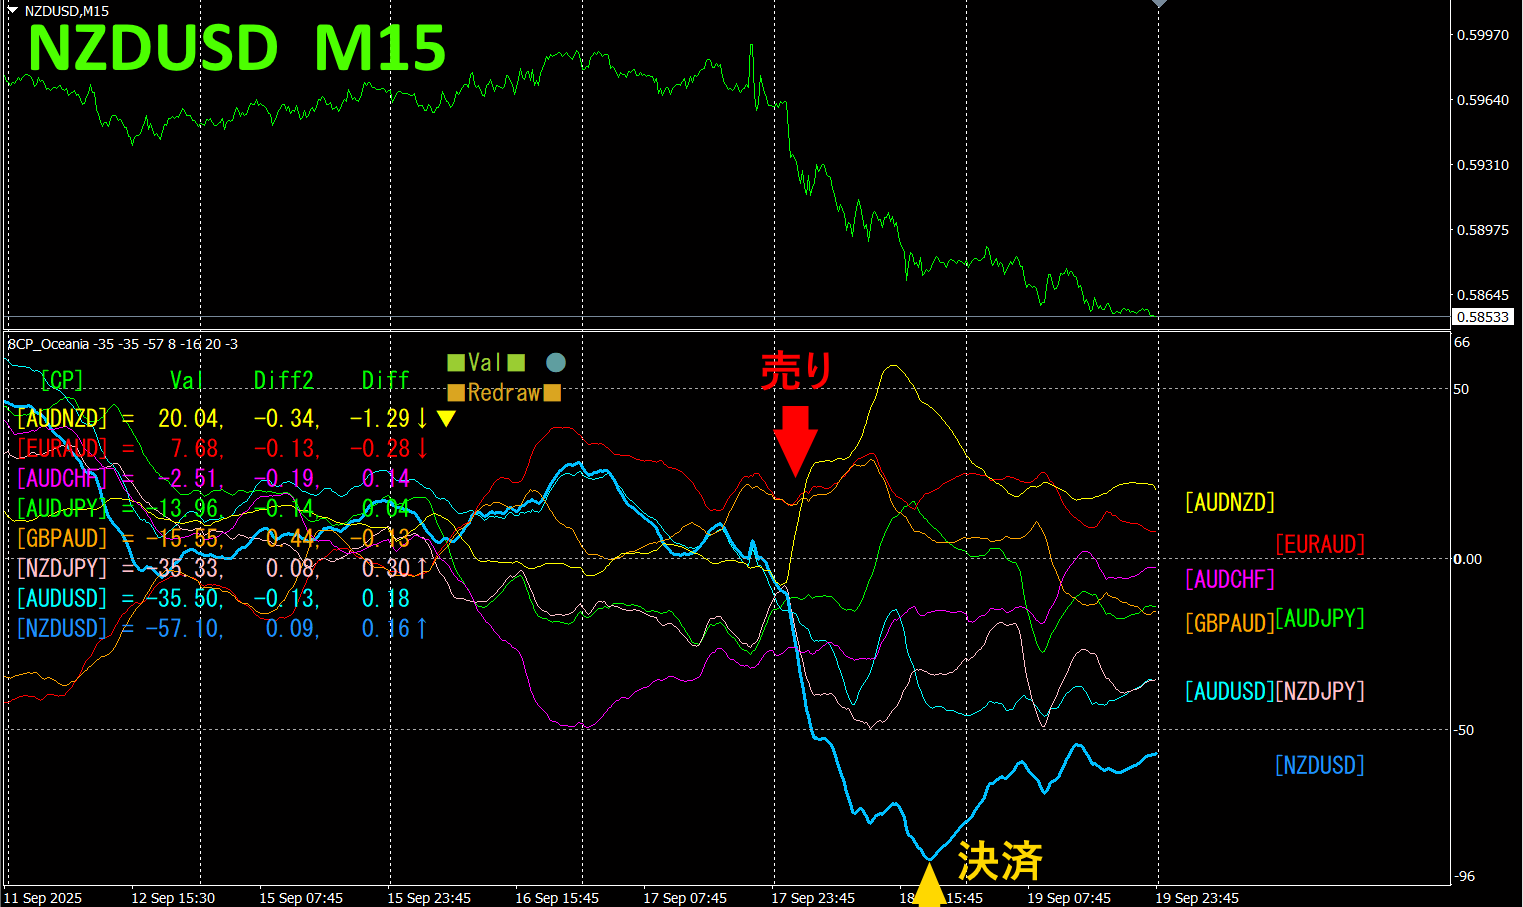
The upper half is theNZDUSD 15-minute chart. The lower half is from the “8CP Visualization Indicator”; the light blue thick line graph corresponds toNZDUSD.
On Thursday, theEURAUD chart fell below the other charts, so I traded short. I closed at the bottom for a profit of about60pips. The entry point for selling was the price breaking through a horizontal line drawn at the nearest low.
Currency Strength Space Graph
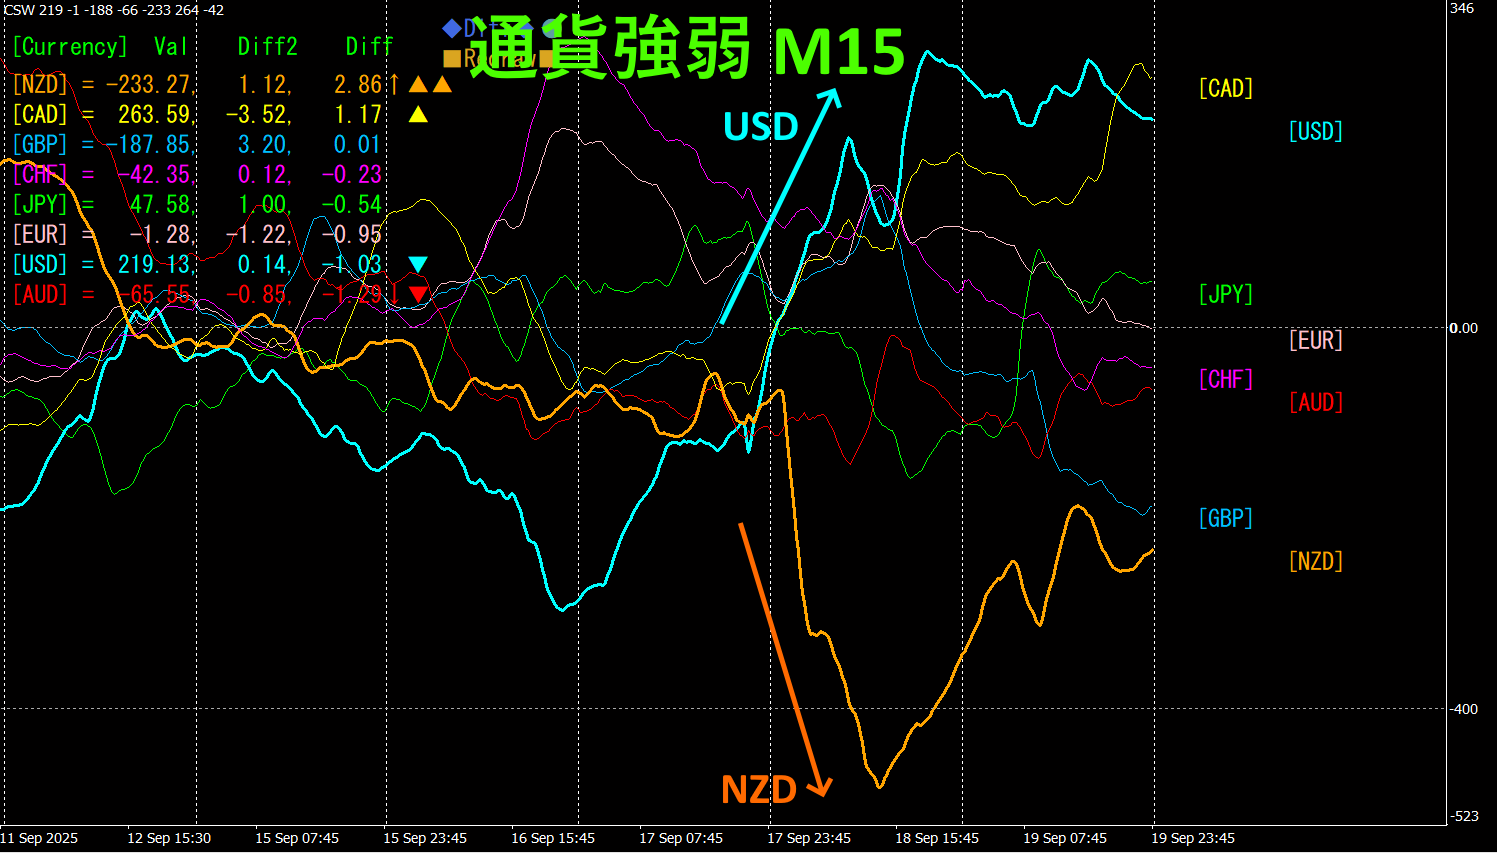
Looking at the 15-minute currency strength graph, USD and NZD show a remarkable inverse correlation.USD and NZD move from convergence to divergence, so since USD > NZD, you can profit from selling NZDUSD. By referring to the currency strength graph, you can easily spot Thursday’s selling point.
If you pick the currency pairs that are currently the strongest and weakest and trade them, results will follow naturally.
“Aim for Currency Strength Inverse Correlation!” is FX fundamental rule.
If you use “TrendLine-EX, you can automate entry and exit at diagonal trendline breaks. You can leave it as is for easy trading. “TrendLine-EX is a semi-automatic EA that can automatically sell on trendline breaks and automatically close on trendline breaks above.
2. Best Select try the indicator
The following image is a screenshot fromSeptember,18,03:10 (JST).
[Total]is sorted by descending numeric value. The lowest at the bottomUSDJPY shows red across all timeframes.Total value is-3287.60, a large negative figure.USDJPY indicates a strong downtrend.

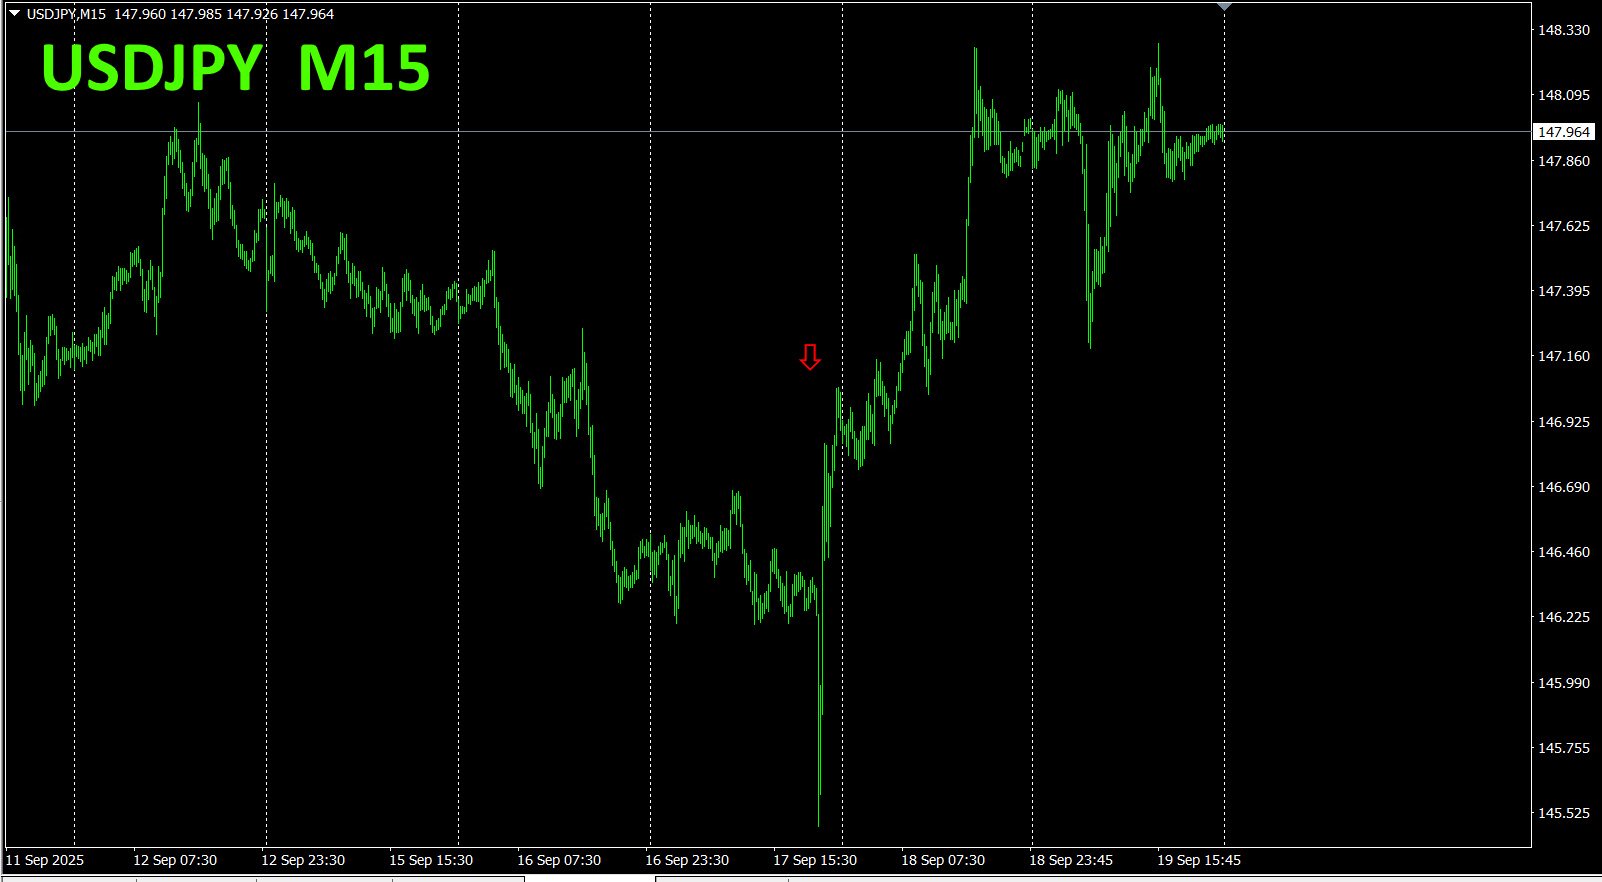
Now, let us look at the USDJPY chart.
The red arrow marks the snapshot area. It captures a sharp plunge.
The “28 Currency Pairs Best Select
The28 Currency Pairs Best Select indicator
https://www.gogojungle.co.jp/tools/indicators/35128

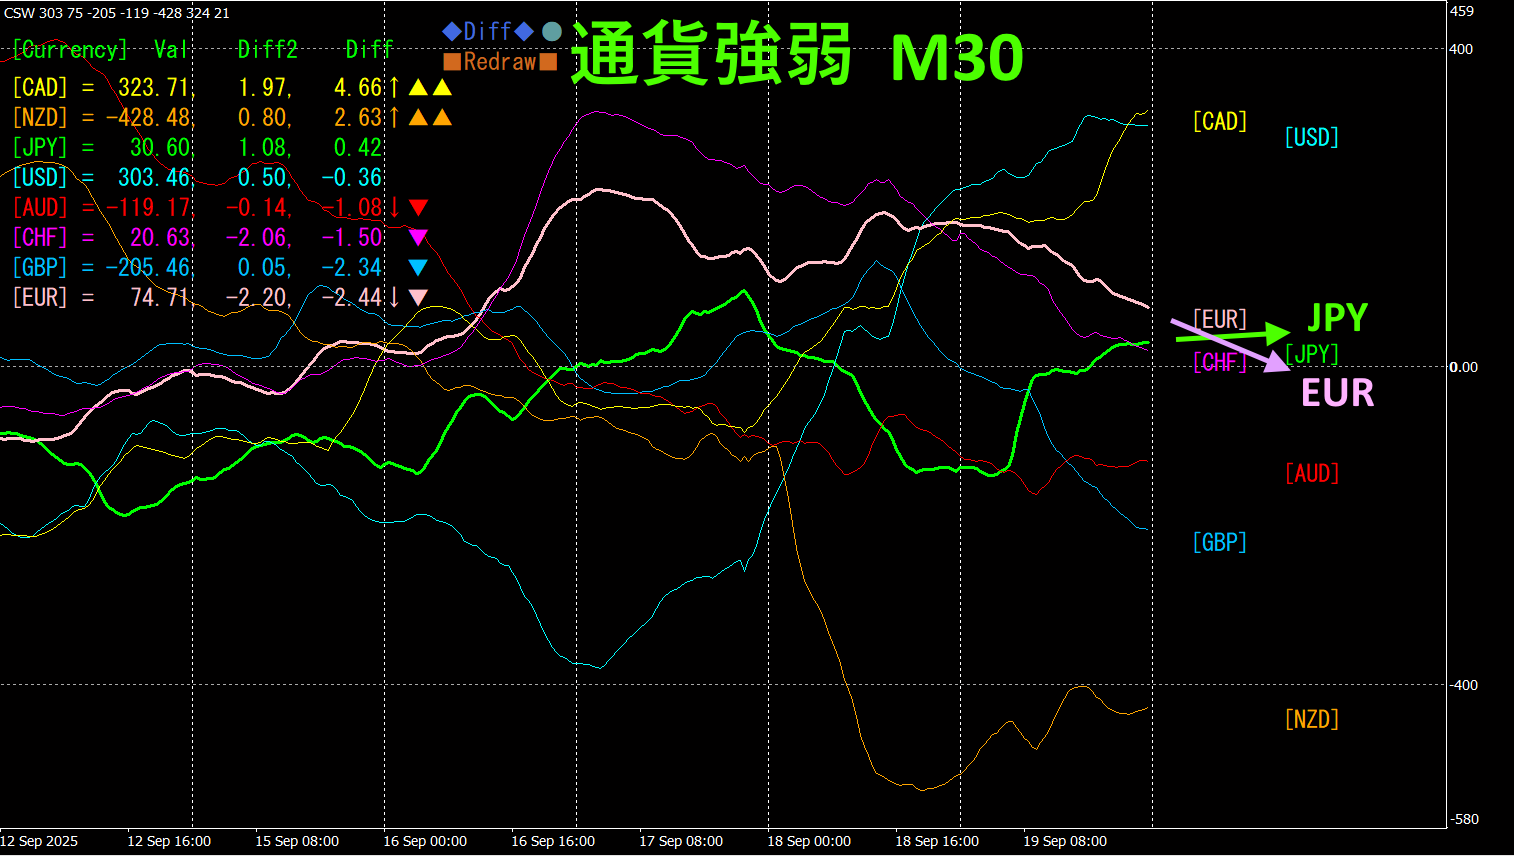
3. 2021 year5 monthto present EURJPY movement—what happened?
Since 20215month,EURJPY movement has been tracked.
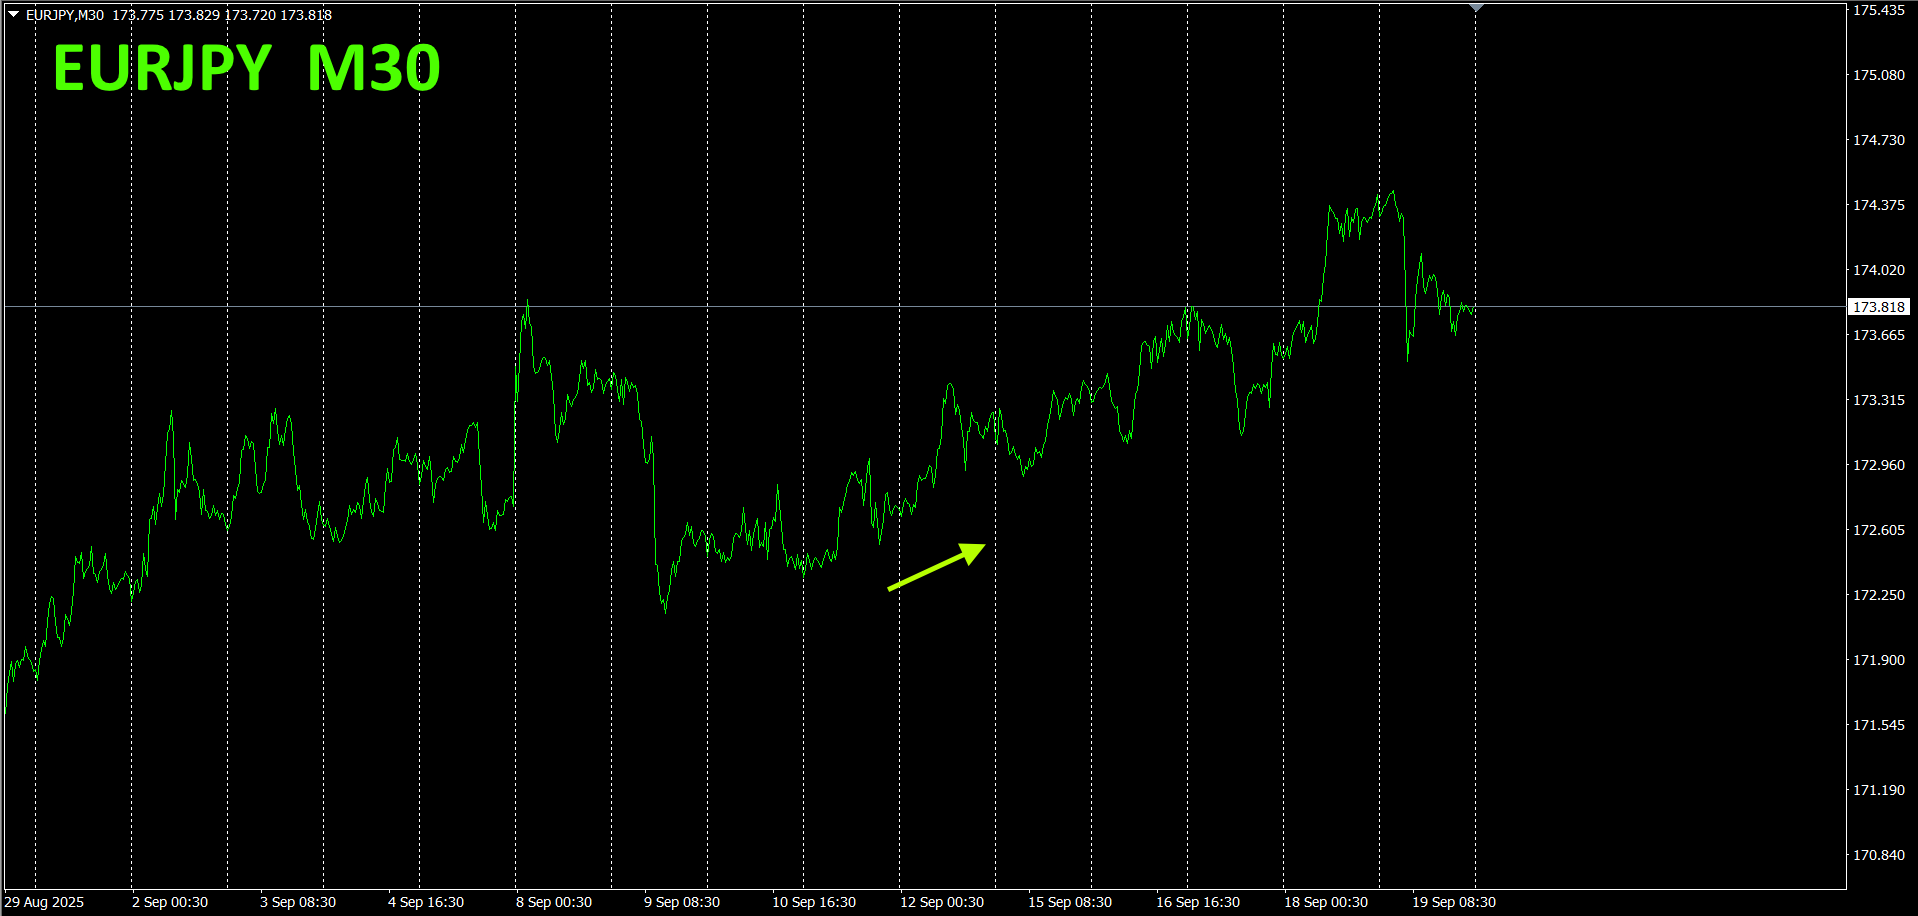
To view the overall trend, I am plotting roughly 3 weeks of recent 30-minute charts.
Previously I wrote the following.
Pink isEUR, green isJPYEUR andJPY are both slightly upward. EURJPY shown lacks a clear directional bias. From the slope, EURJPY is likely to rise slightly.
As predicted, it rose. If one had bought on Monday and closed on Friday, about70pips profit would have been realized.
Minute currency strength chart.
Pink isEUR, green isJPY.EUR is slightly downward,JPY is slightly upward from the horizontal. Going forward, dynamics are expected, so is anticipated to trend slightly lower.
4. Trying the new indicatorDual_MACD_Trend_Indicator.
The new indicator “Dual_MACD_Trend_Indicator” is described below.
MT4 version:https://www.gogojungle.co.jp/tools/indicators/62199
https://www.gogojungle.co.jp/tools/indicators/62202
It is an indicator that clearly shows the direction of the trend with colors. If the color bars areLime, it’s a buy; ifRed, it’s a sell. It’s beginner-friendly and easy to use. If the bars are green, it indicates an uptrend; if red, a downtrend; if no color, there is no trend. With color display, you can grasp the trend at a glance.
I have applied this indicator toUSDJPY on the1 hour chart.
The red sell zone and green buy zone are clearly separated, making trading easy at a glance. In a downtrend, simply sell within the red zones; in an uptrend, simply buy within the green zones. This focuses on the parts where the trend is moving and helps you profit with less effort.
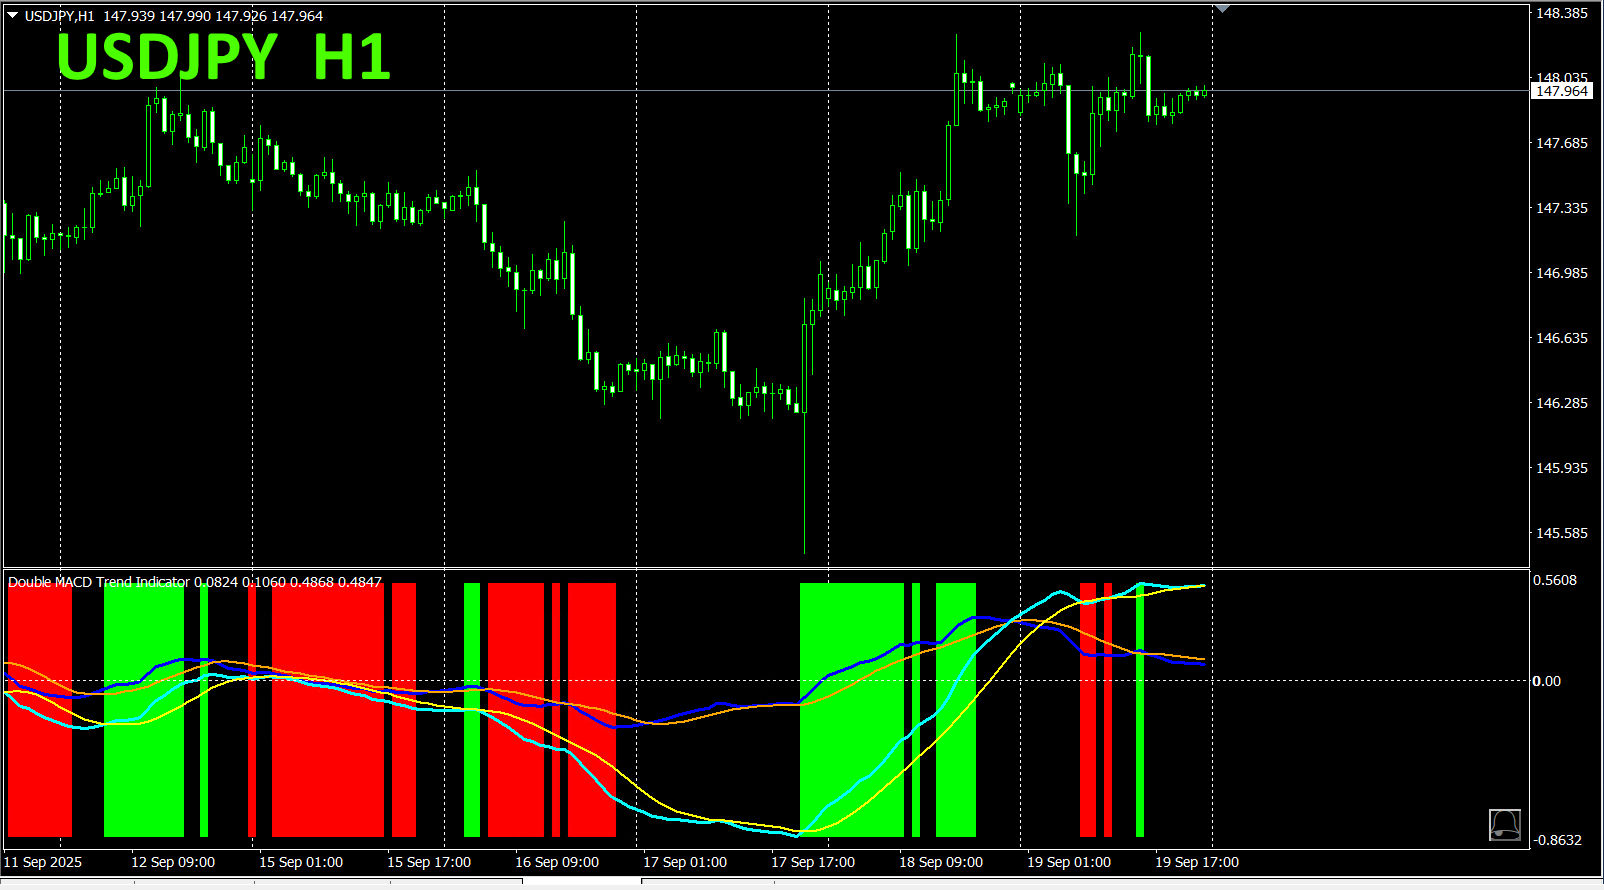
With the “Dual_MACD_Trend_Indicator”, follow the simple rule: buy in green zones, sell in red zones, and do not trade otherwise.
Using the Dual_MACD_Trend_Indicator eliminates any doubt about trade direction.
5.
“Hyper-CSW” has been released
“Hyper-CSW” is a high-performance indicator that visually consolidates the strength of the eight major currencies at a glance. It records the strongest currency and its score for the past10 bars on the current time frame and accurately captures trend persistence and turning points. It also supports multi-timeframe analysis showing currency strength rankings (top44 currencies) across multiple timeframes such as
https://www.gogojungle.co.jp/tools/indicators/65082
6. The “8CFD Visualization Indicator Any
“8CFD Visualization Indicator Any version can be used with any Symbol. You can set a custom Symbol to compare cryptocurrencies with USDJPY. The chart is daily.

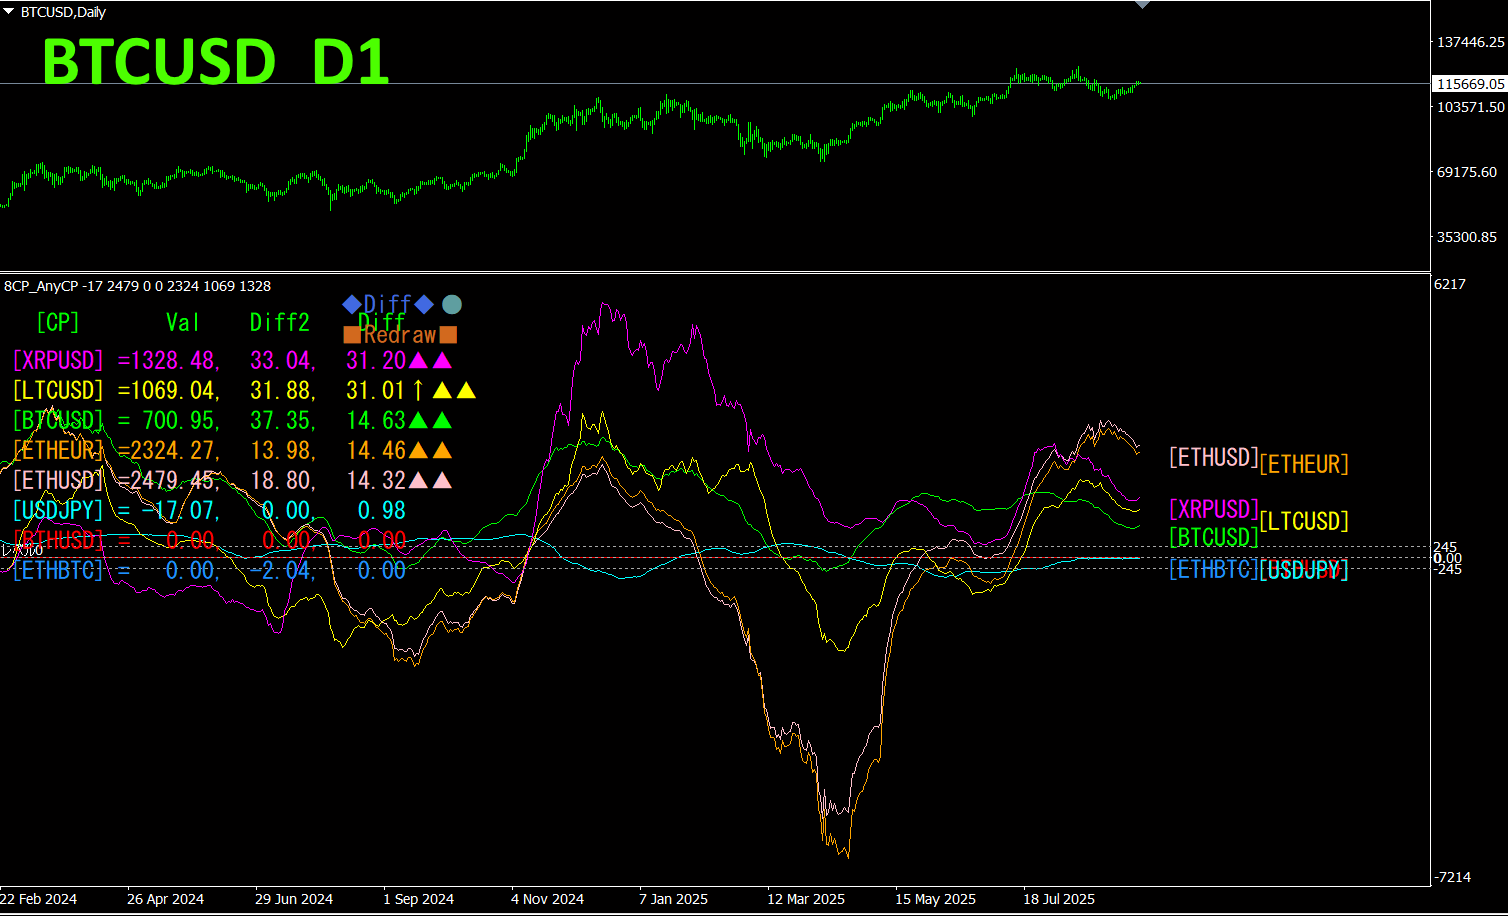
When compared with the USDJPY chart (light blue), you can clearly see how volatile cryptocurrencies are.In April 2025, ETHUSD plummeted dramatically. it rose again and formed a peak. Although hindsight now, if you had bought ETHUSD in April and sold in August, you would have realized substantial profits.
Recommended Indicators
“8CFD Visualization Indicator Any version”
https://www.gogojungle.co.jp/tools/indicators/32288
“Toretore Indicator”
https://www.gogojungle.co.jp/tools/indicators/50115
“TrendLine-EX”
https://www.gogojungle.co.jp/tools/indicators/42257

“8C Currency Strength Visualization Indicator” please refer to the following page.

version https://www.gogojungle.co.jp/tools/indicators/39150
version https://www.gogojungle.co.jp/tools/indicators/39159
【My items for sale】


