

【September 20, 2025】Verification of the Deisigning (Deisuing?) Method for the Sky and Earth Indicator (New Zealand Yen)
This time, we will introduce entry points for NZDJPY (New Zealand Dollar/Japanese Yen).
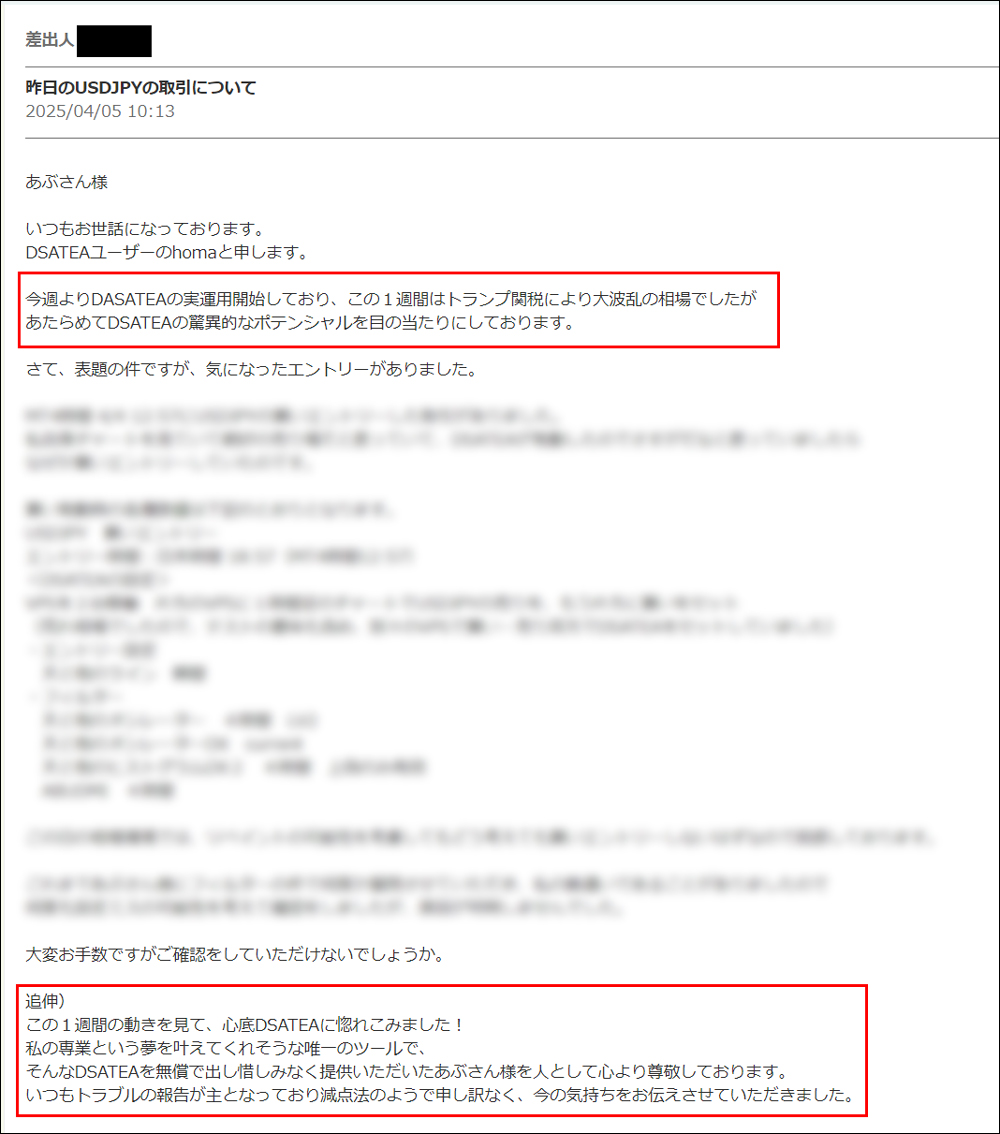
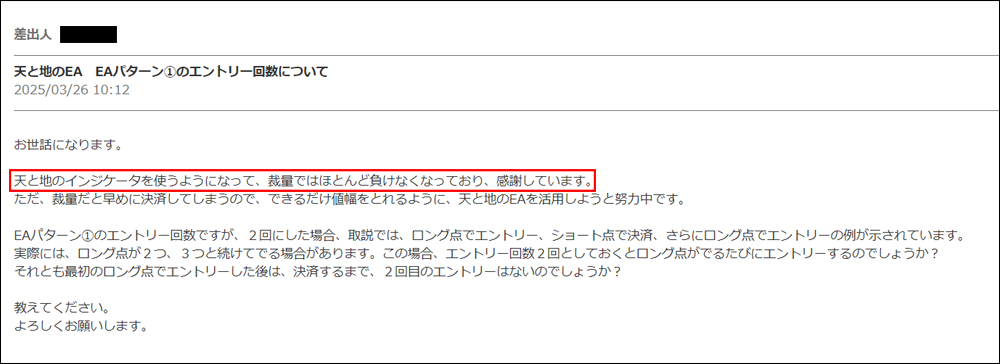
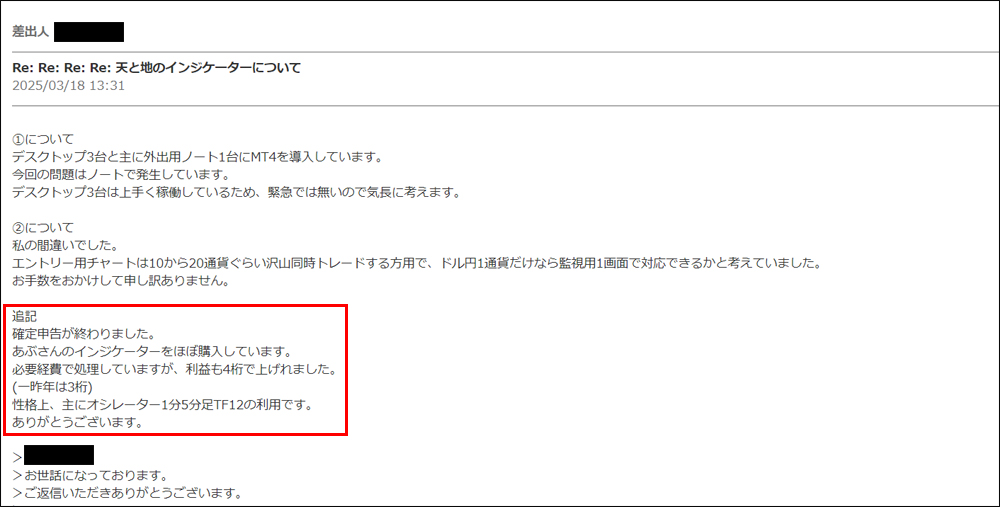
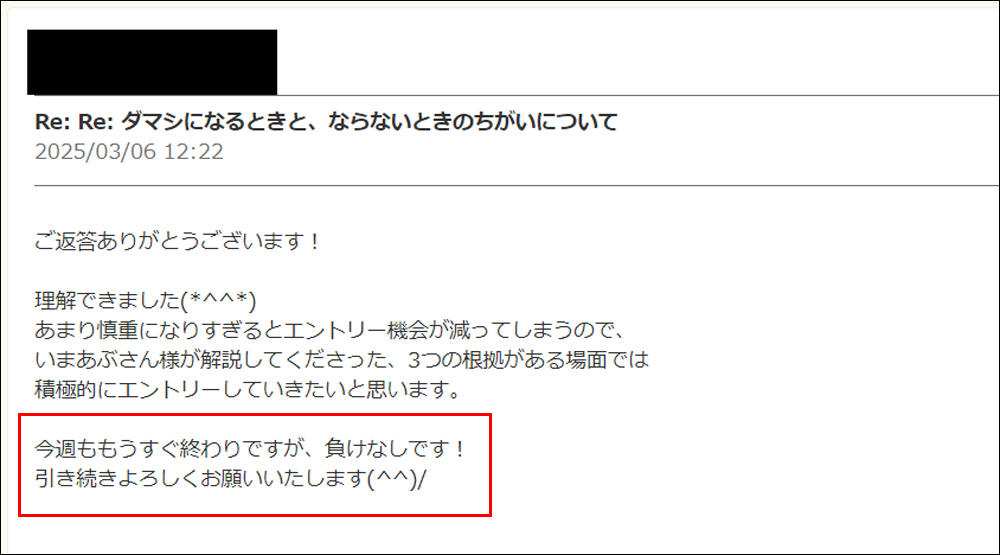
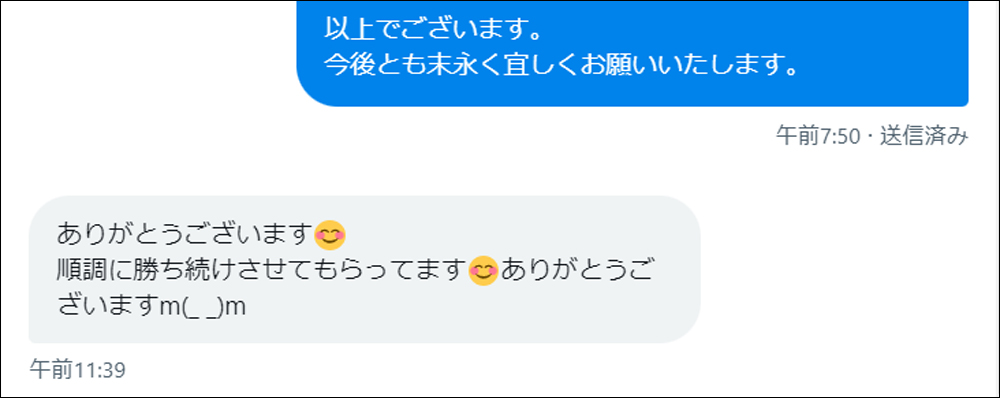
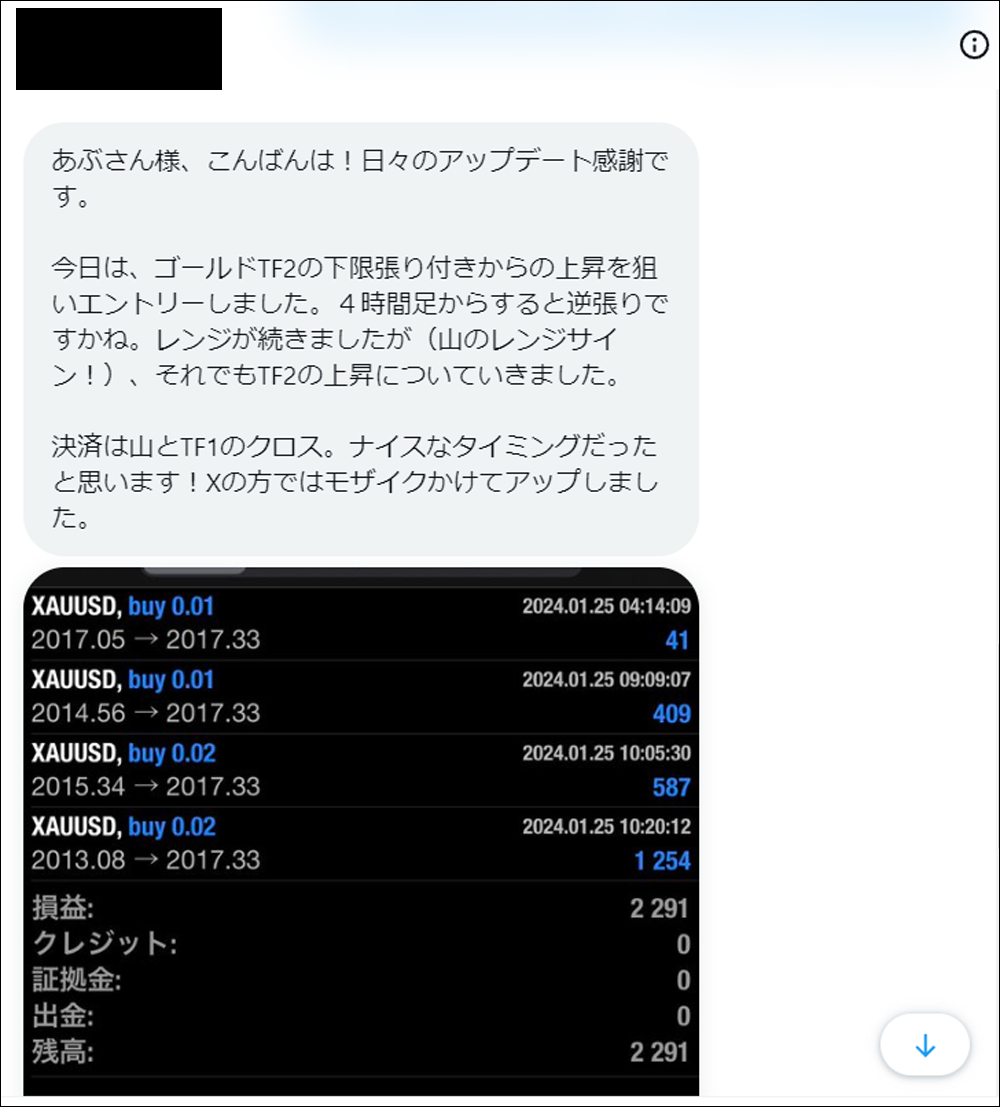
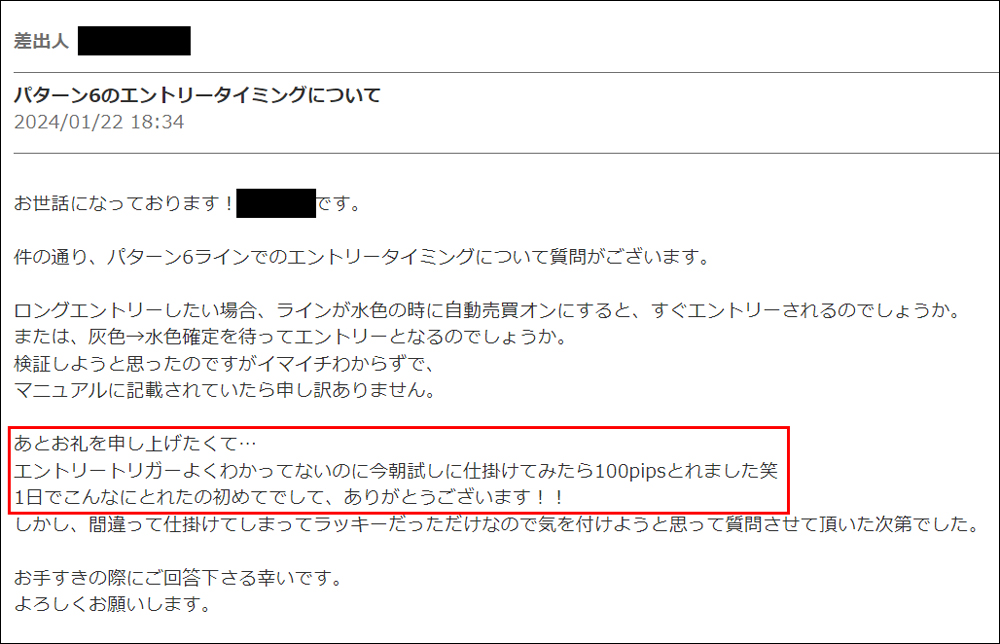
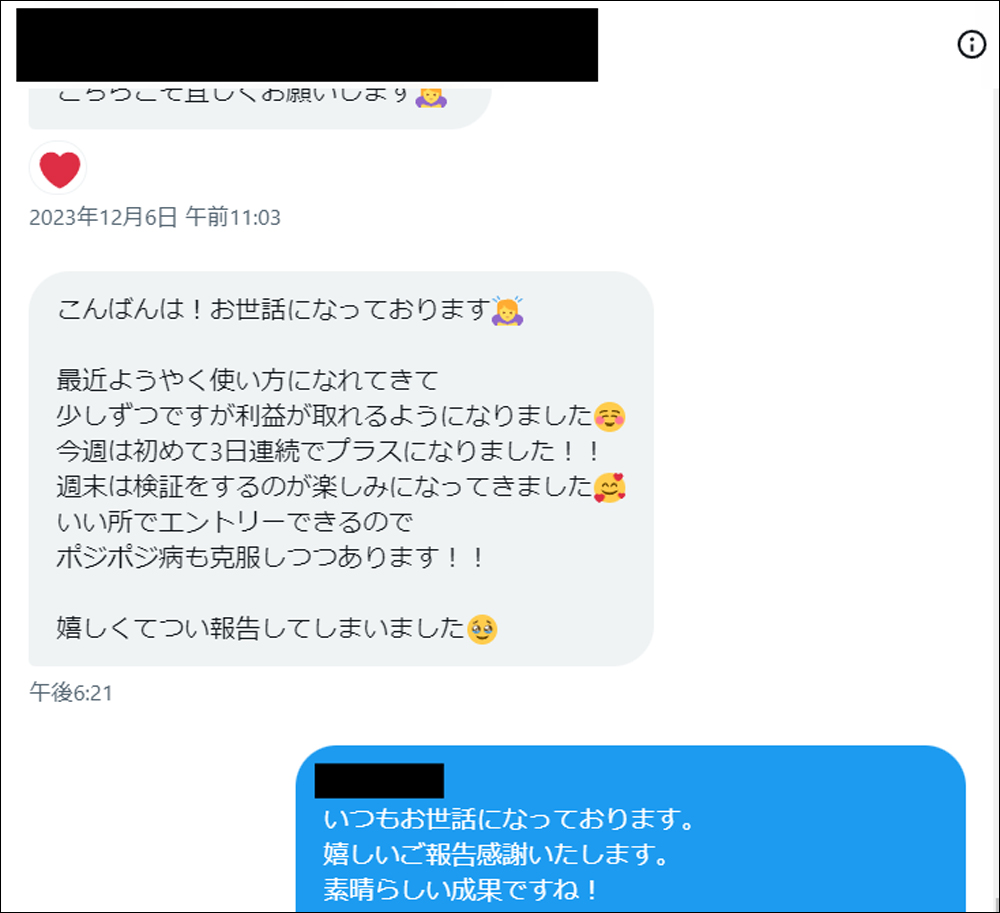


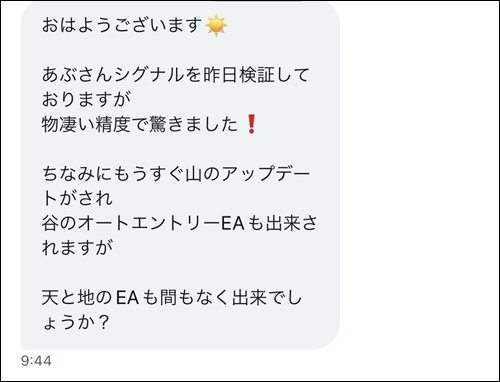
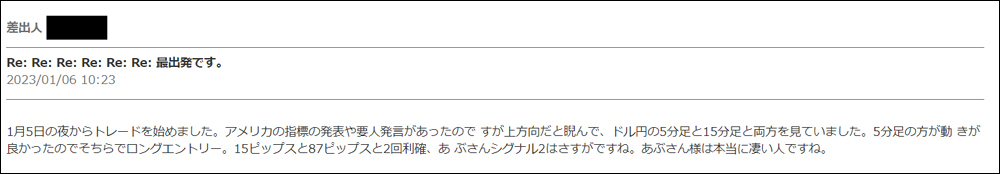
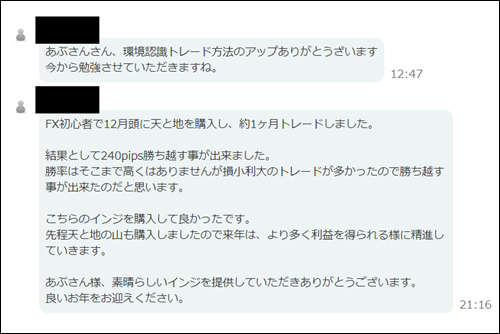
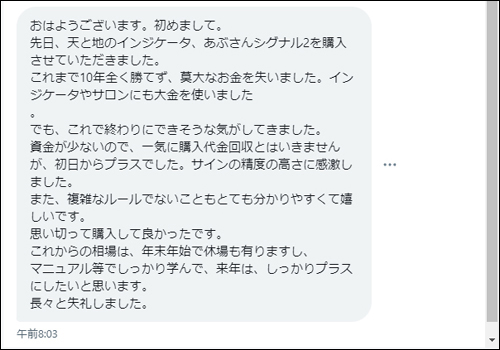
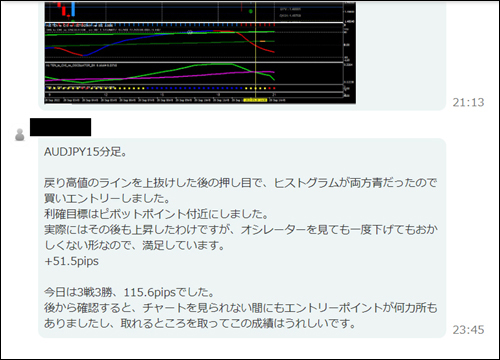
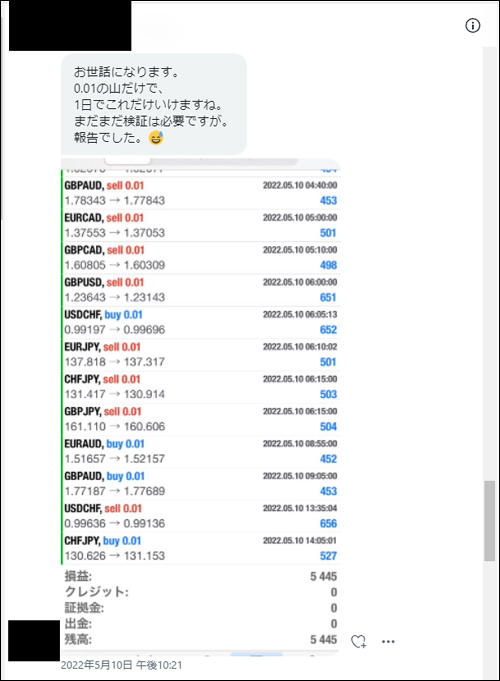
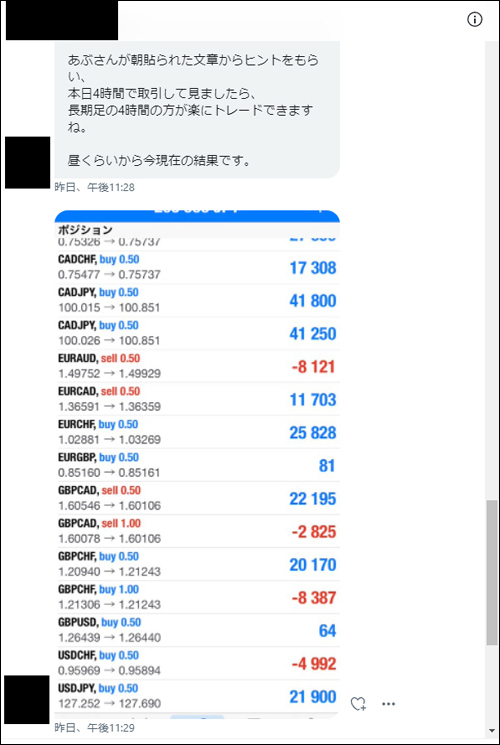
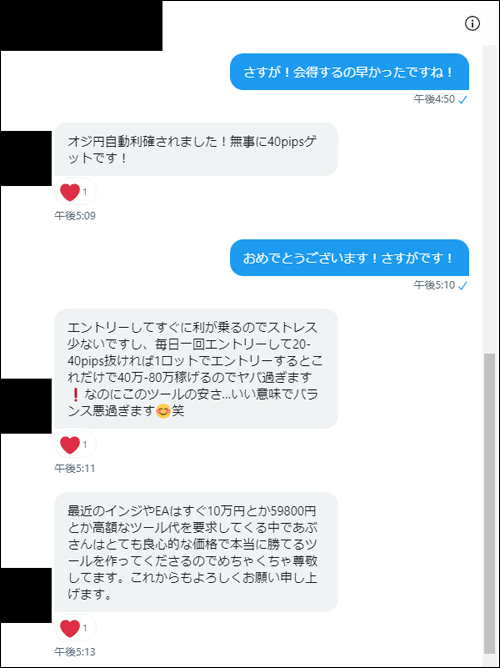
・In articles linked below, we introduce valuable DMs, reviews, posts from users and monitors. We carefully select winning reports and other useful DMs, so we believe they will be a参考 for everyone. We更新 periodically, so please take a look when you have time.
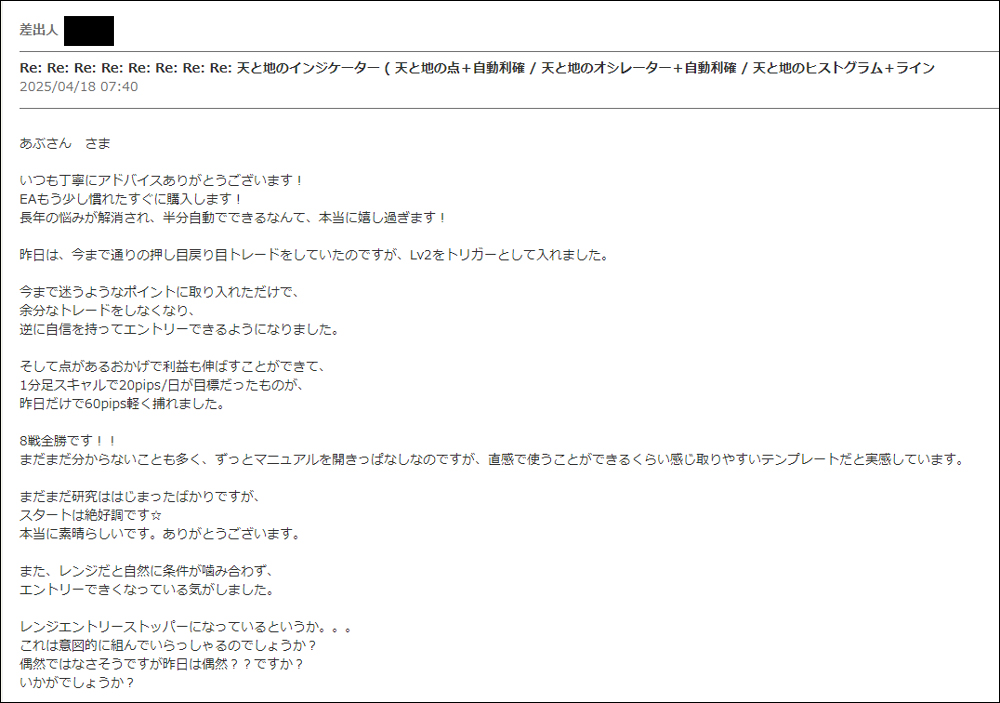
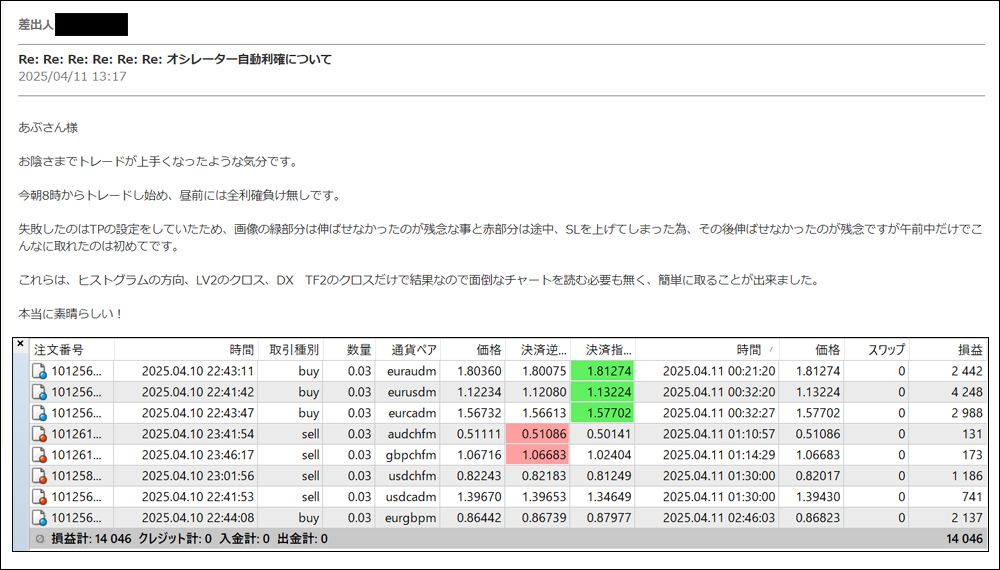
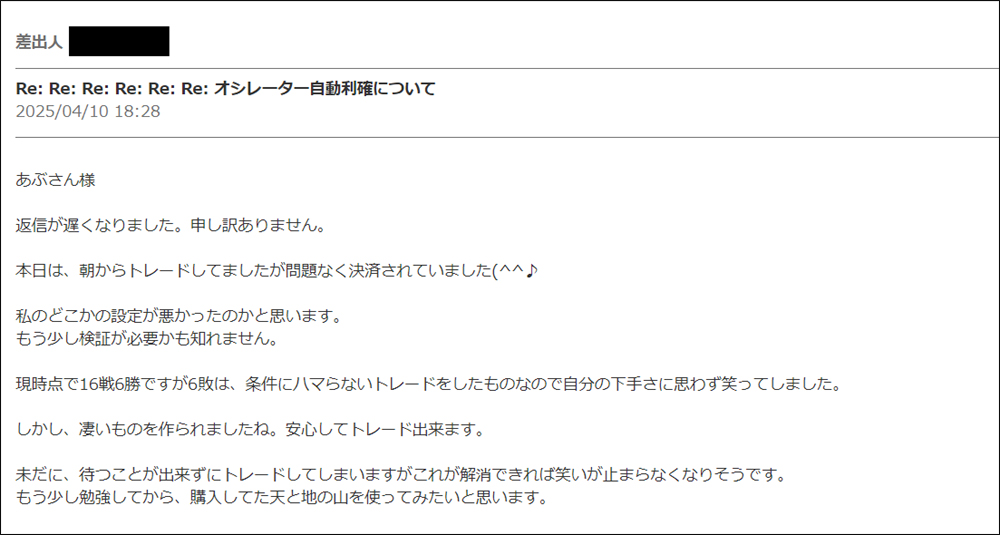
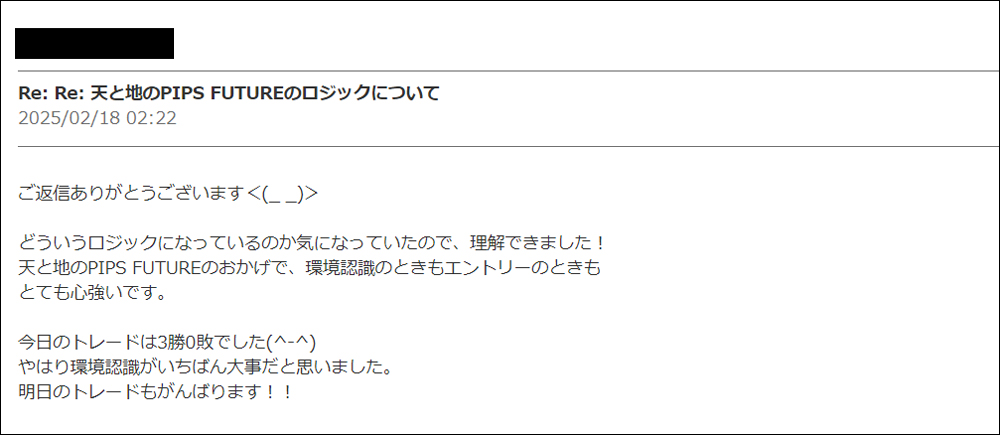
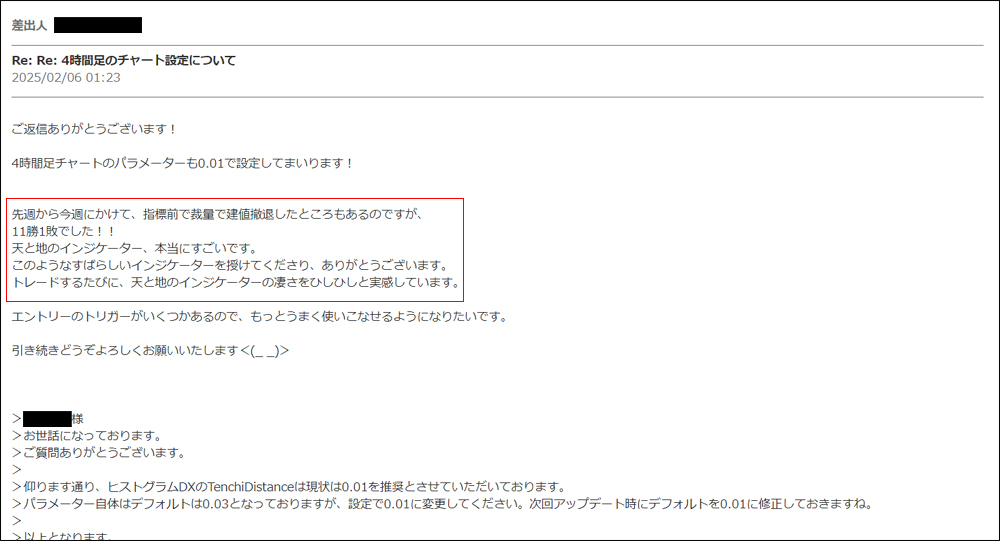
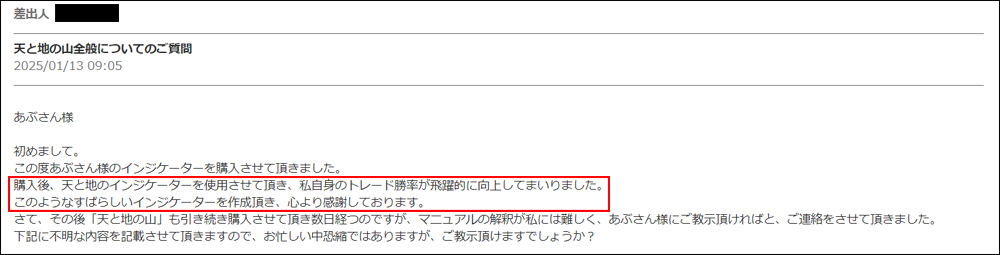
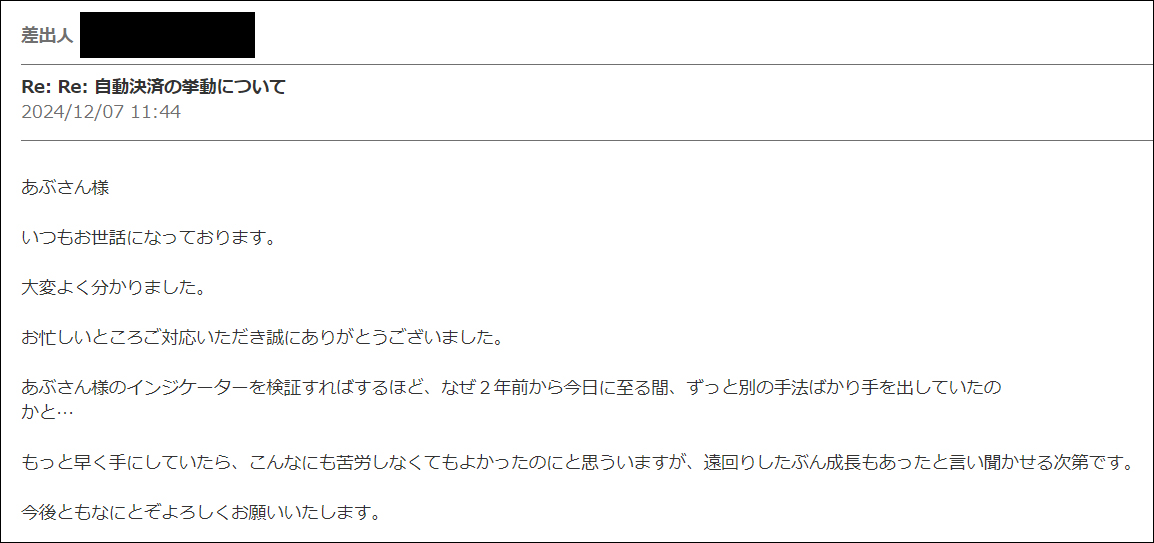
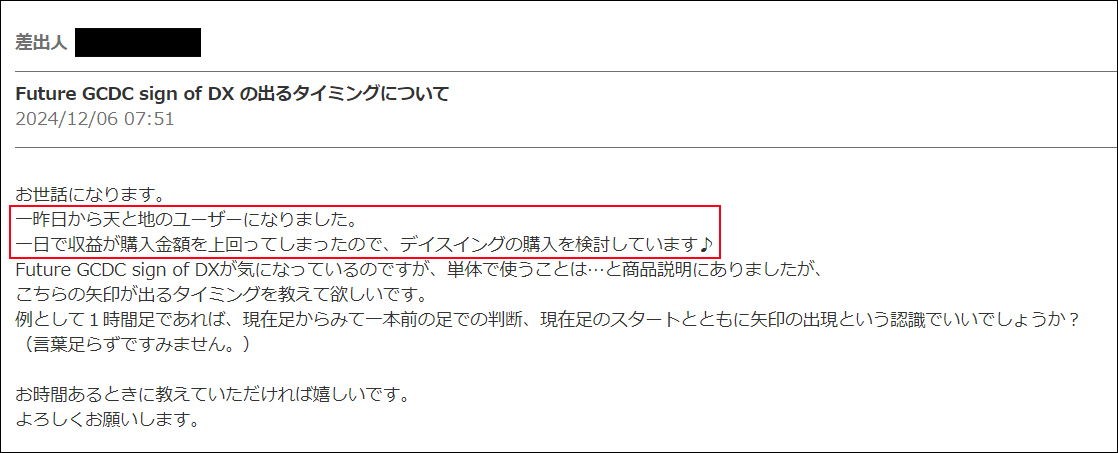
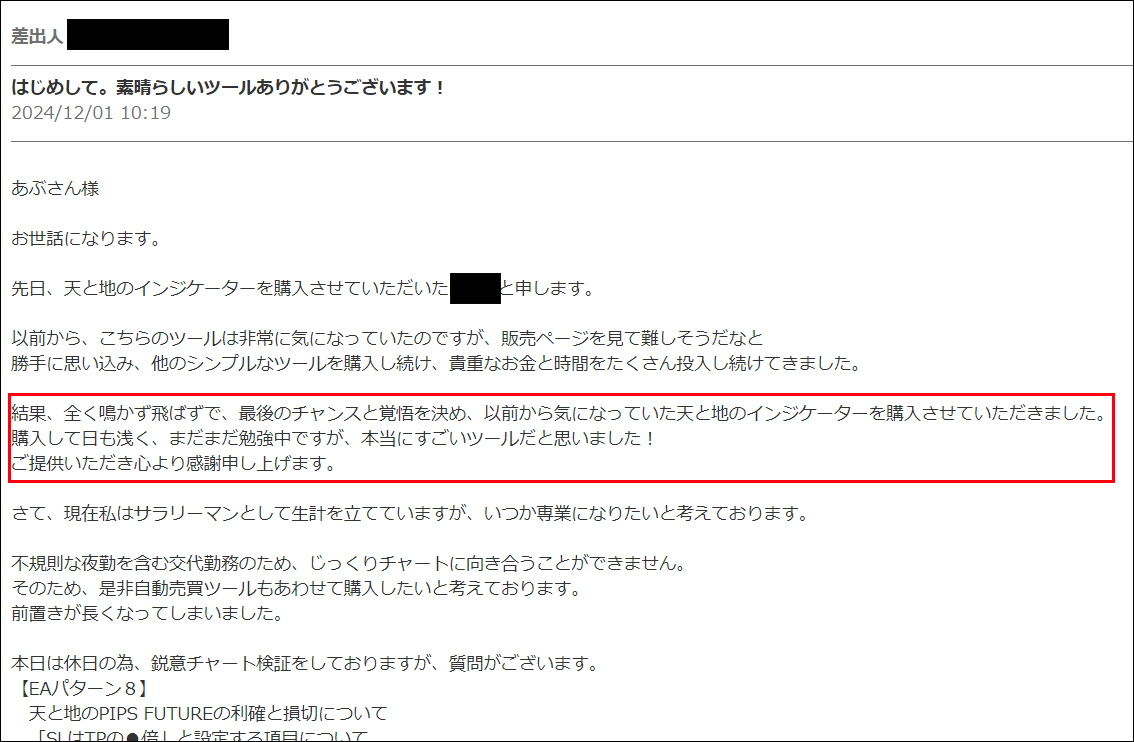
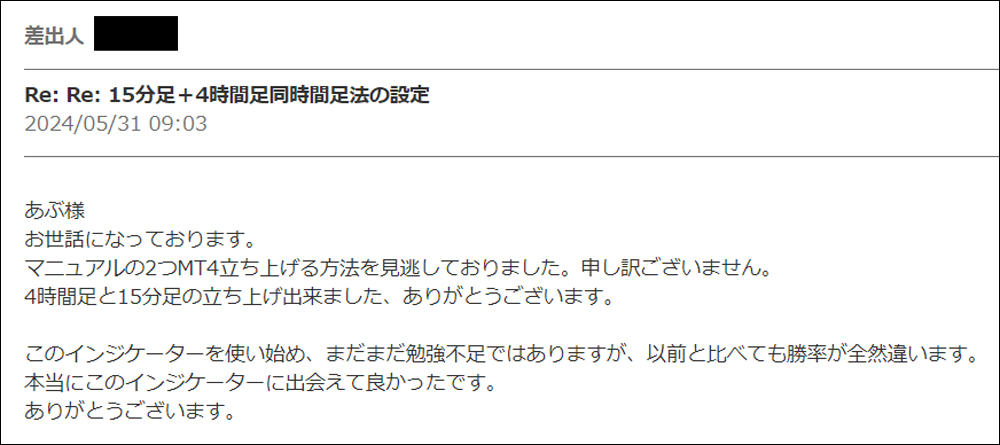
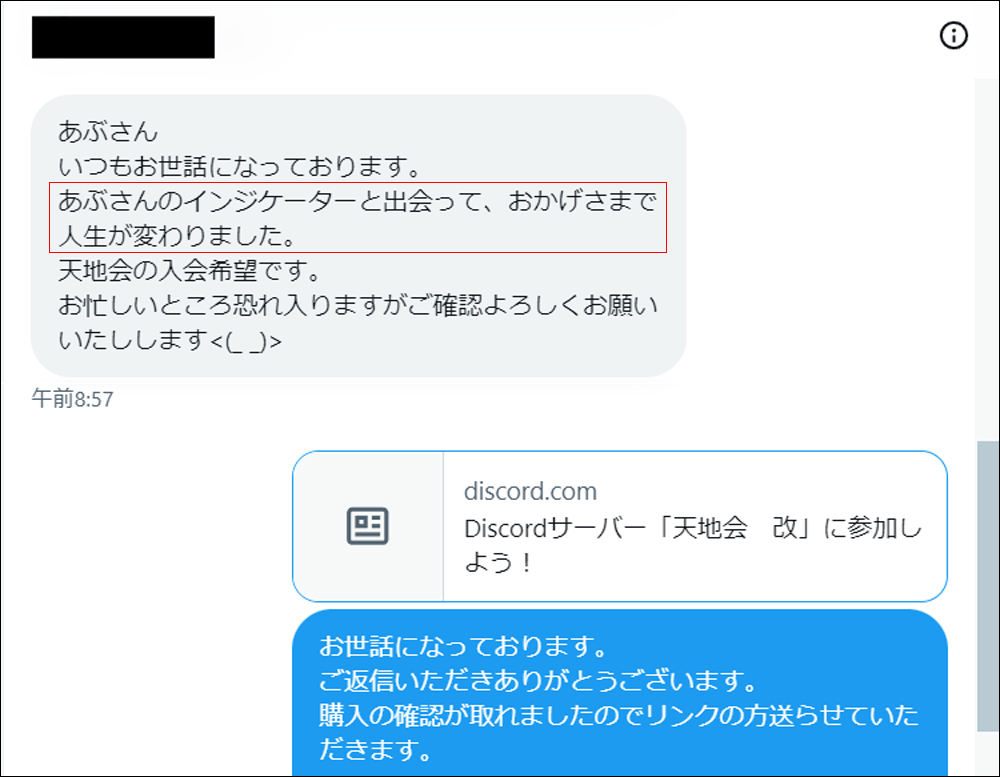
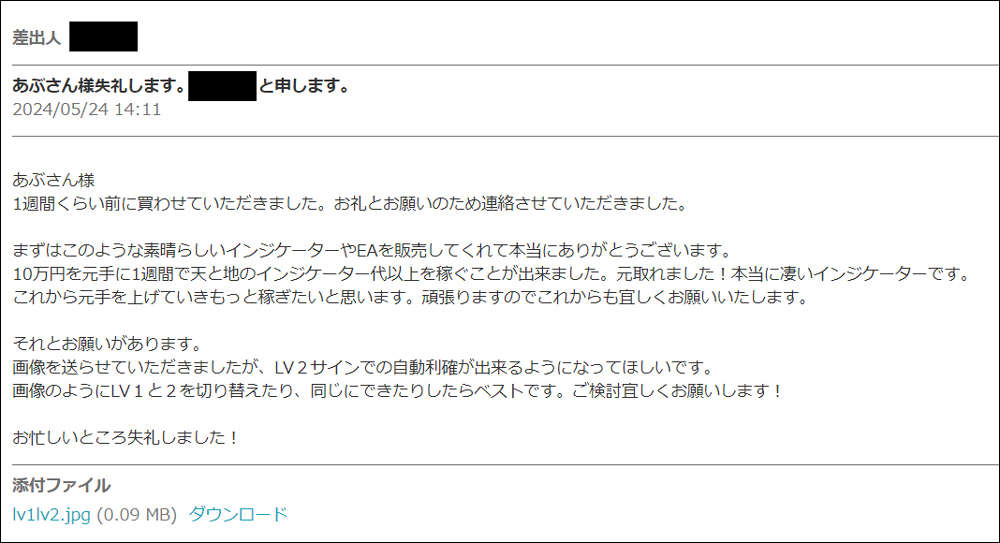
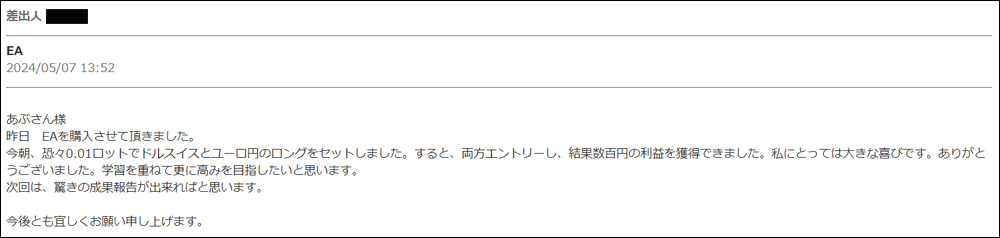
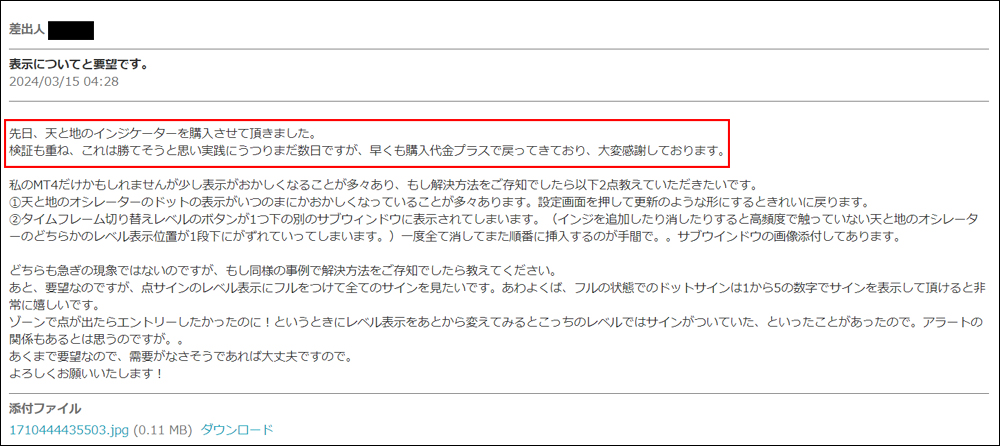
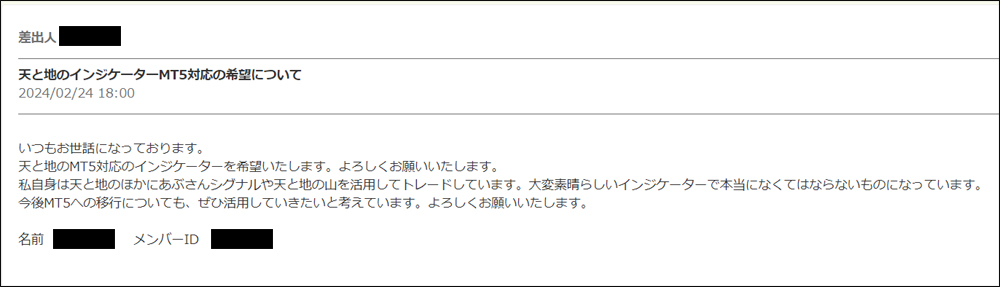
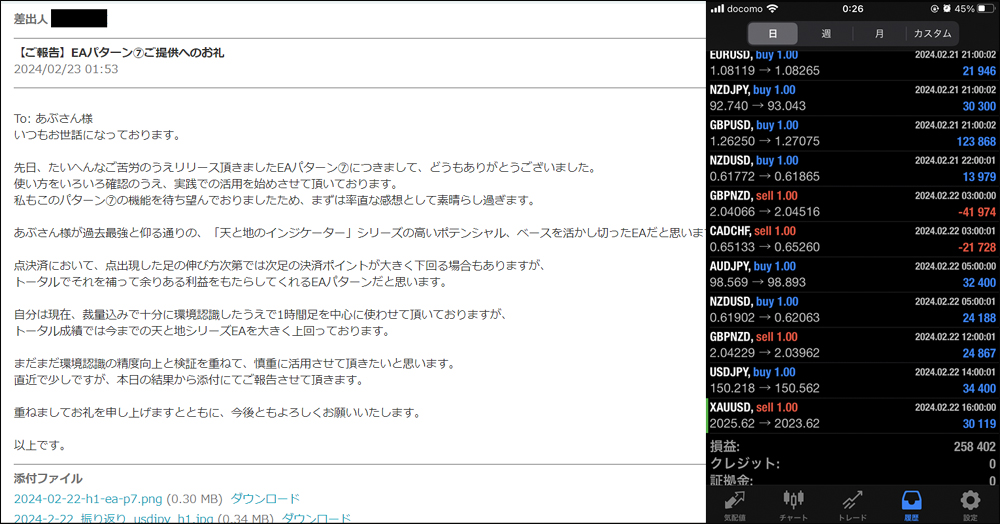
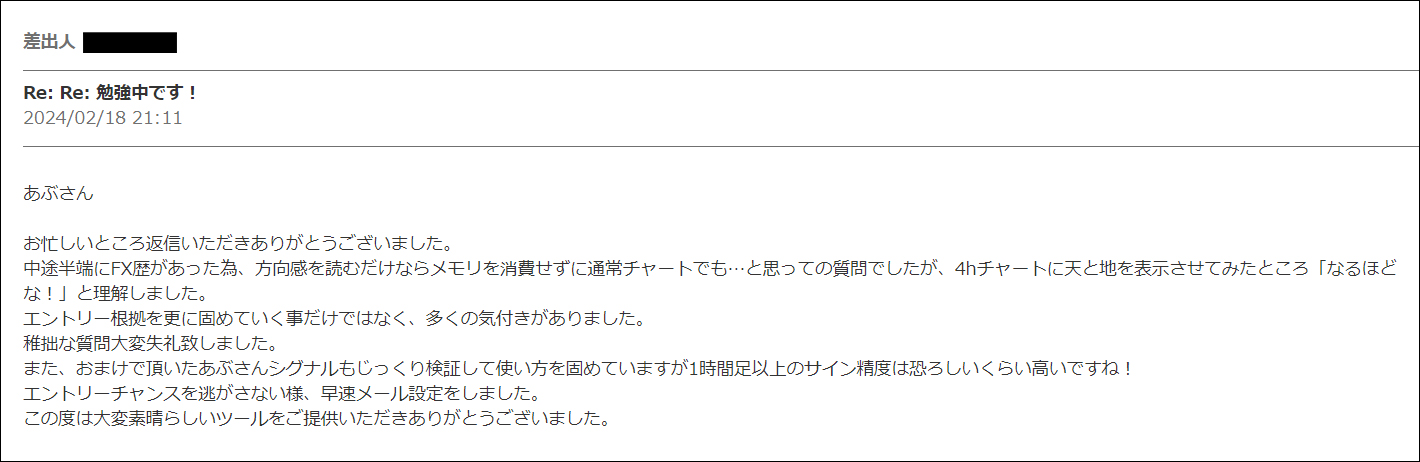
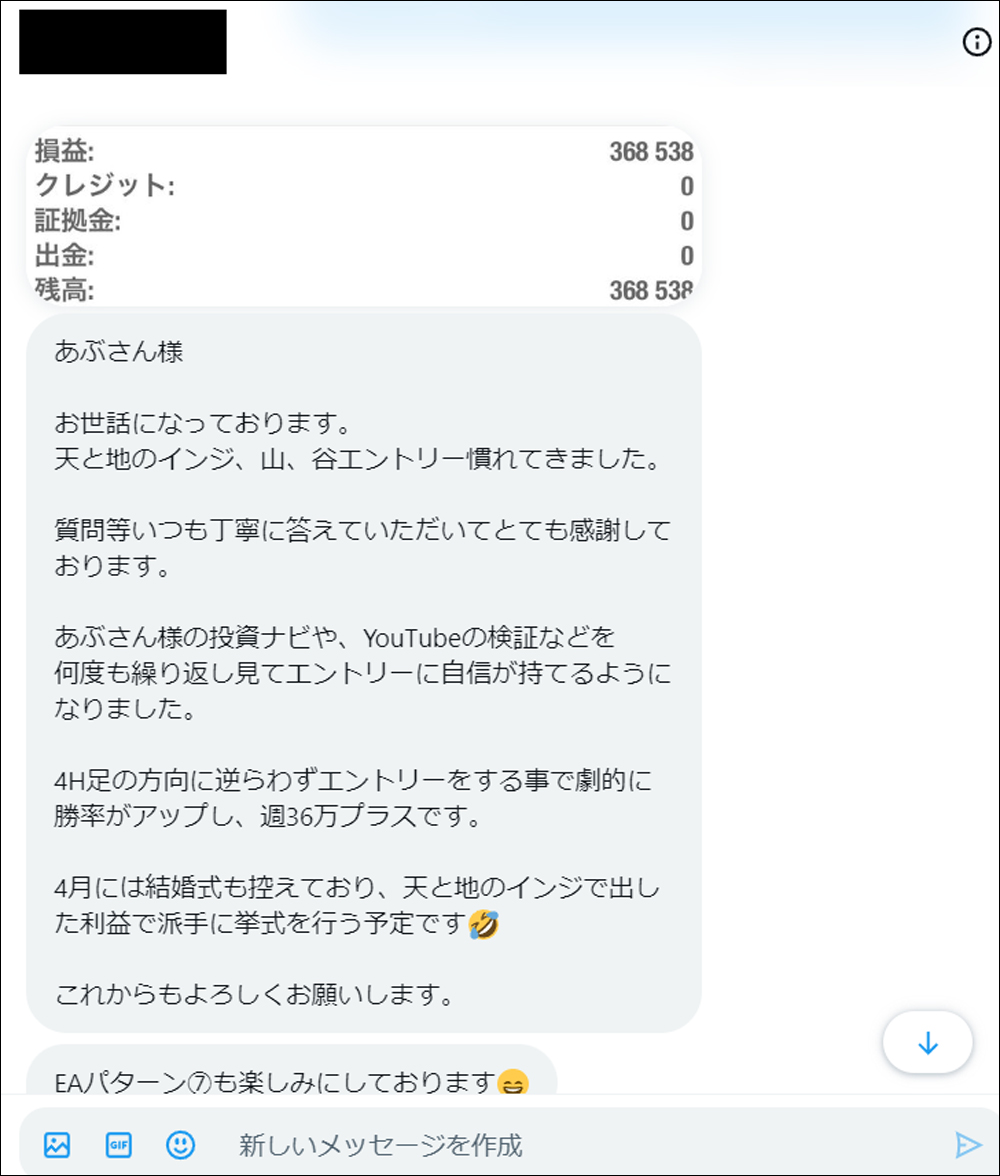
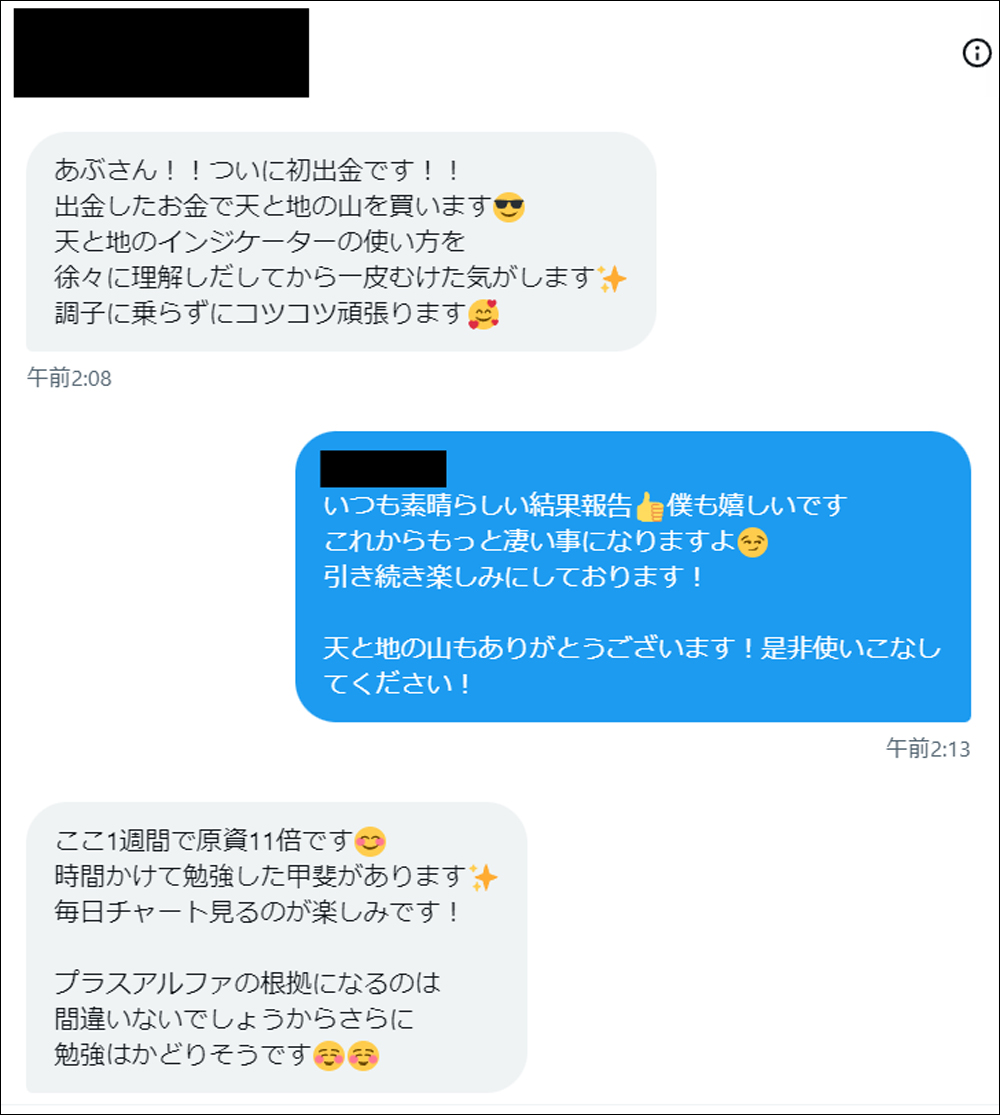
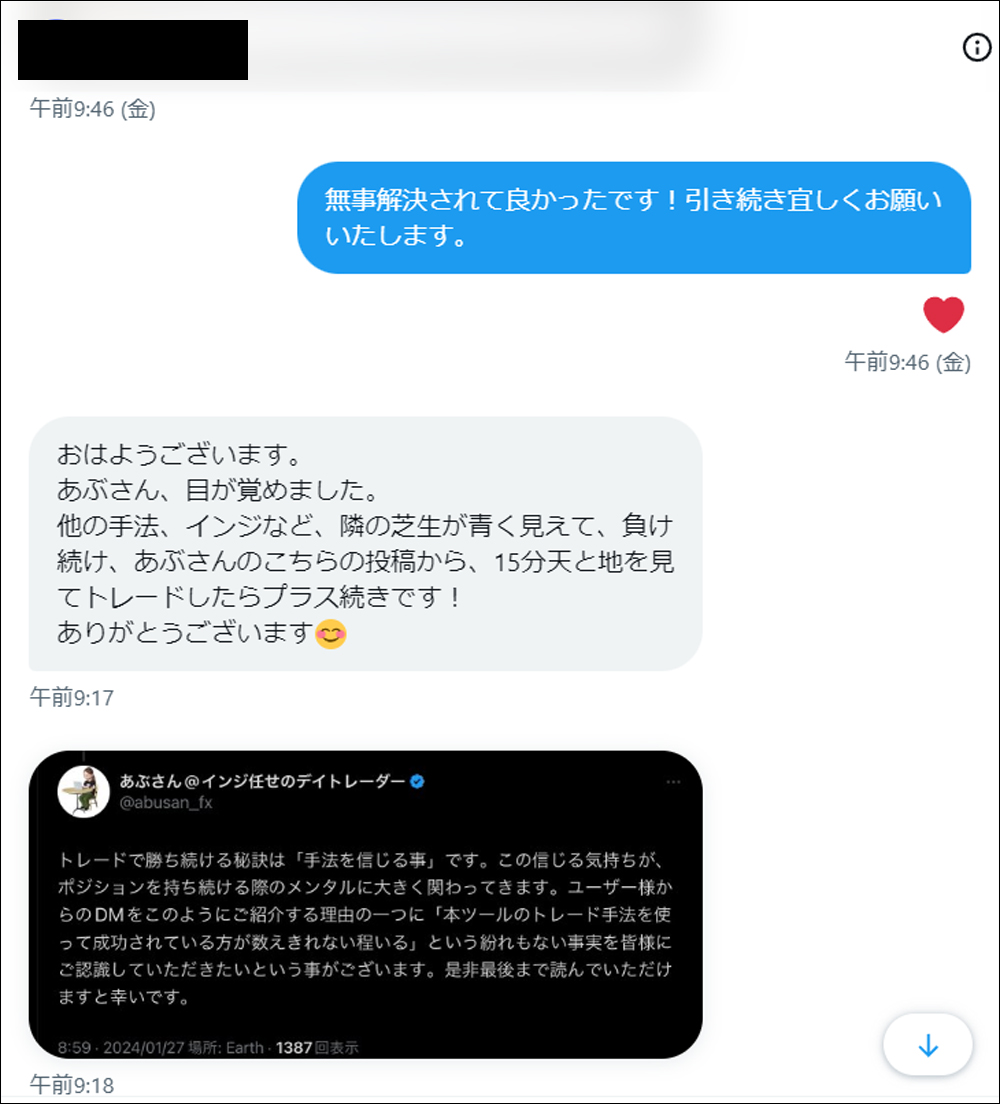
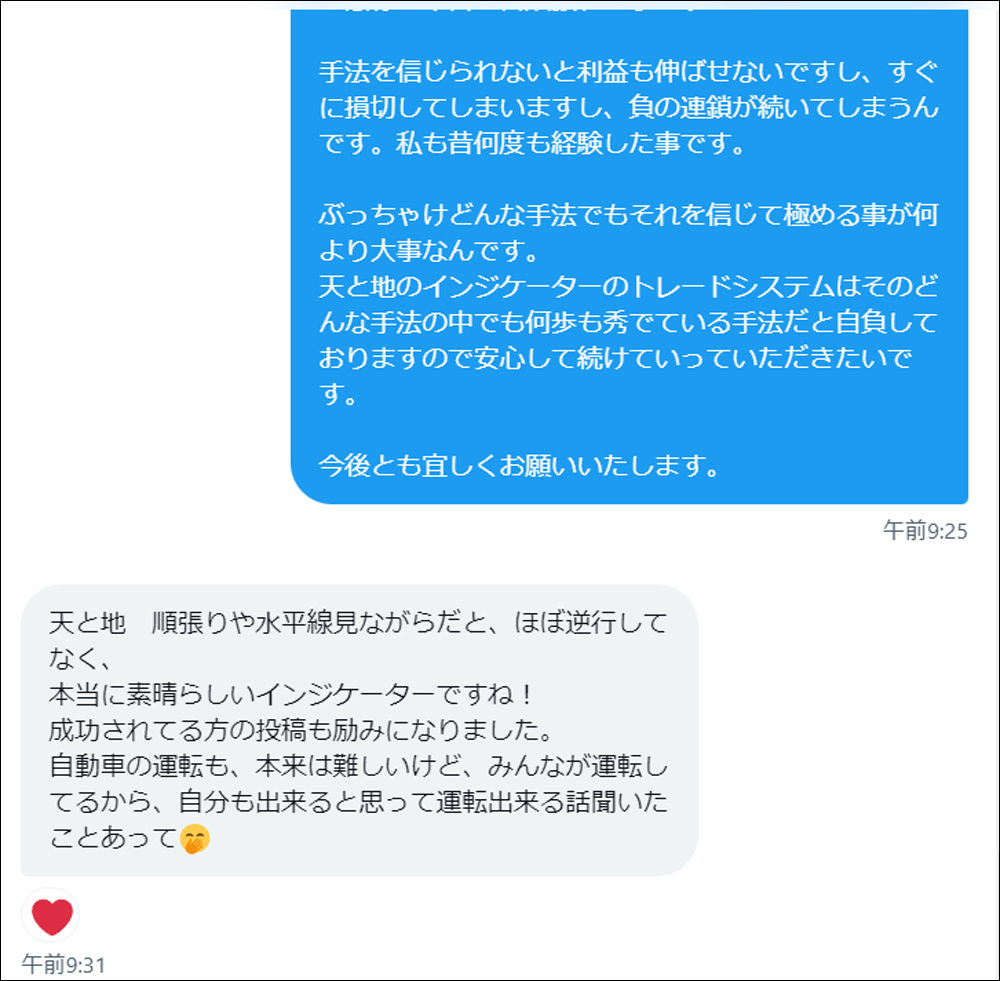
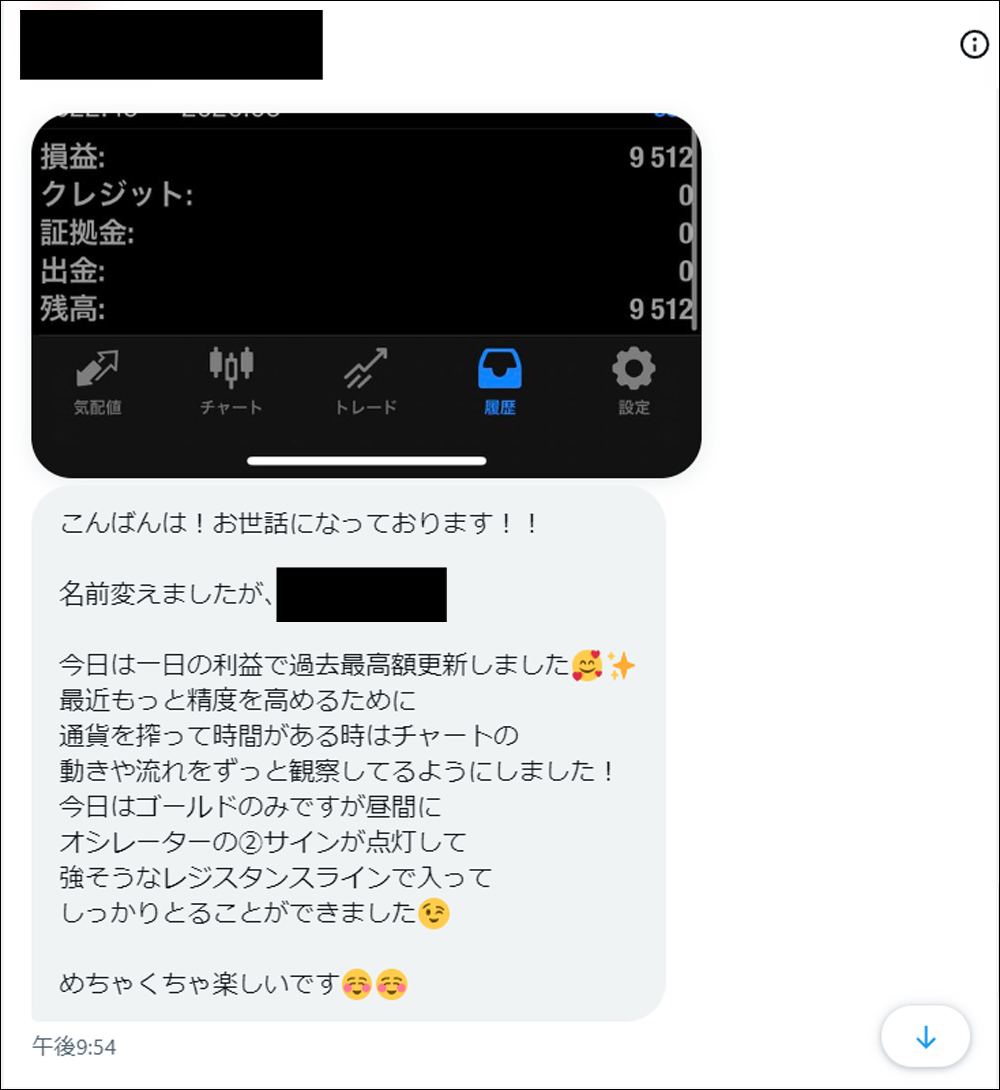
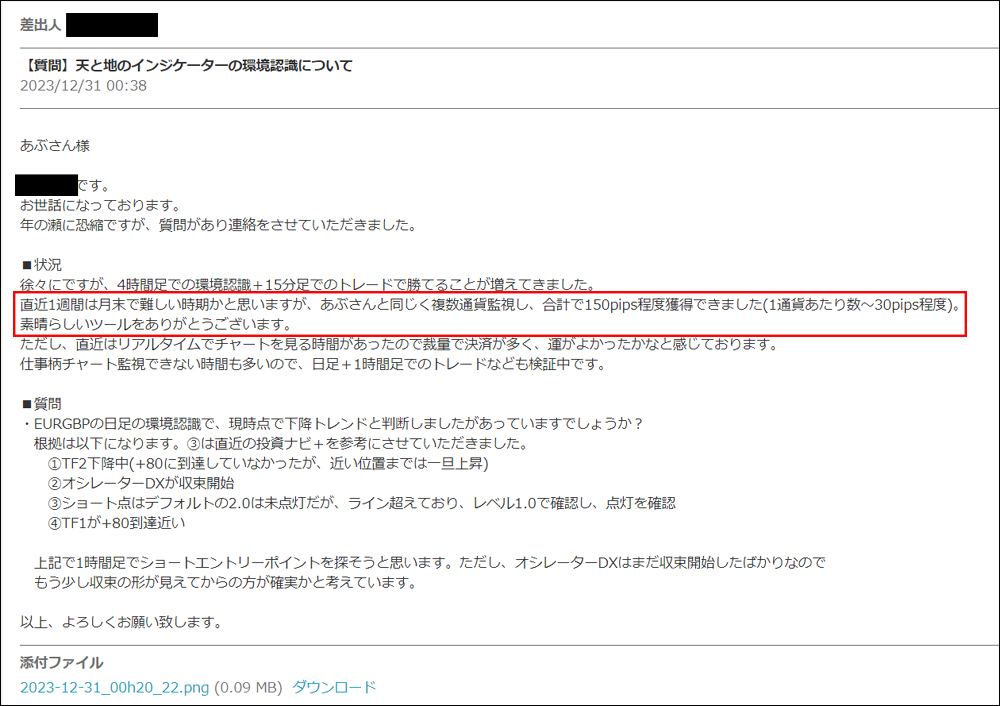
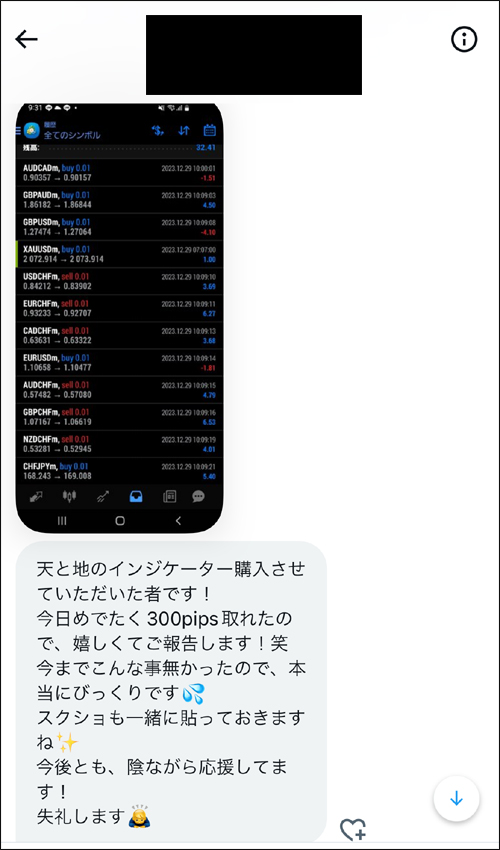
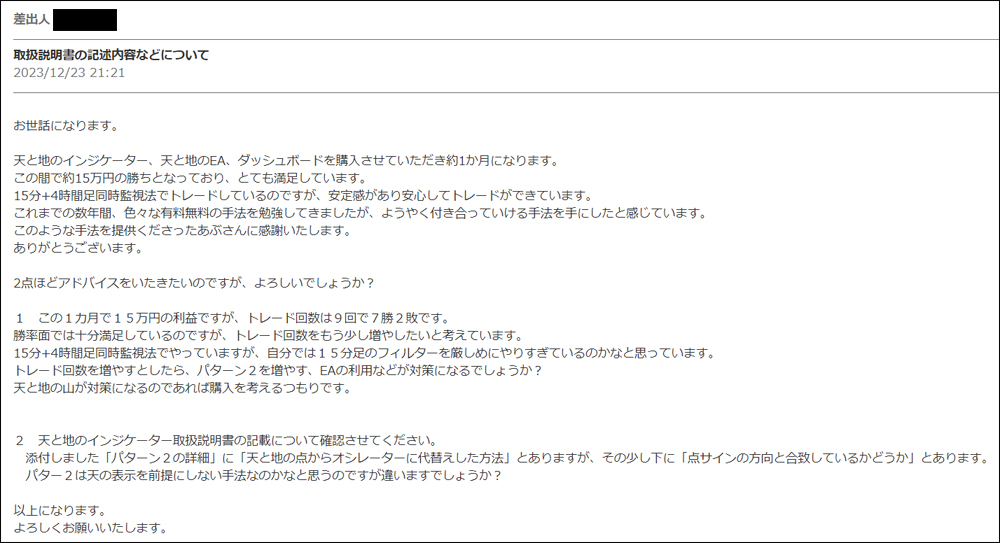
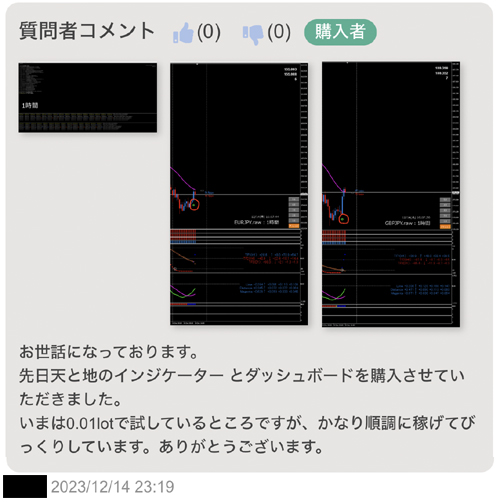
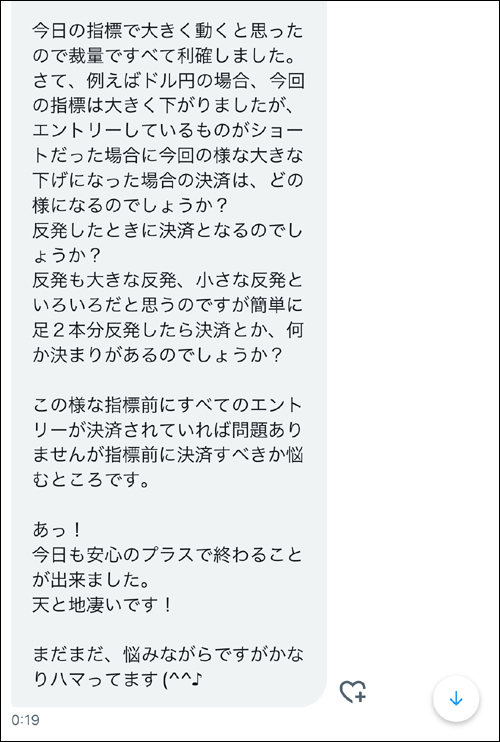
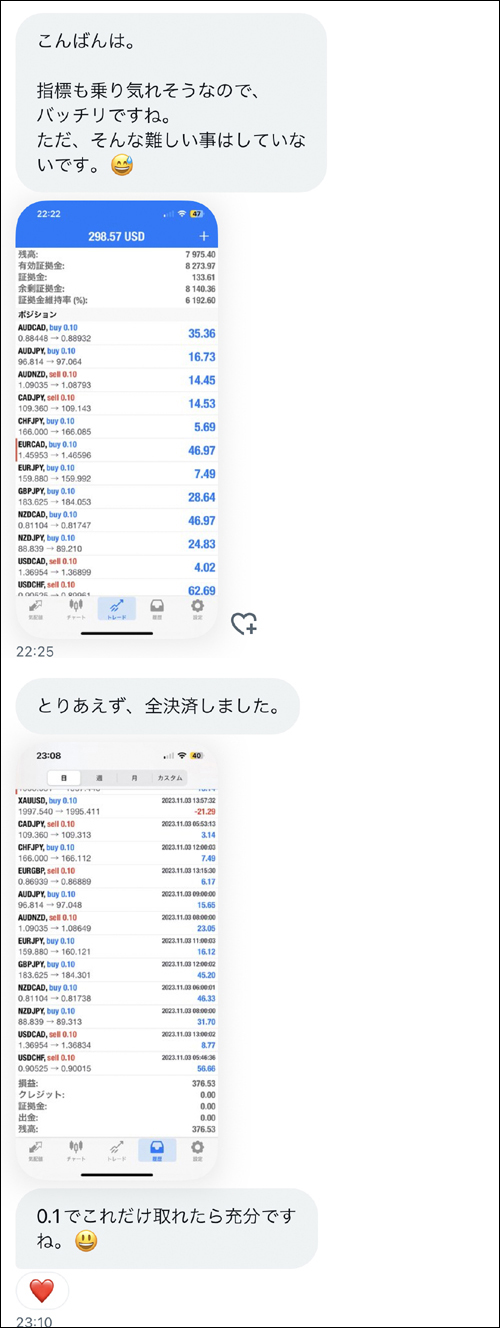
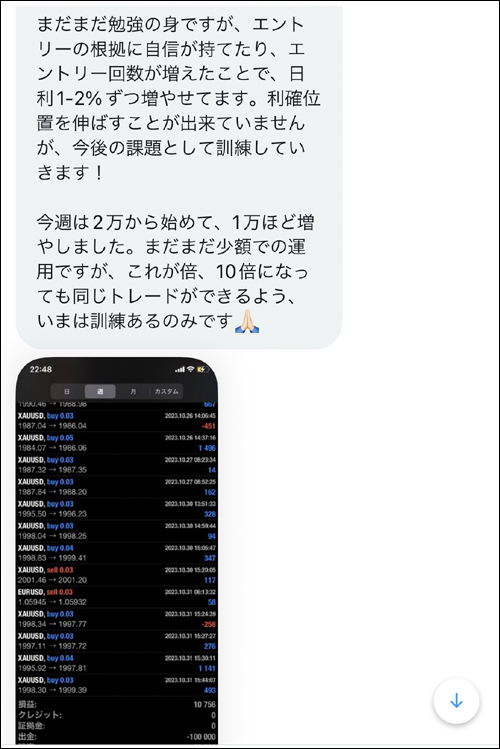
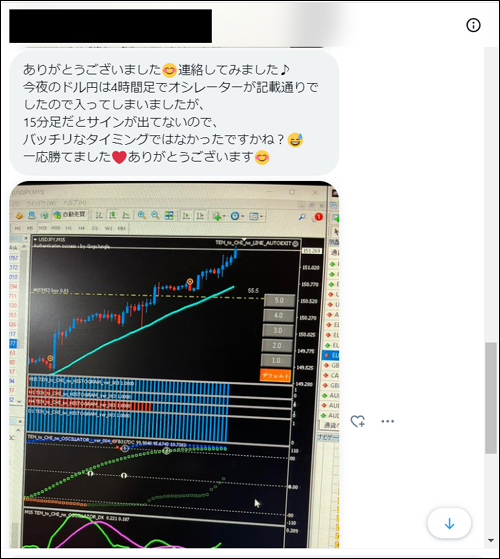
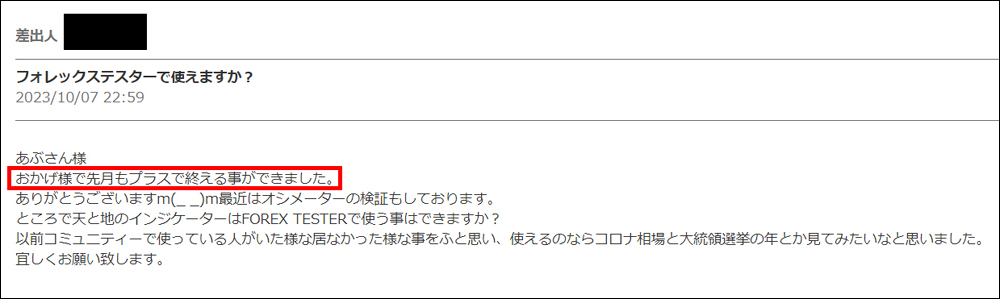
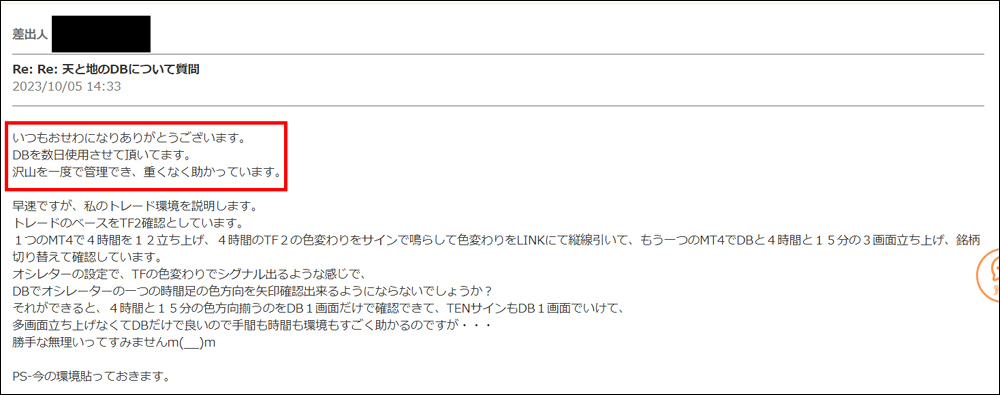
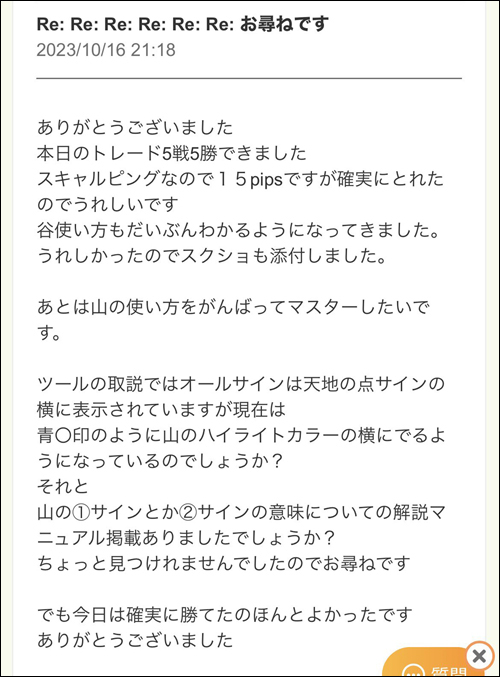
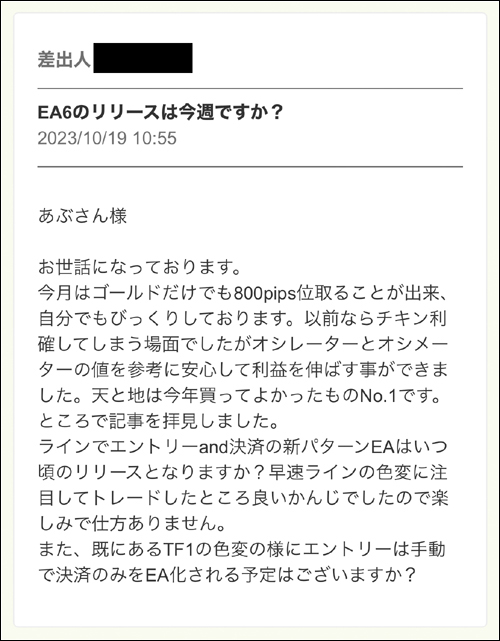
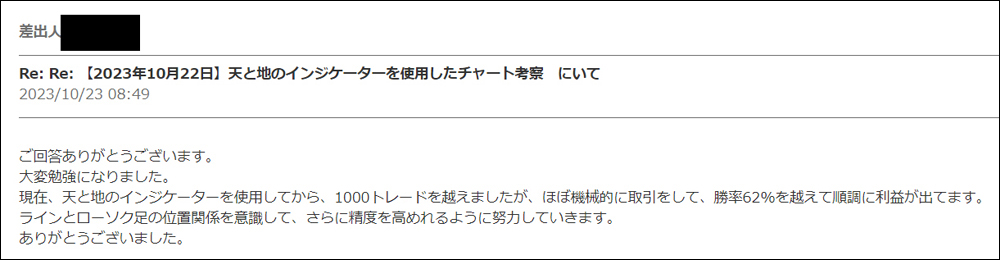
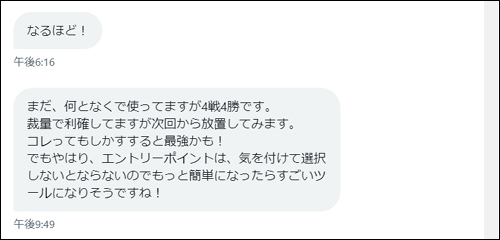
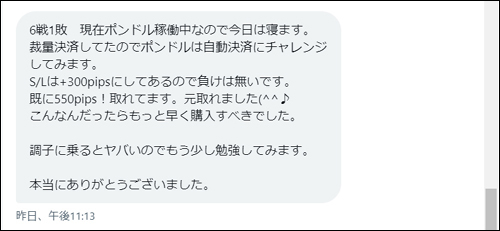
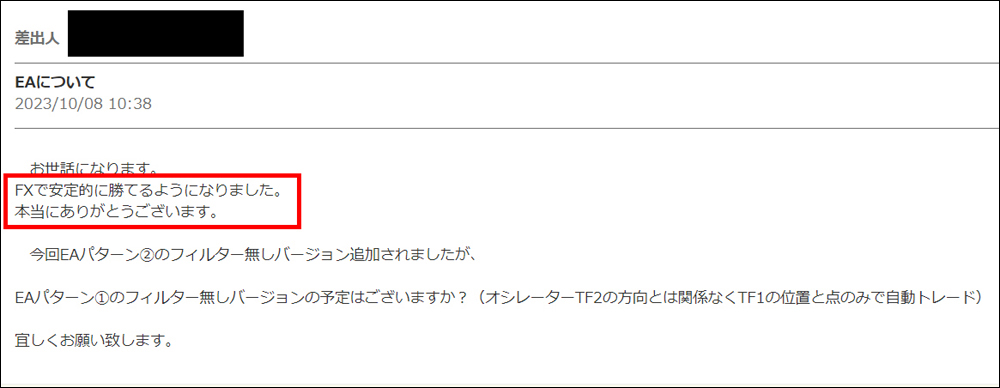
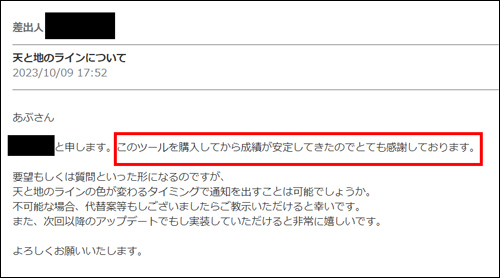
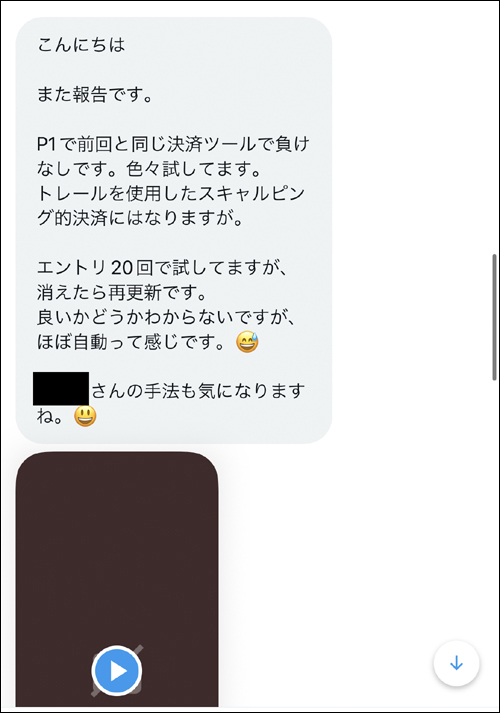
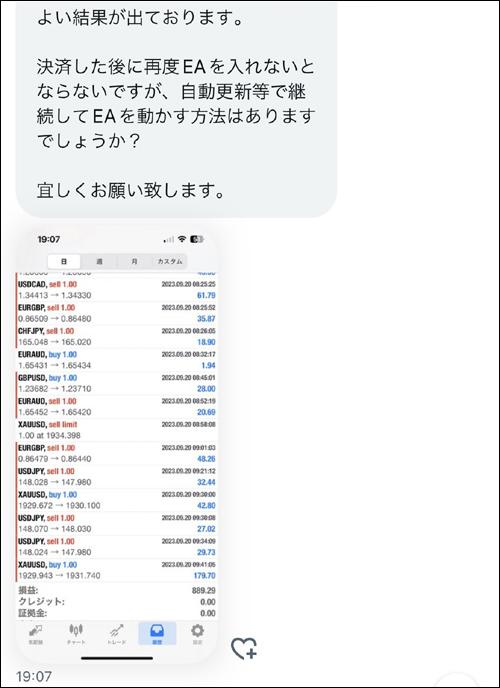
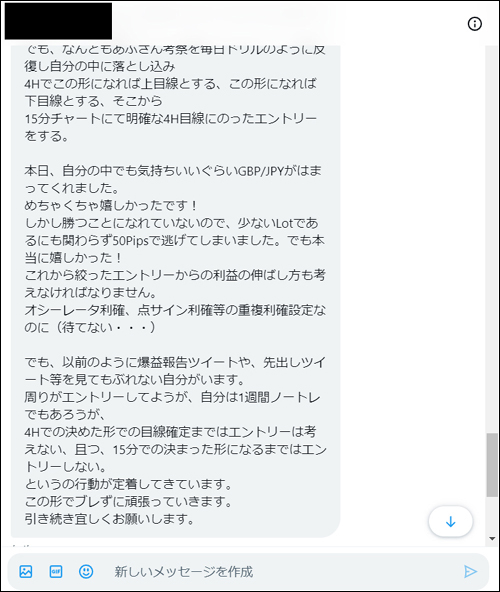
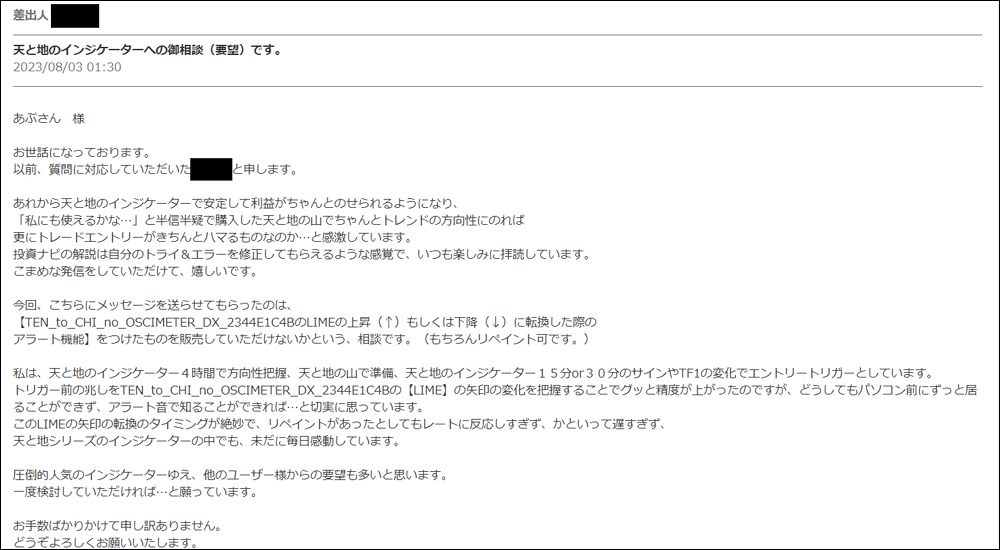
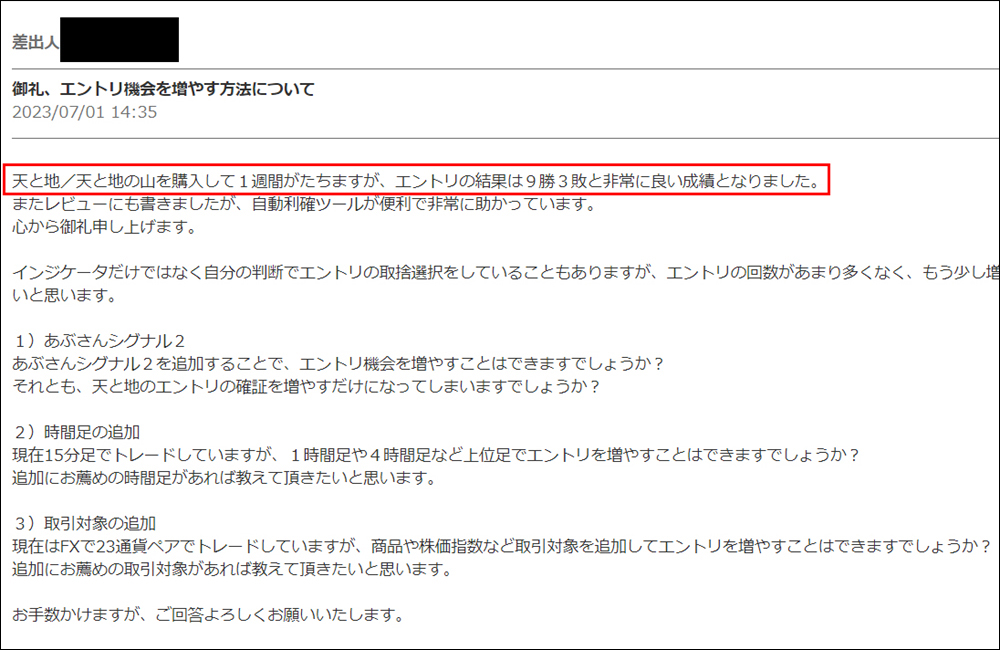
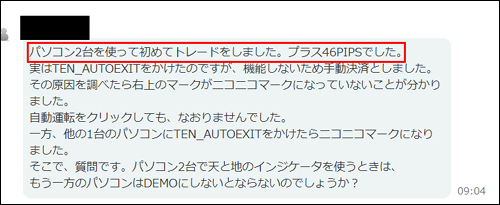
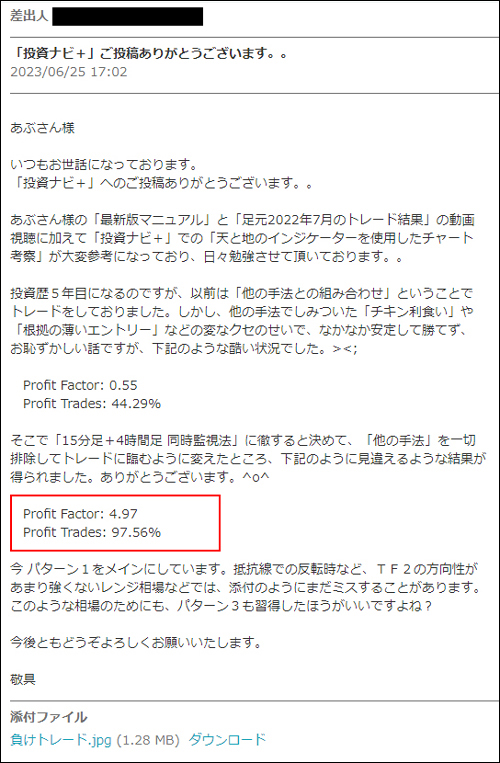
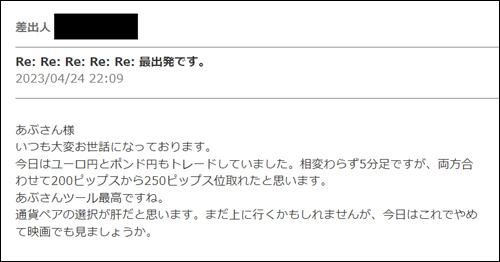
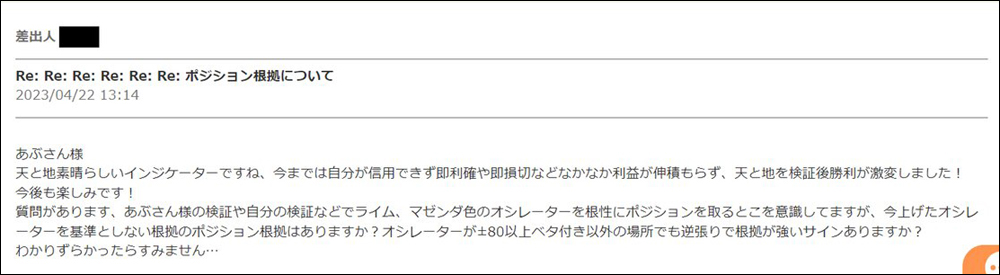
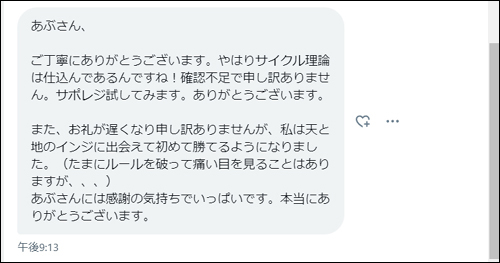
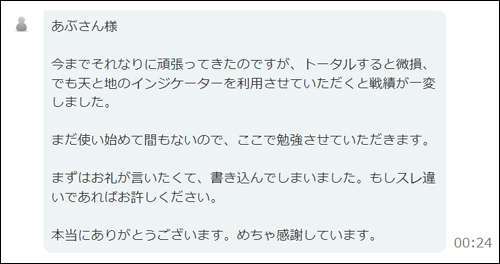
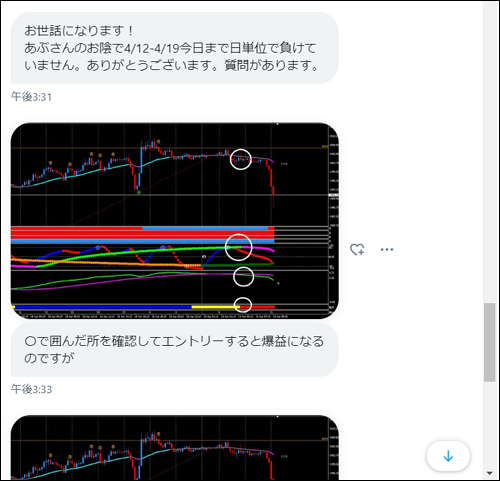
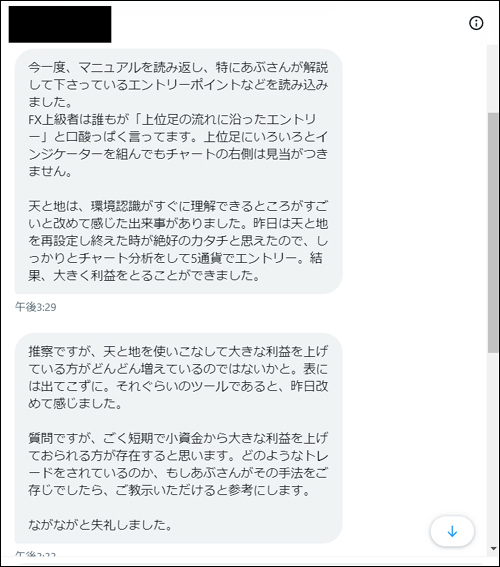
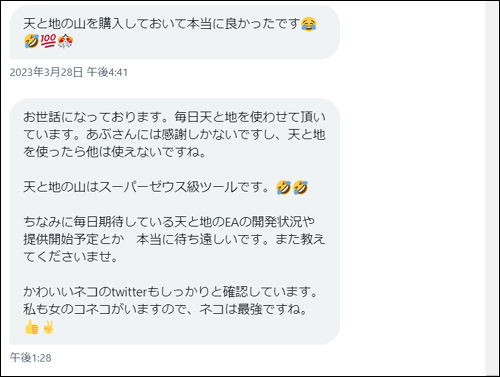
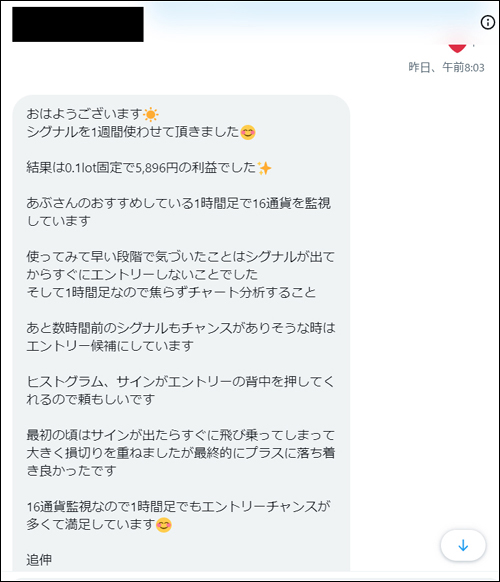
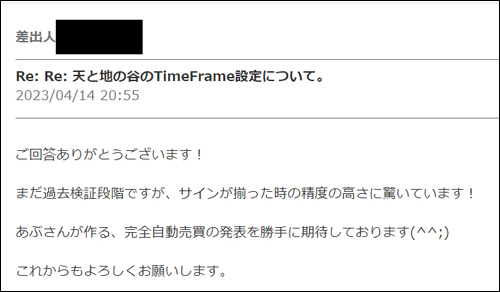
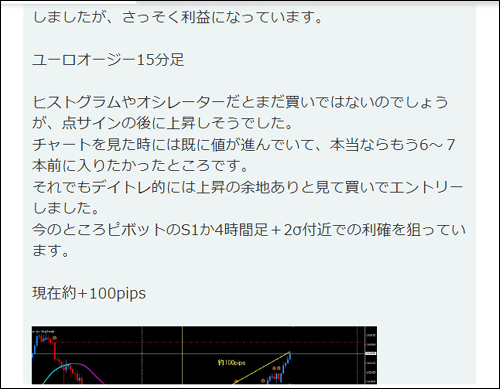
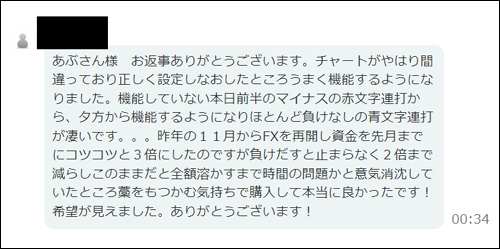
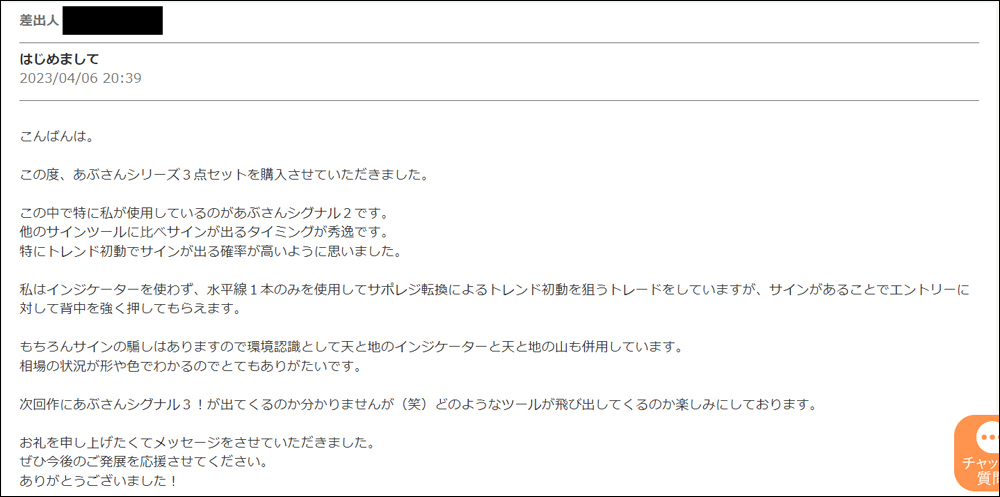
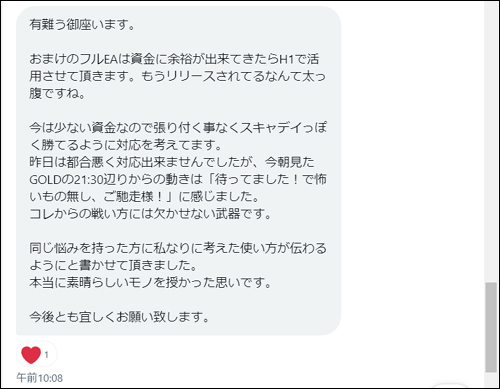
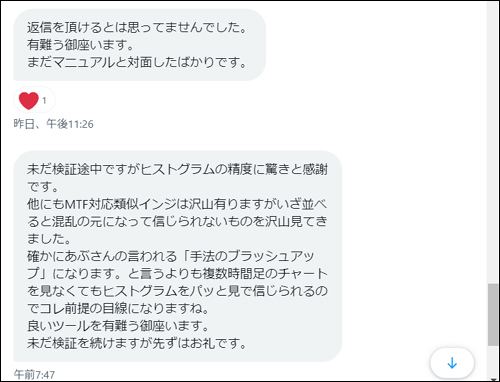
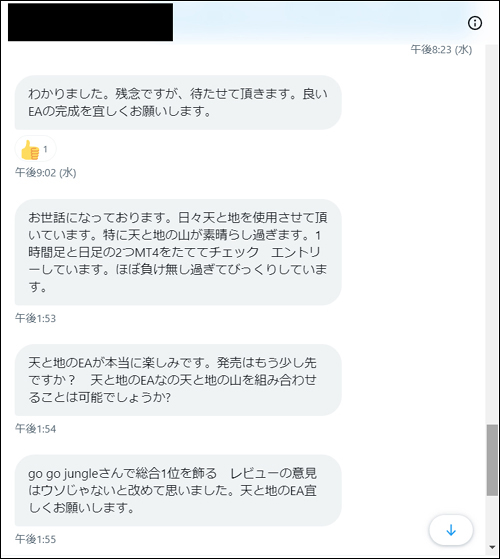
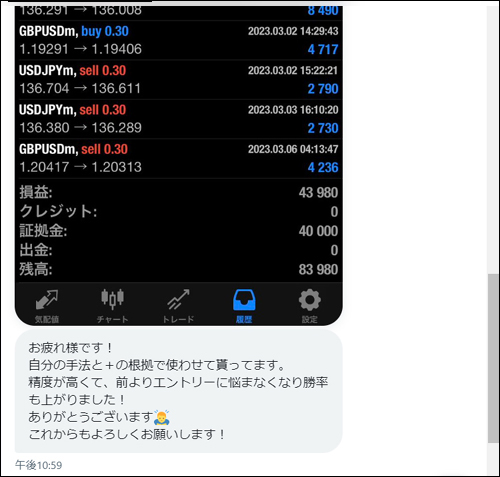
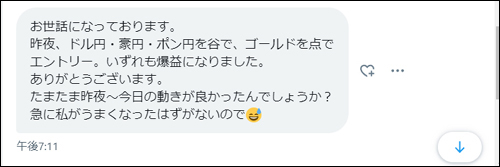
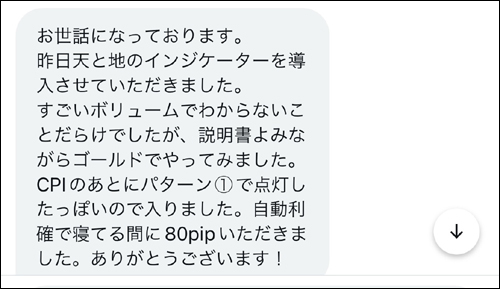
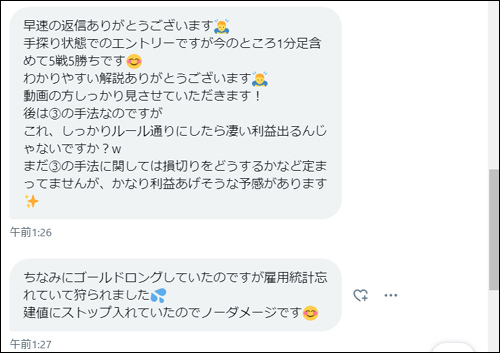
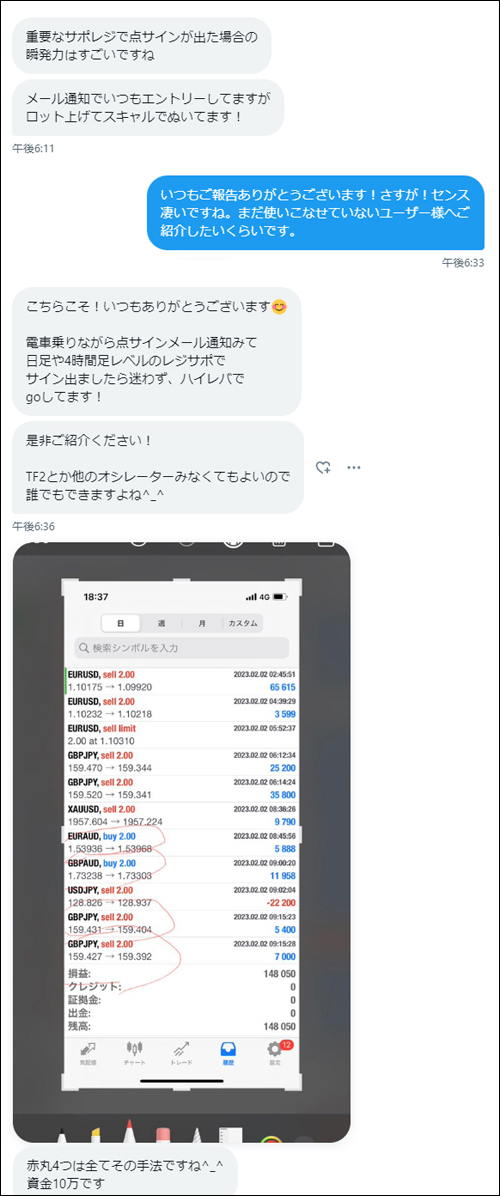
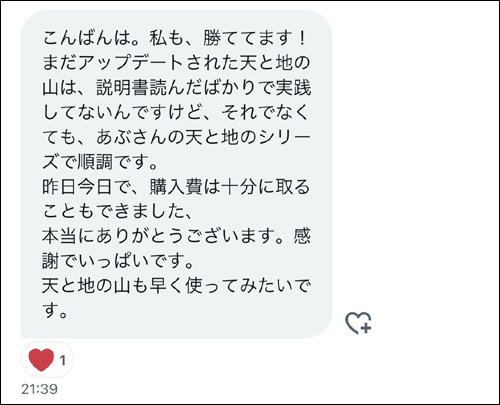
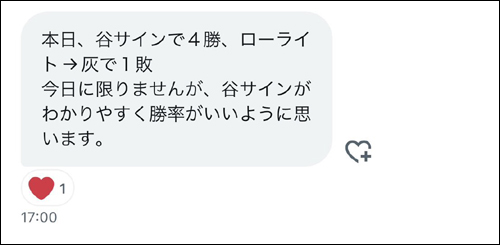
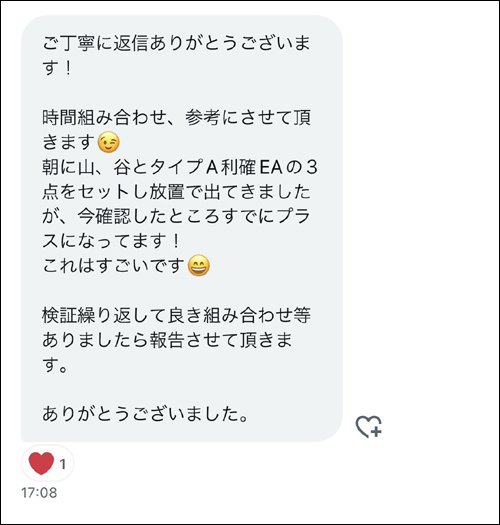
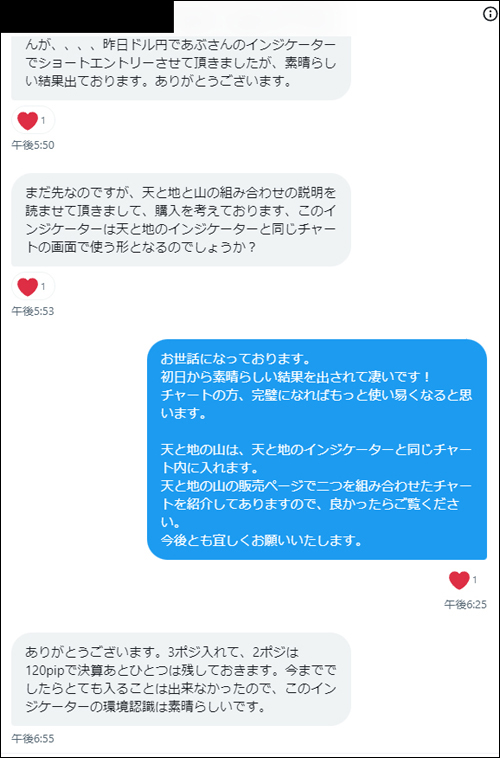
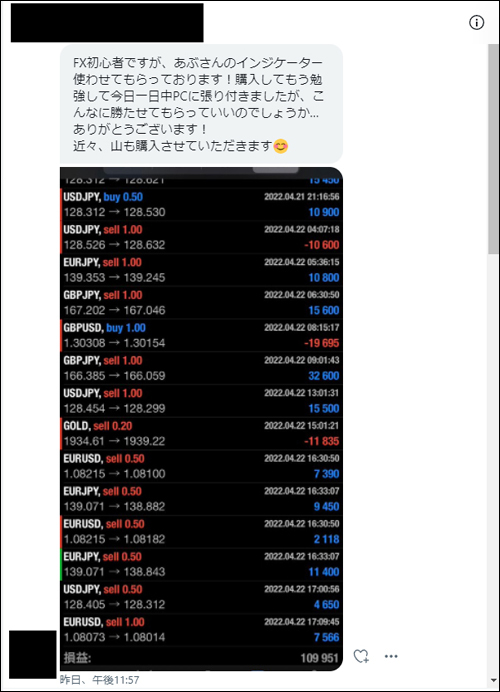
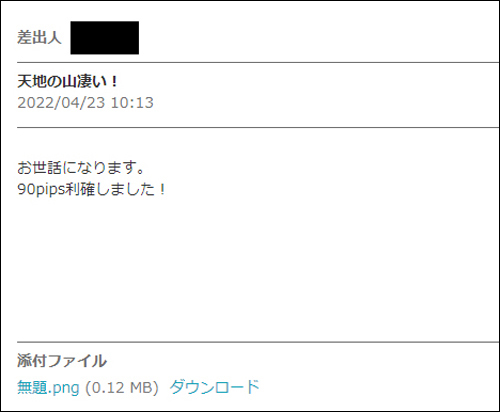
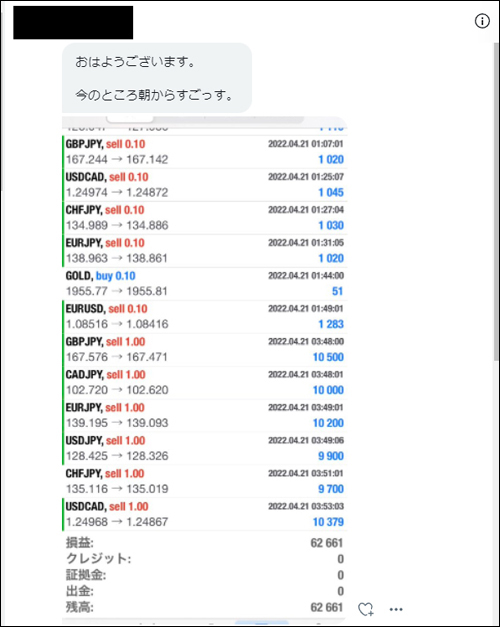
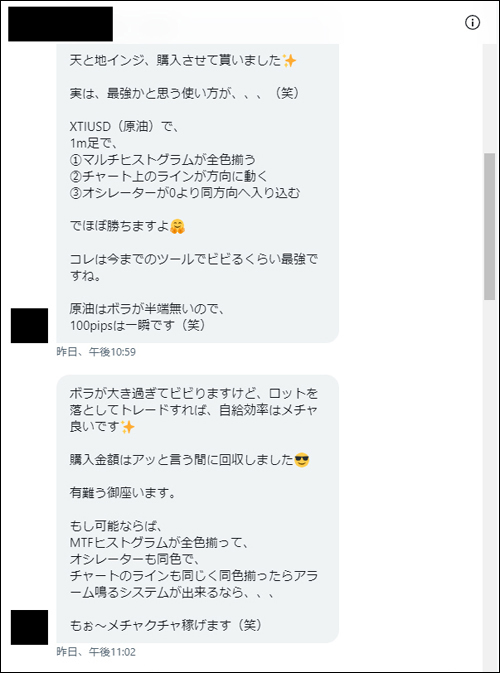
・Feelings (reviews) from users who actually used the Heaven and Earth Indicator
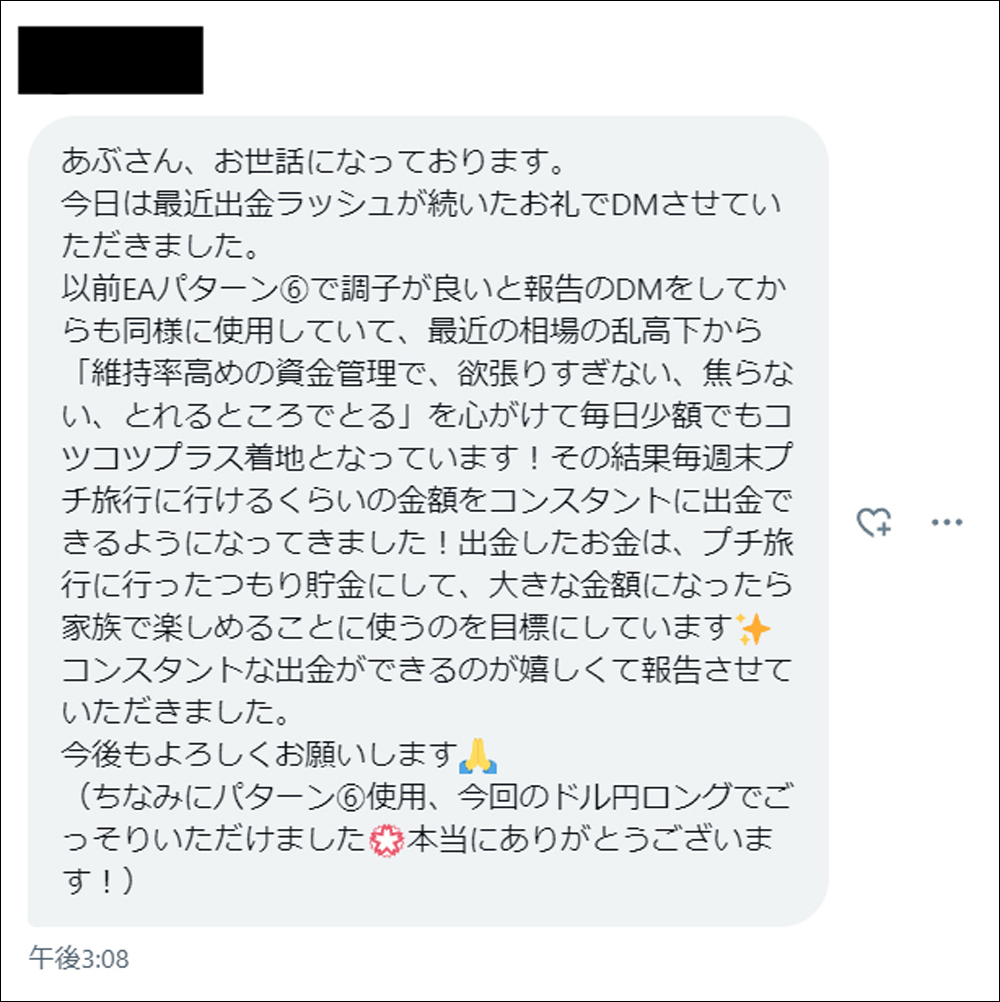
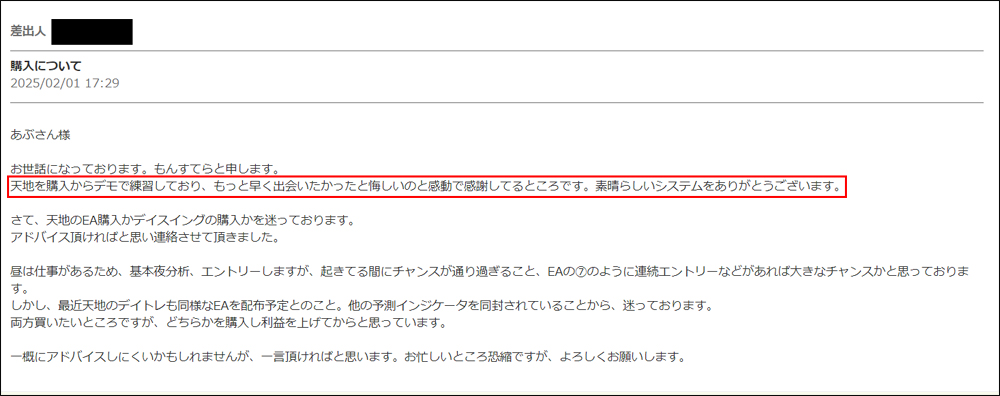
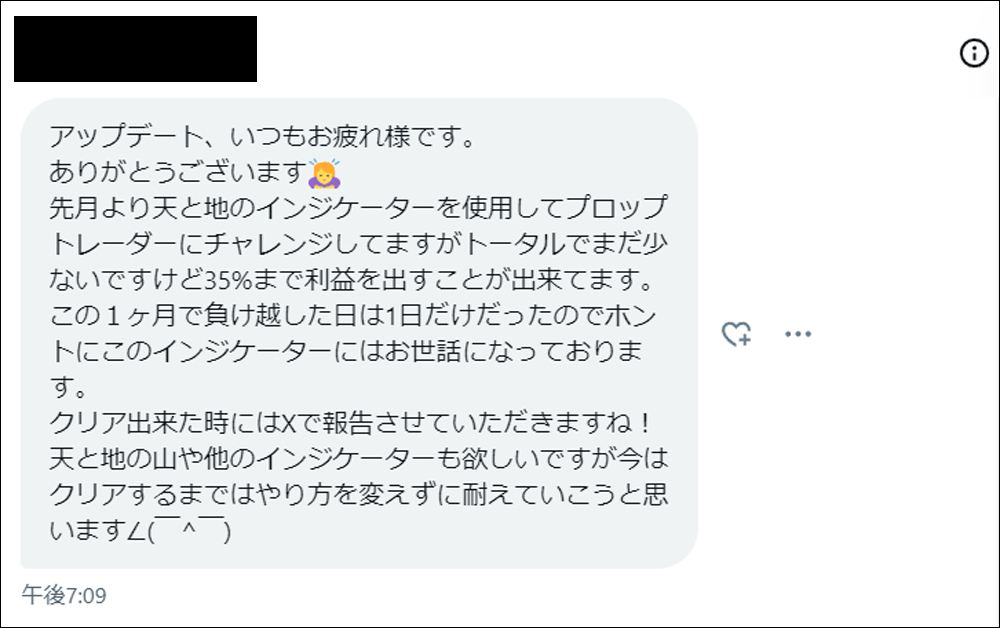
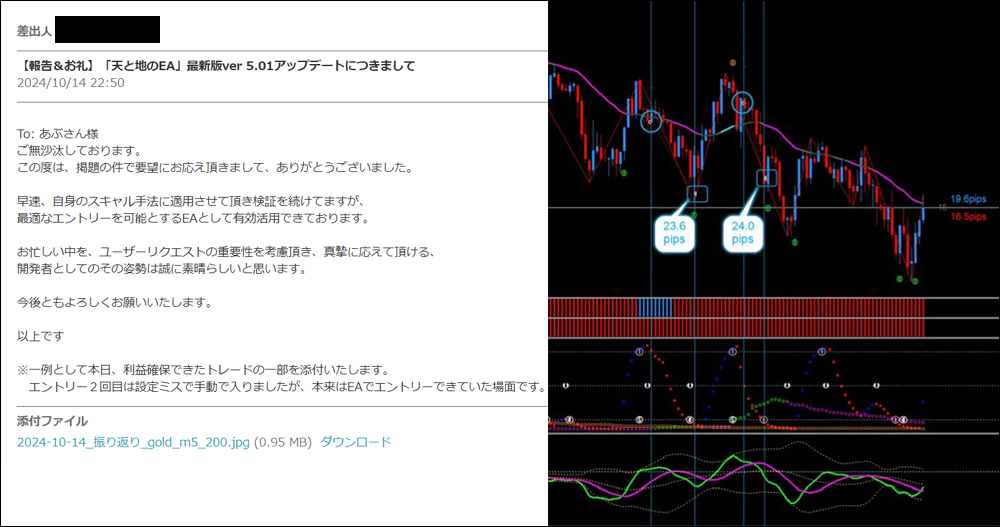
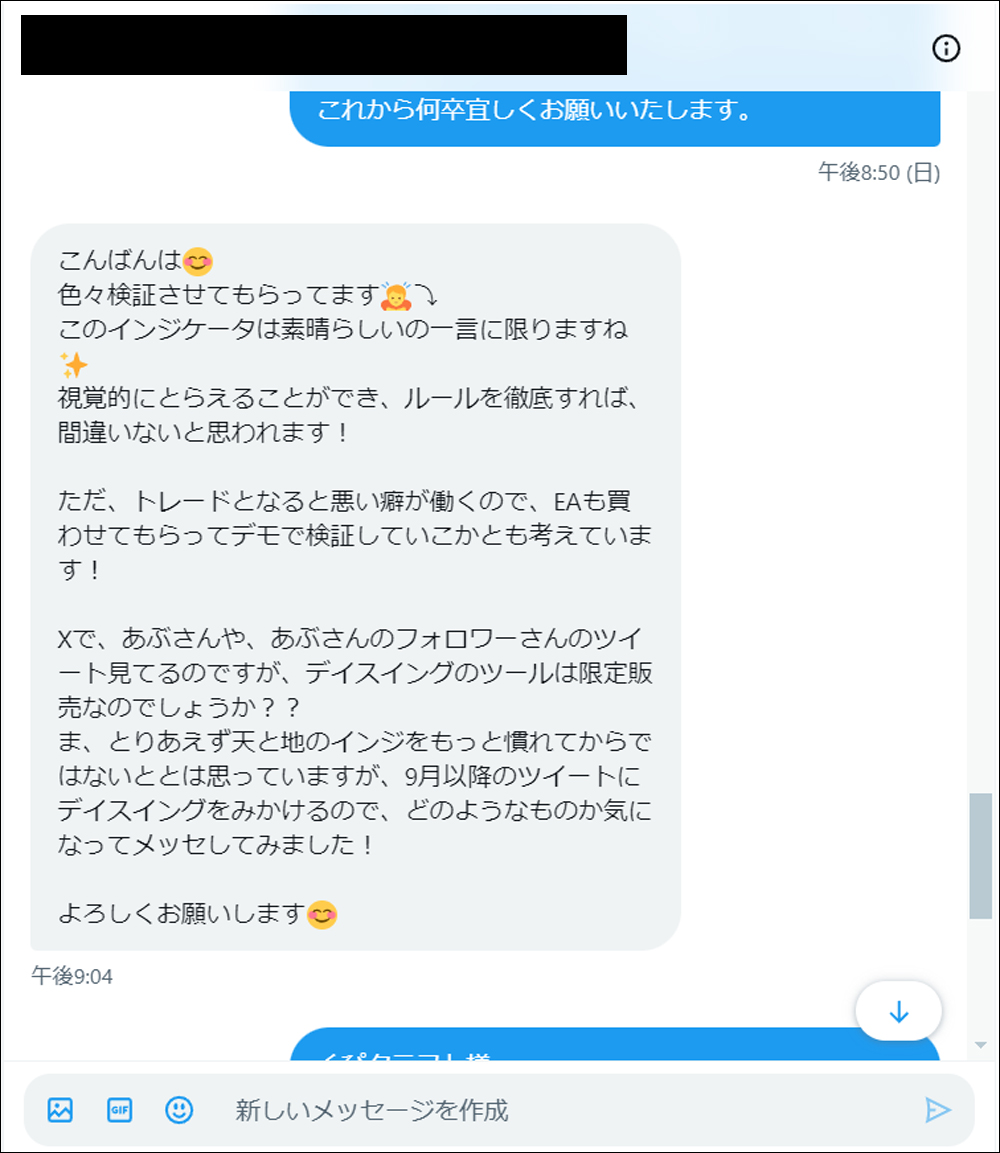
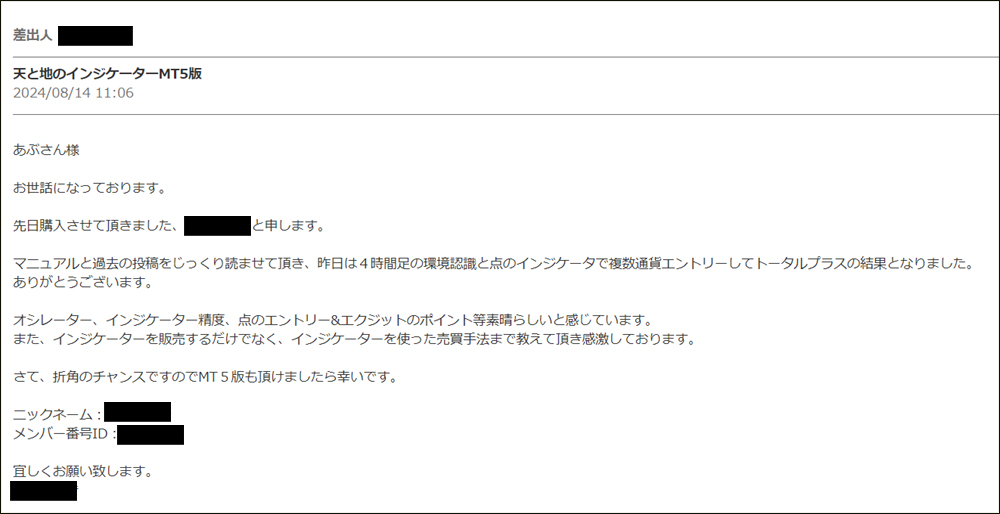
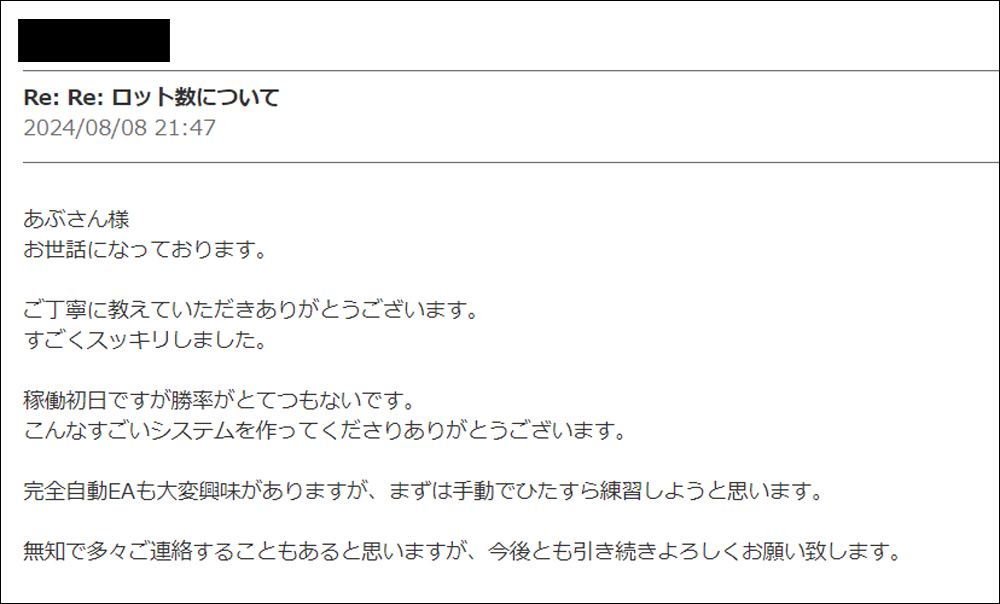
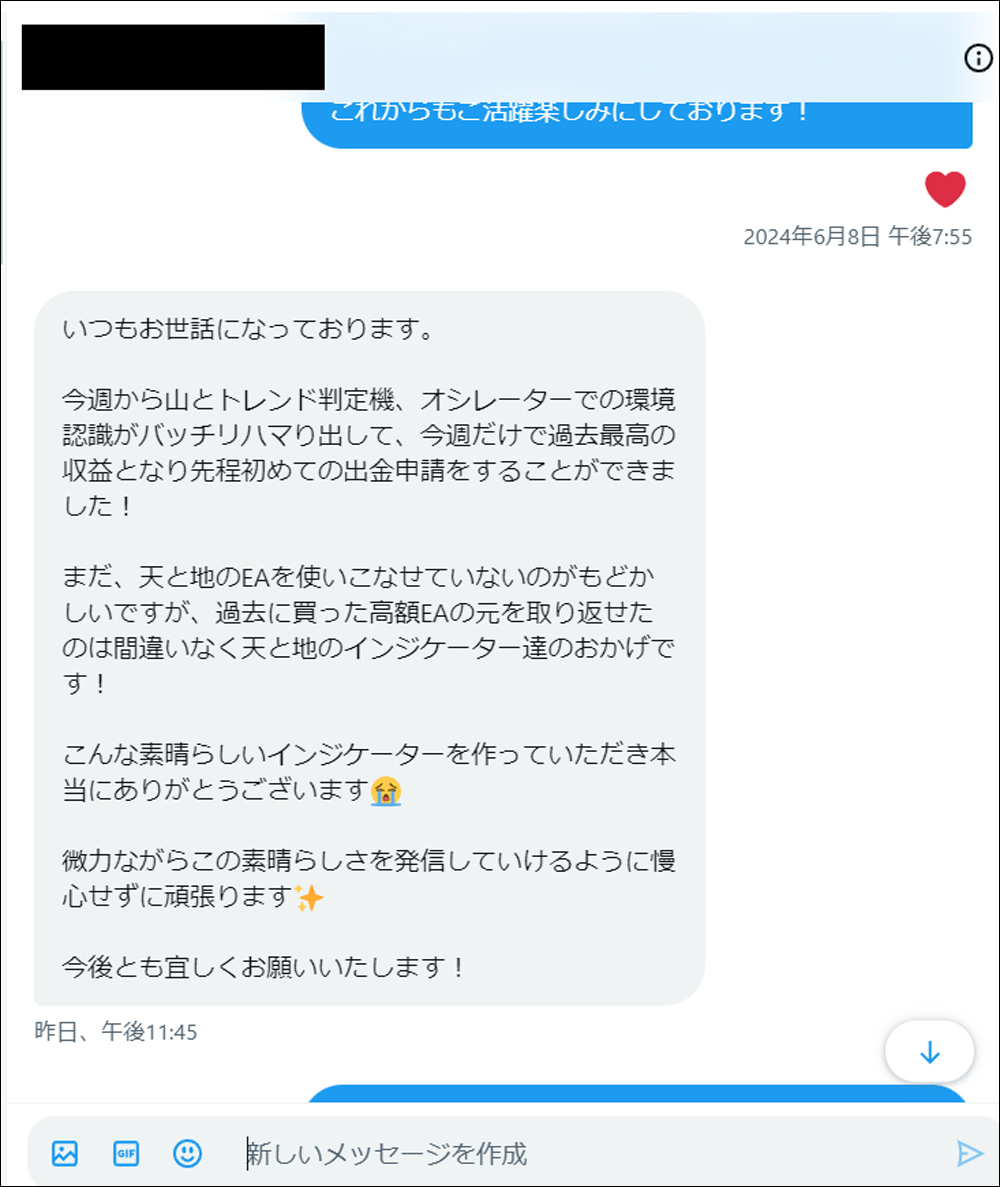
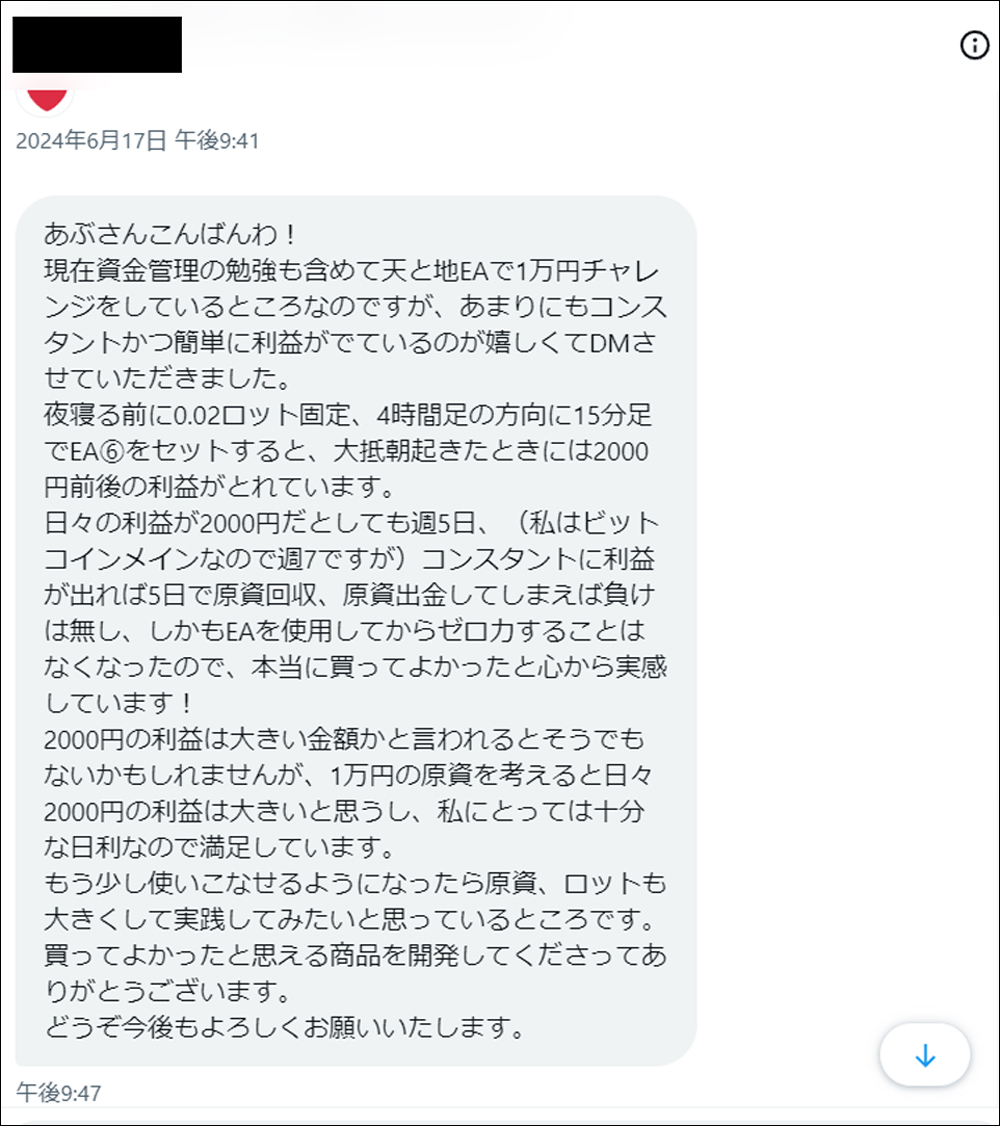
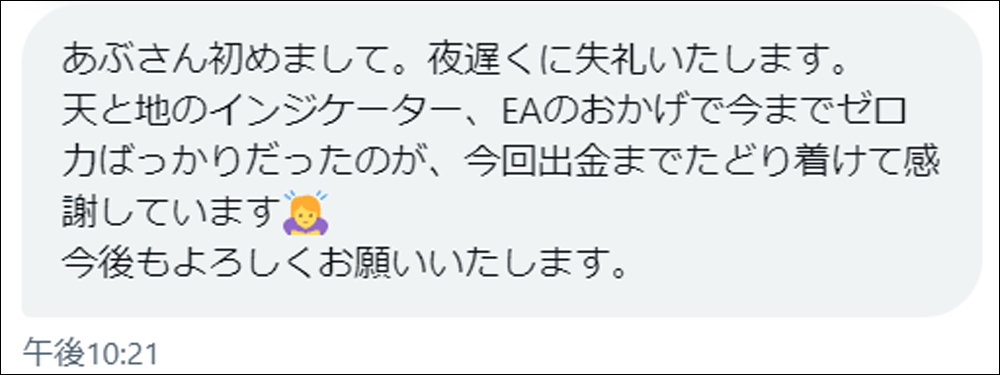
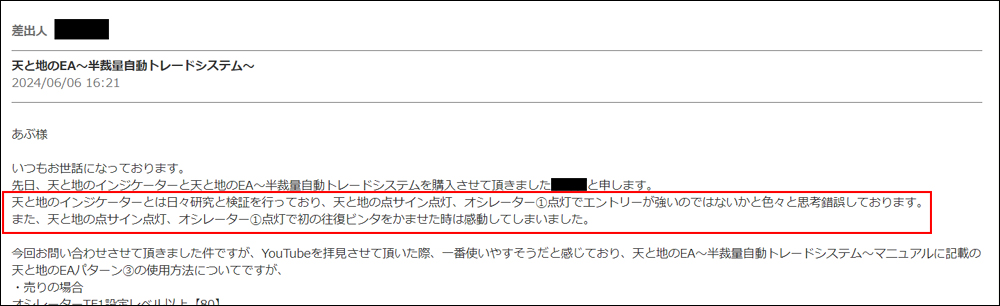
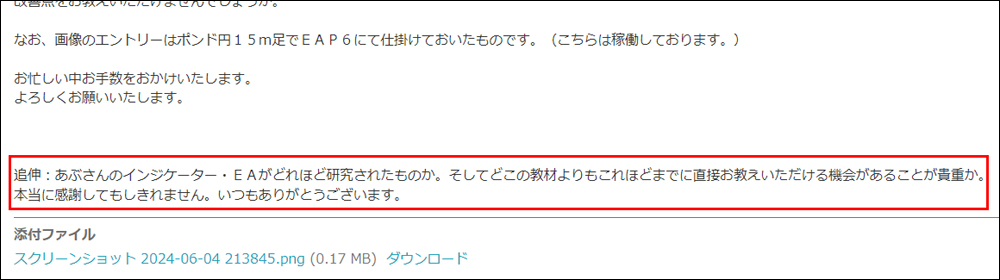
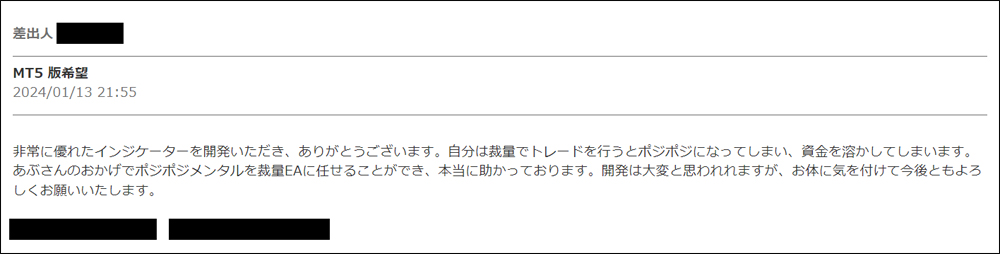
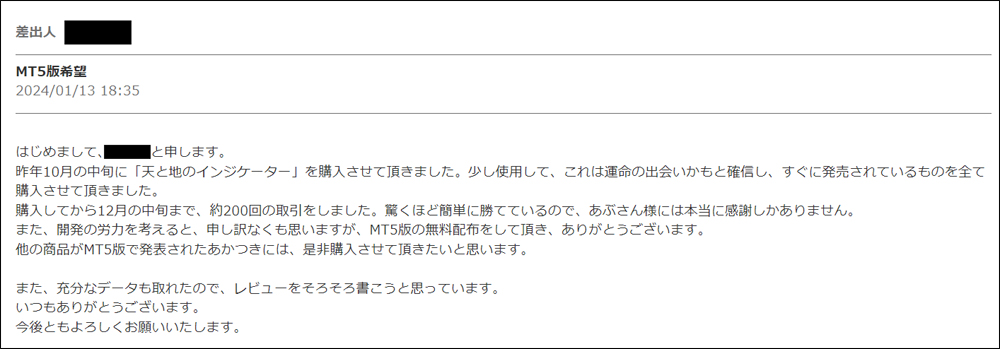
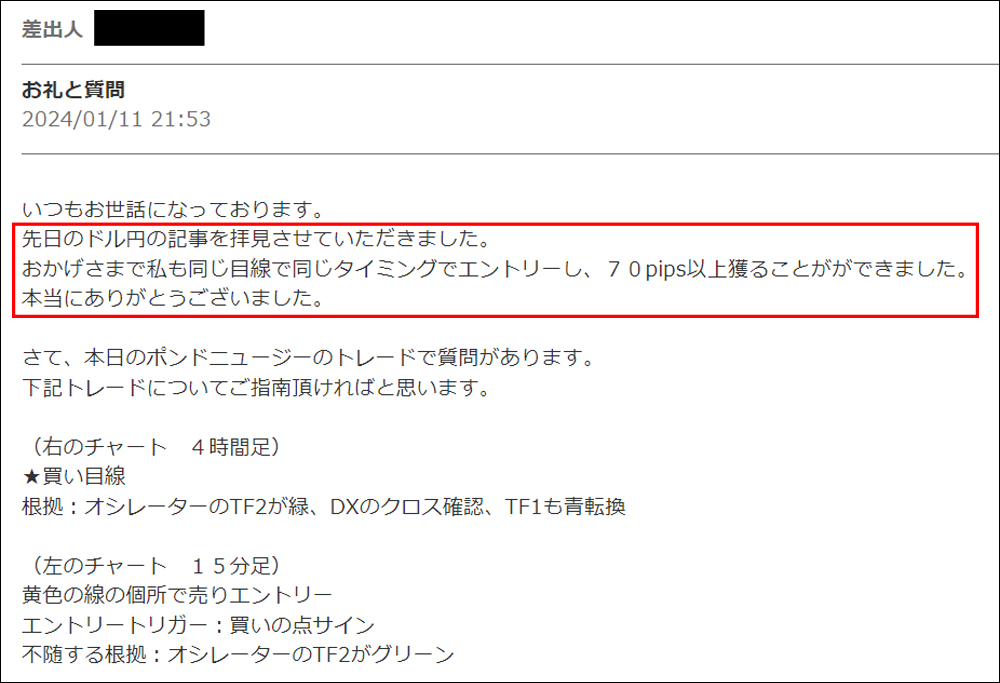
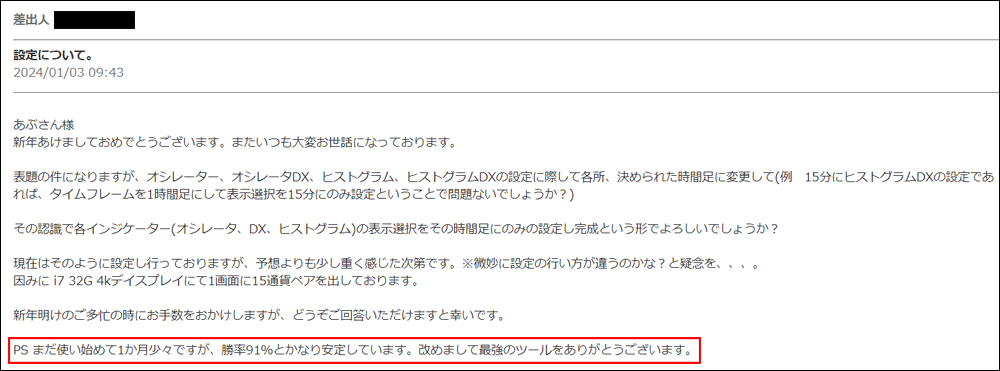
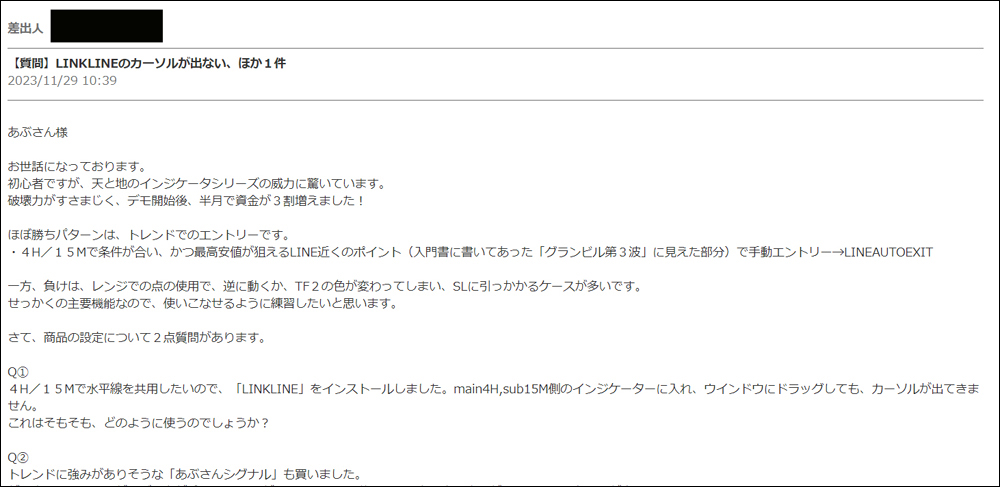
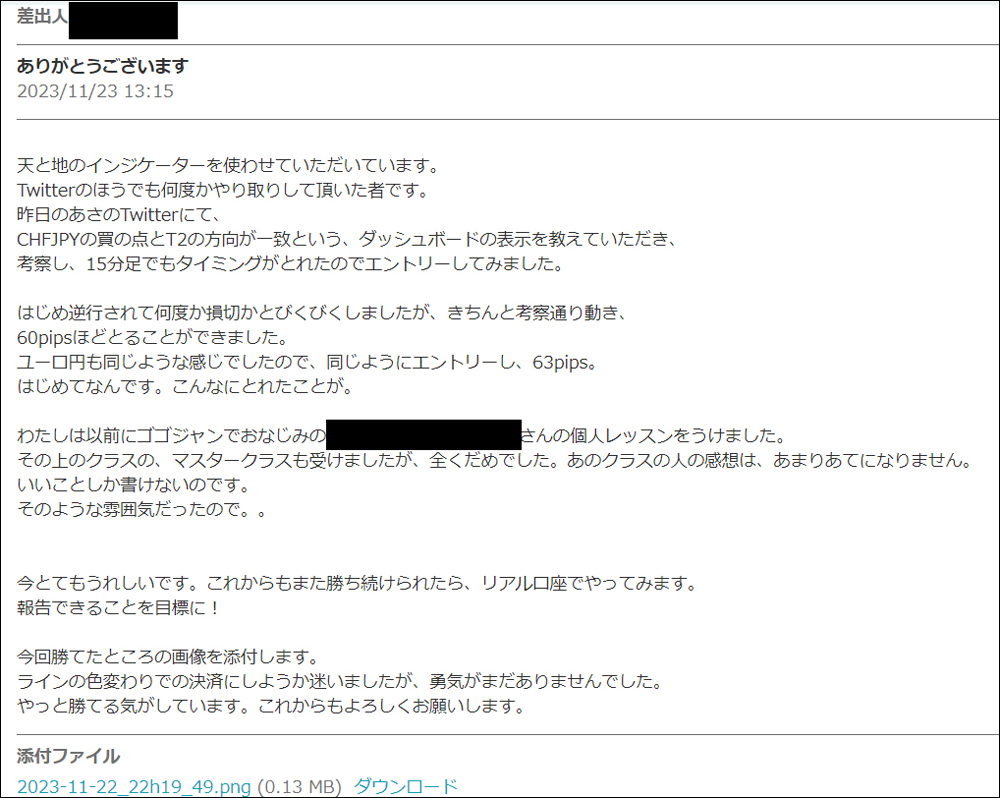
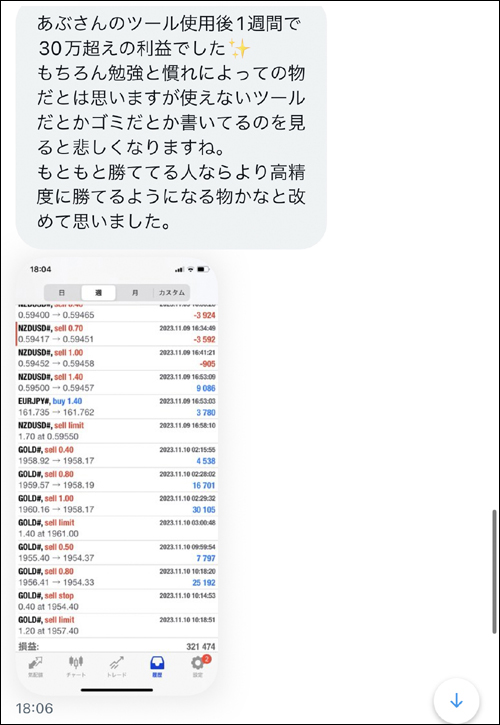
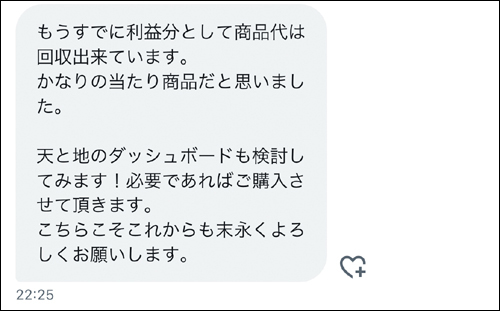
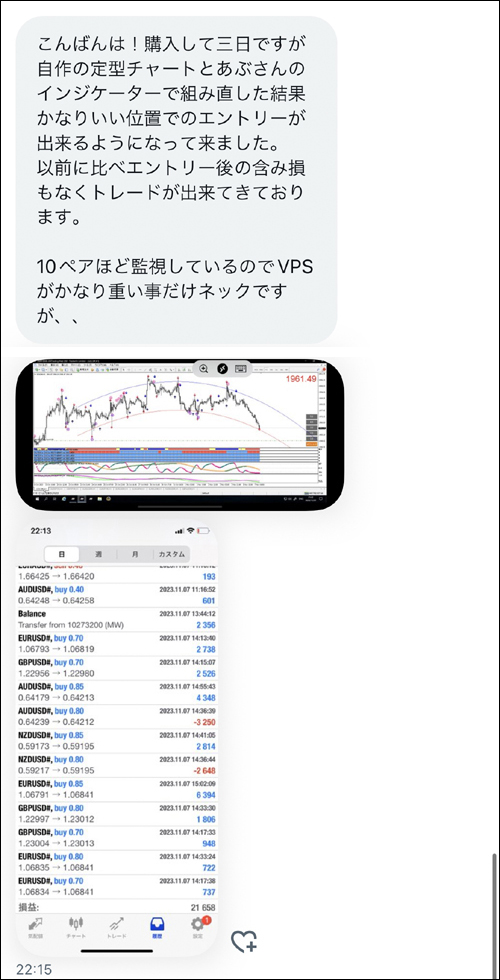
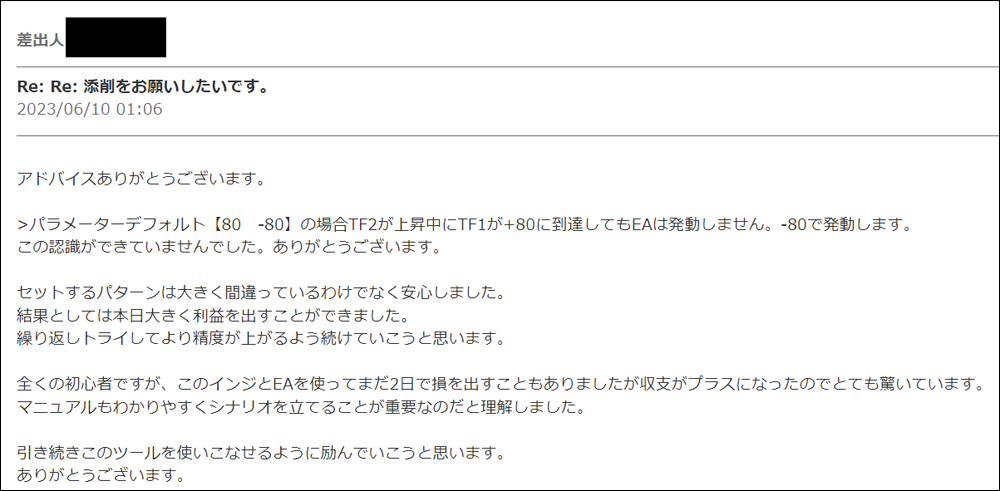
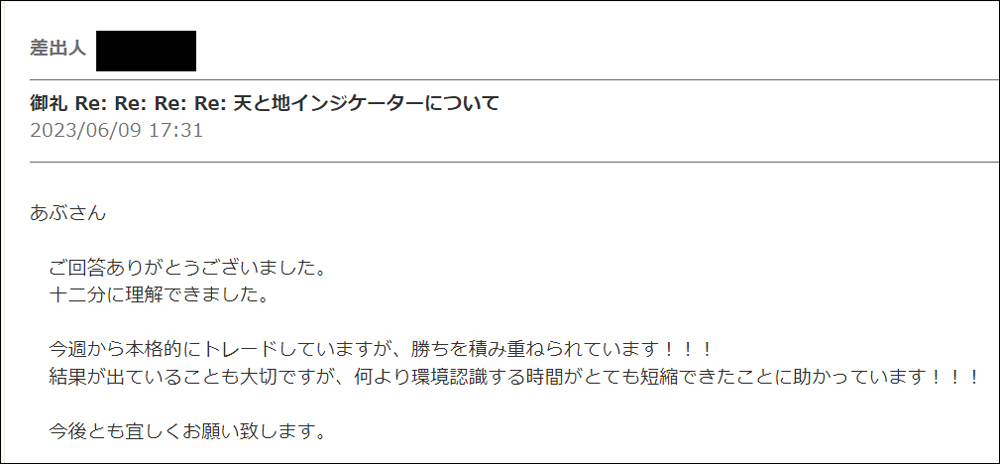
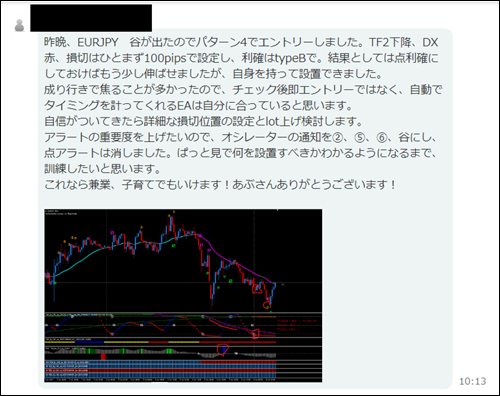
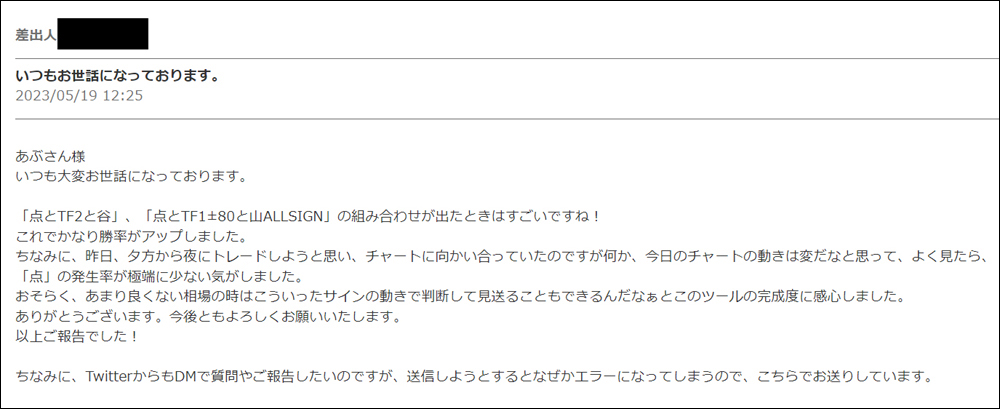
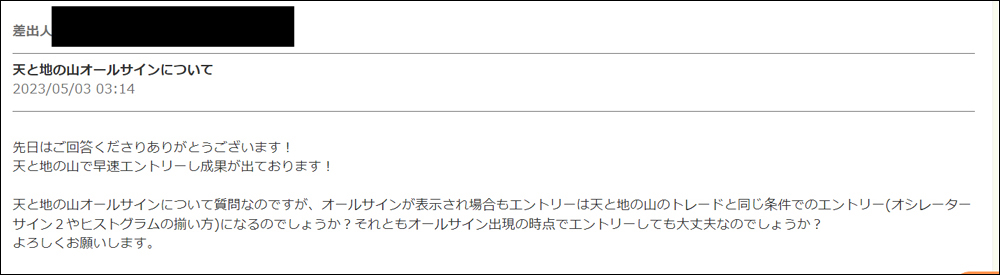
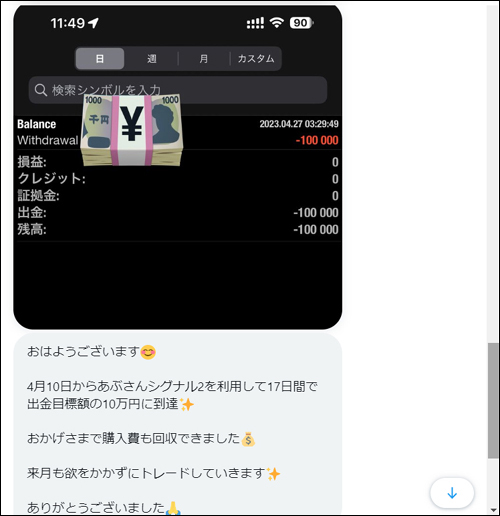
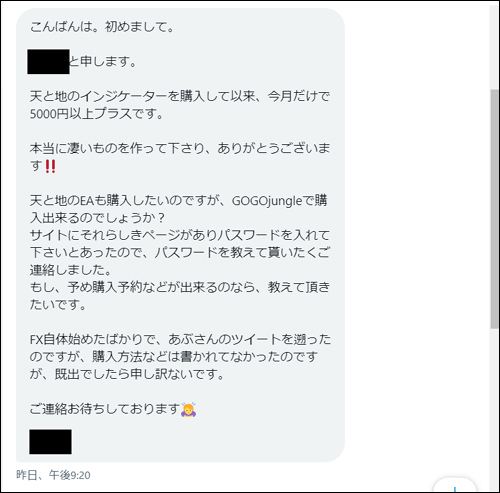
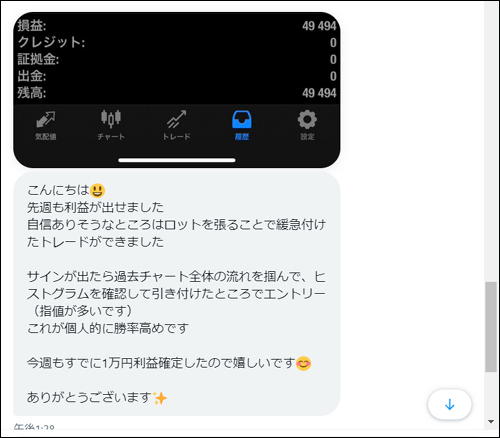
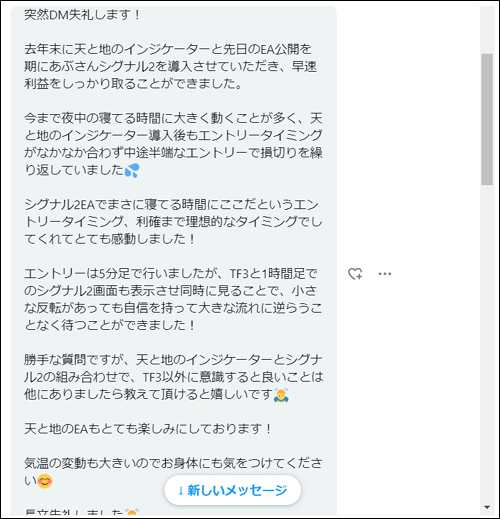
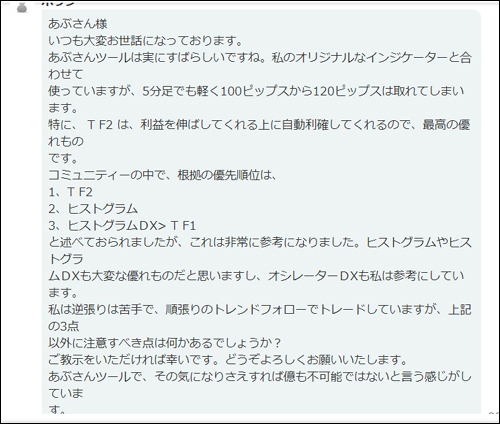
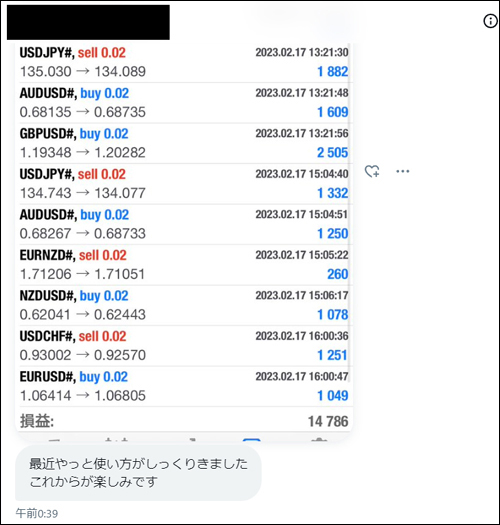
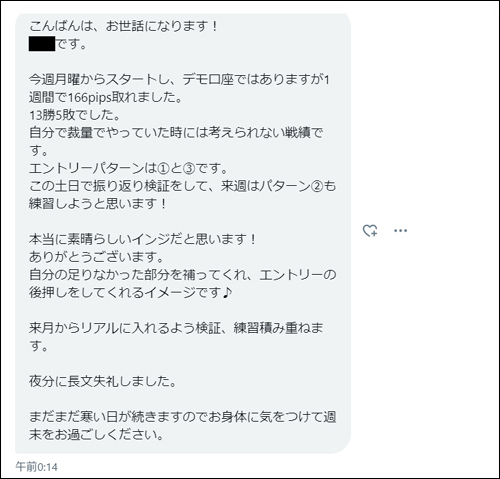
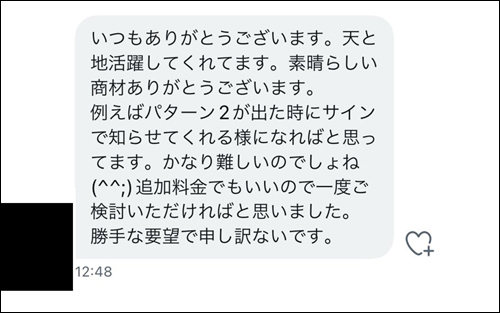
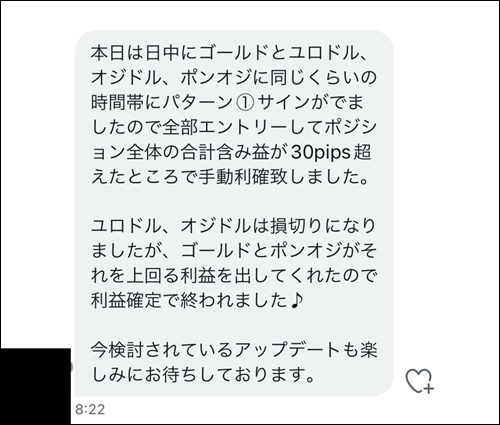
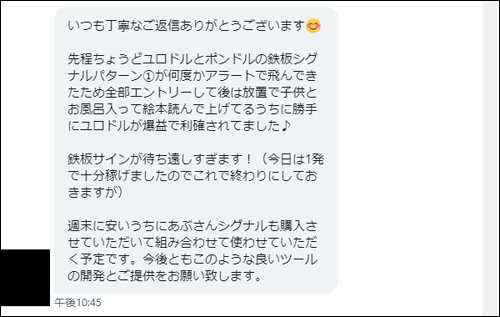
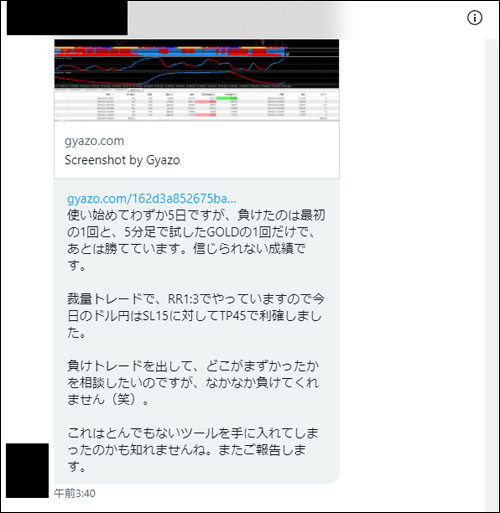
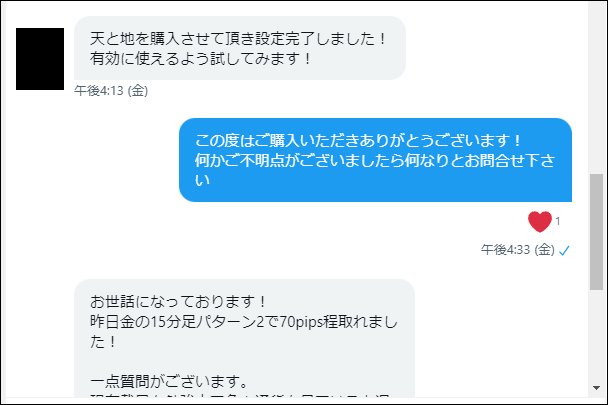
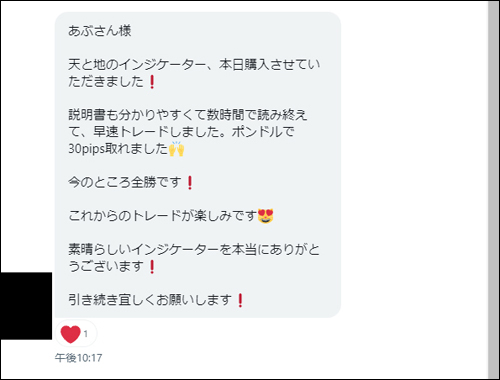
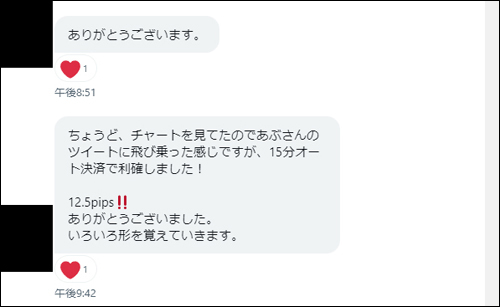
・Feelings (DM version) from users who actually used the Heaven and Earth Indicator
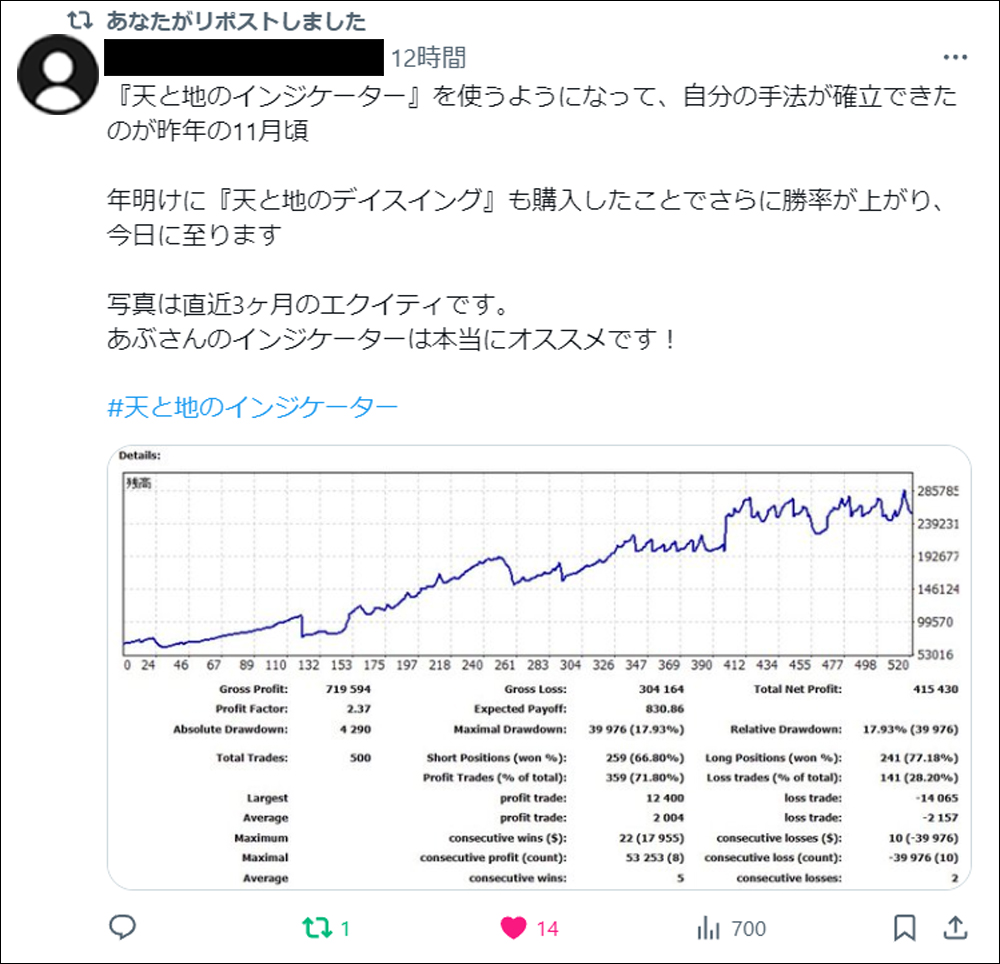
・I tried searching for “#Heaven and Earth Indicator”
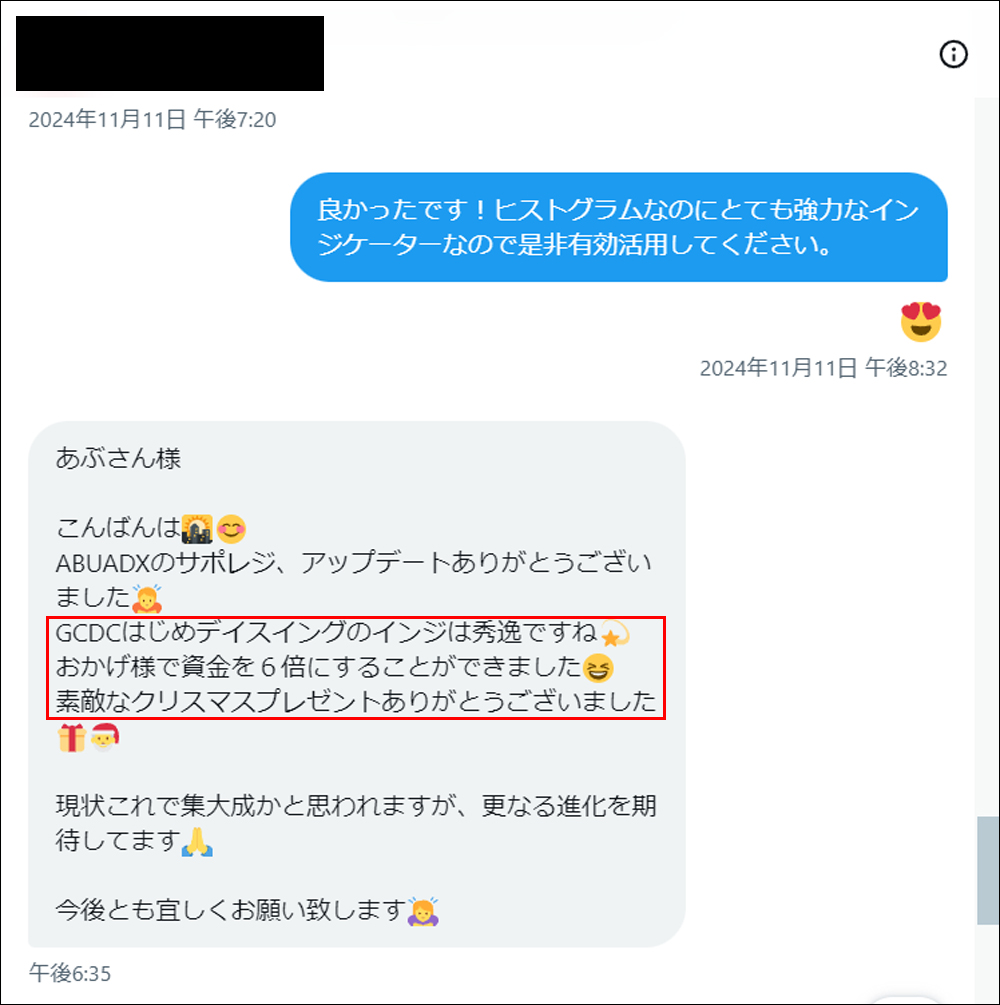
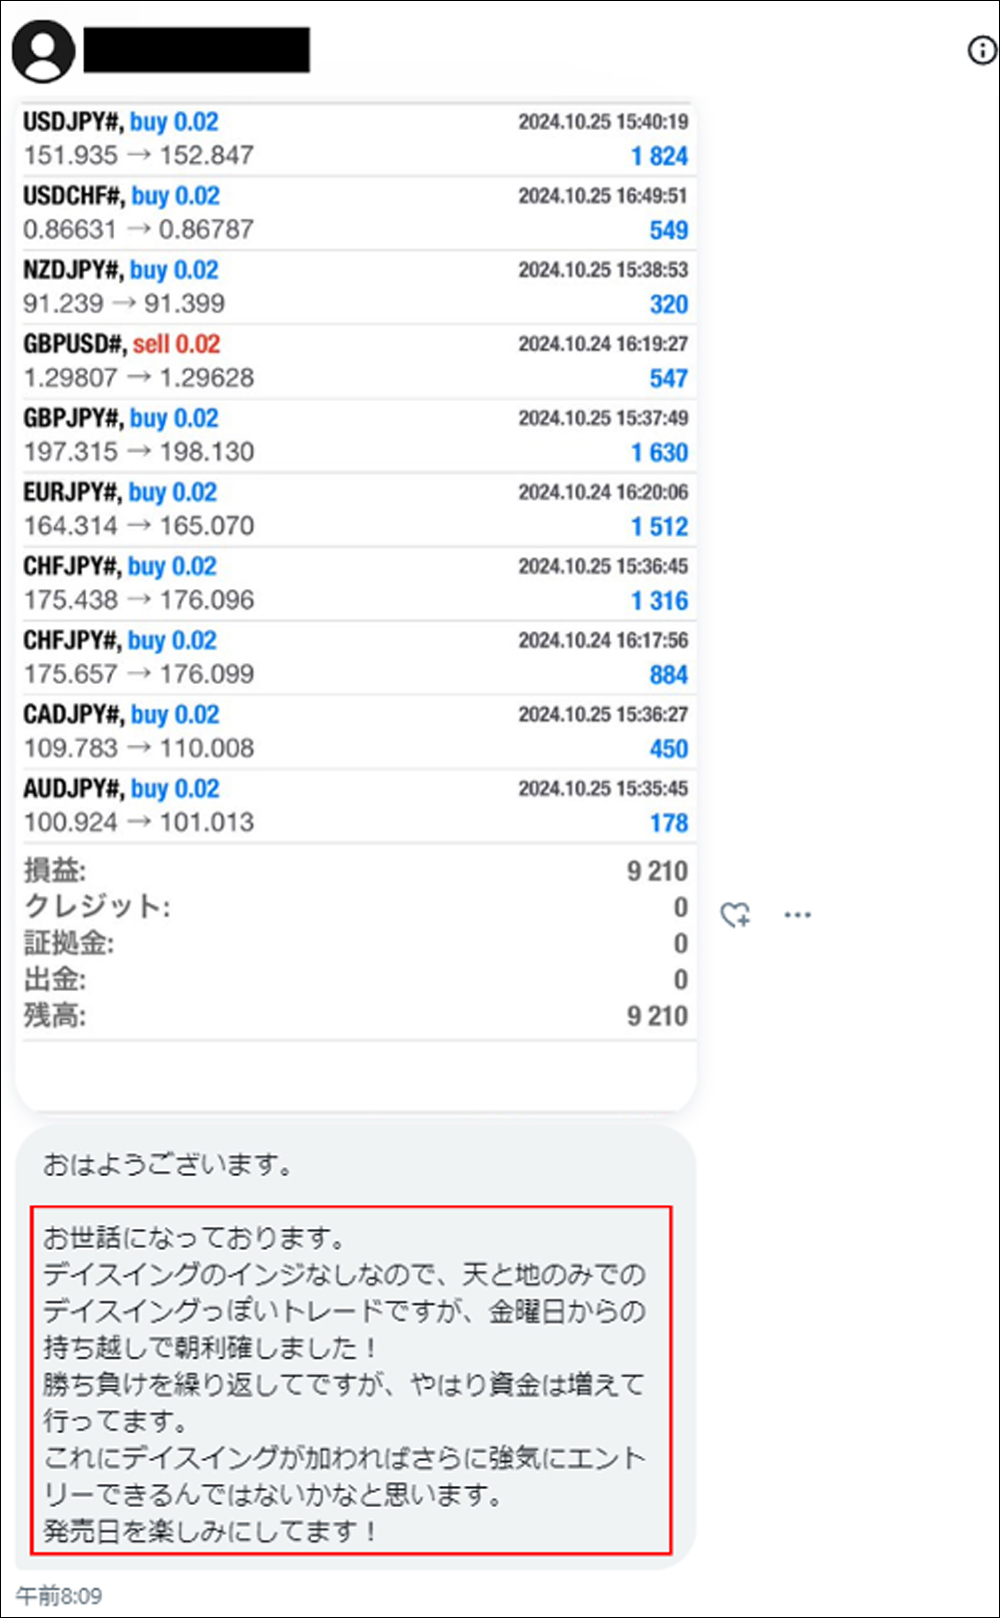
・Introducing posts from monitors who actually used the Heaven and Earth De- Swing
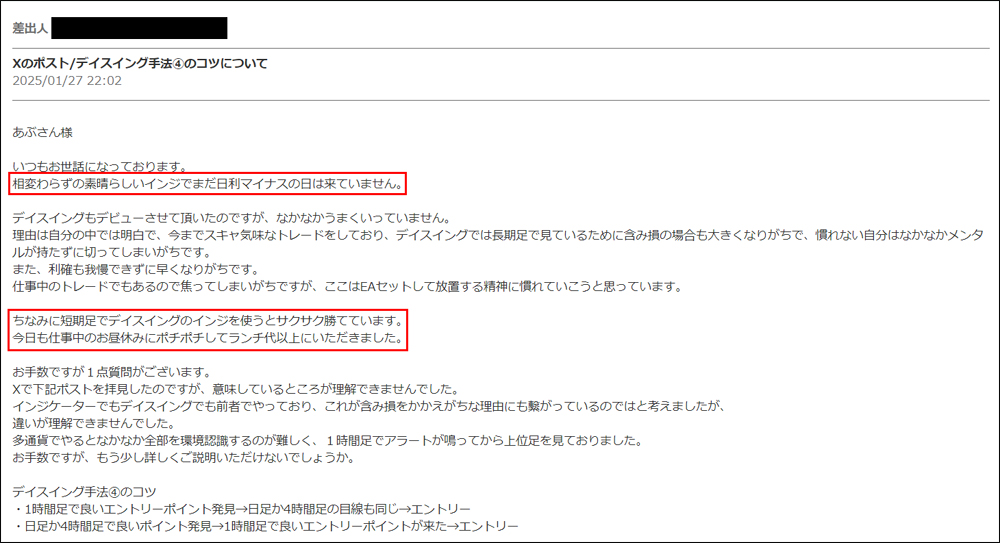
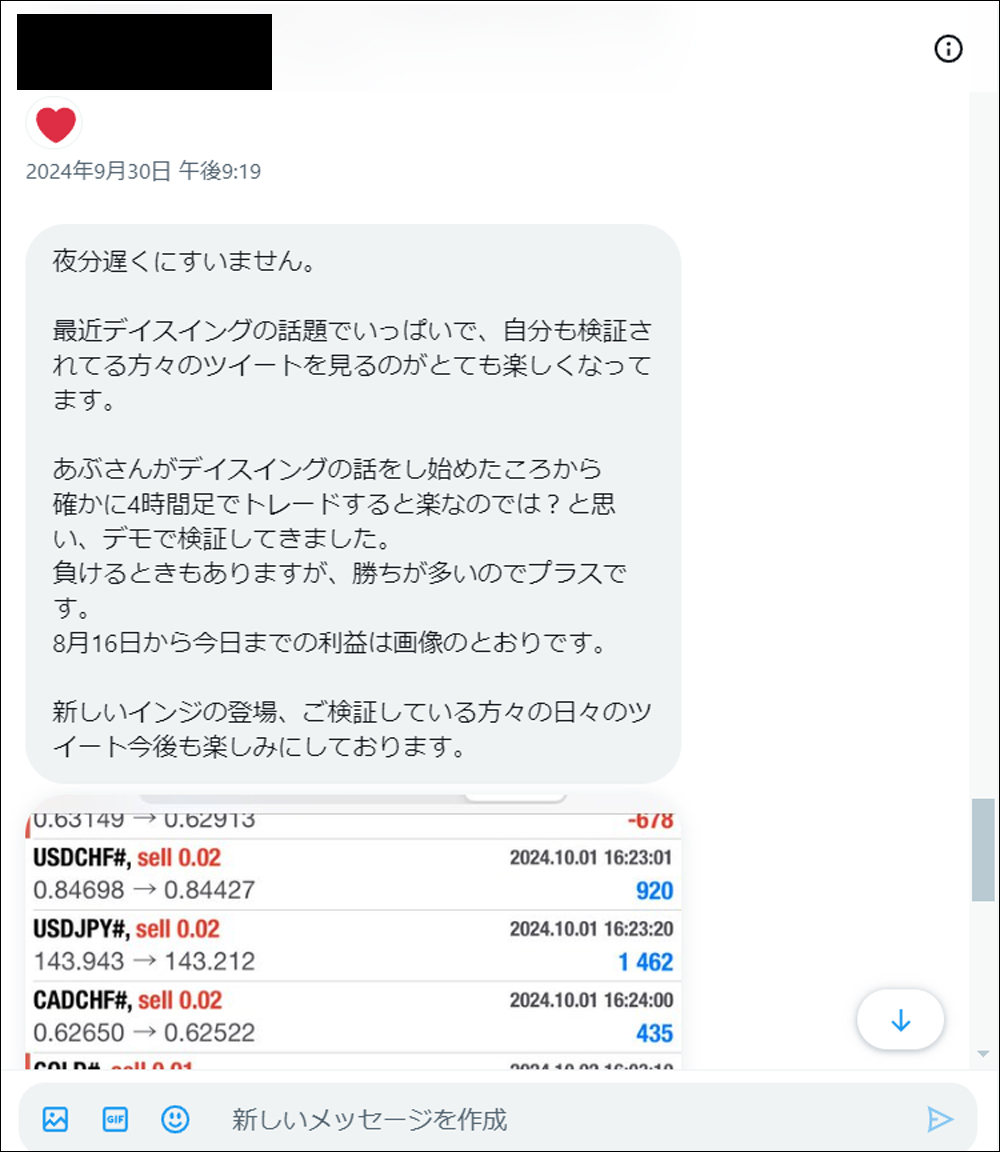
・Feelings from users who actually used the Heaven and Earth De-Swing

・Heaven and Earth Indicator is a trading method using the original indicator I, Aba, released in February 2022.Thanks to everyone's support,「GogoJungle Award 2022, 2023, 2024 has been awarded for three consecutive years.
・In this article,the “Heaven and Earth Indicator” is used to検証 and discuss the“Heaven and Earth De-Swing”De-Swing method. For the basic trading method of the Heaven and Earth Indicator, please refer toarticles before August 2024.


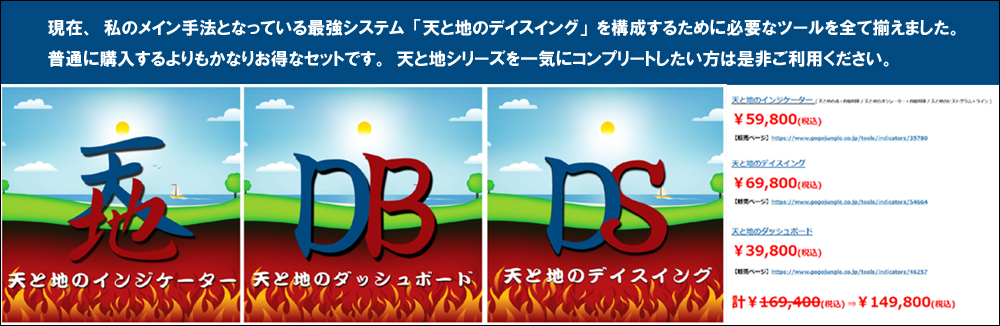
【Limited Edition】Full Heaven and Earth Set
【Aba / Special Video Vol.1】Over 3,200 enthusiasts use it! Are you still trading FX without “Heaven and Earth”? Why not earn and relax at the same time?

【Aba / Special Video Vol.2】Is it a skill gap? No, it’s equipment gap. Those who don’t use this will be vastly different.


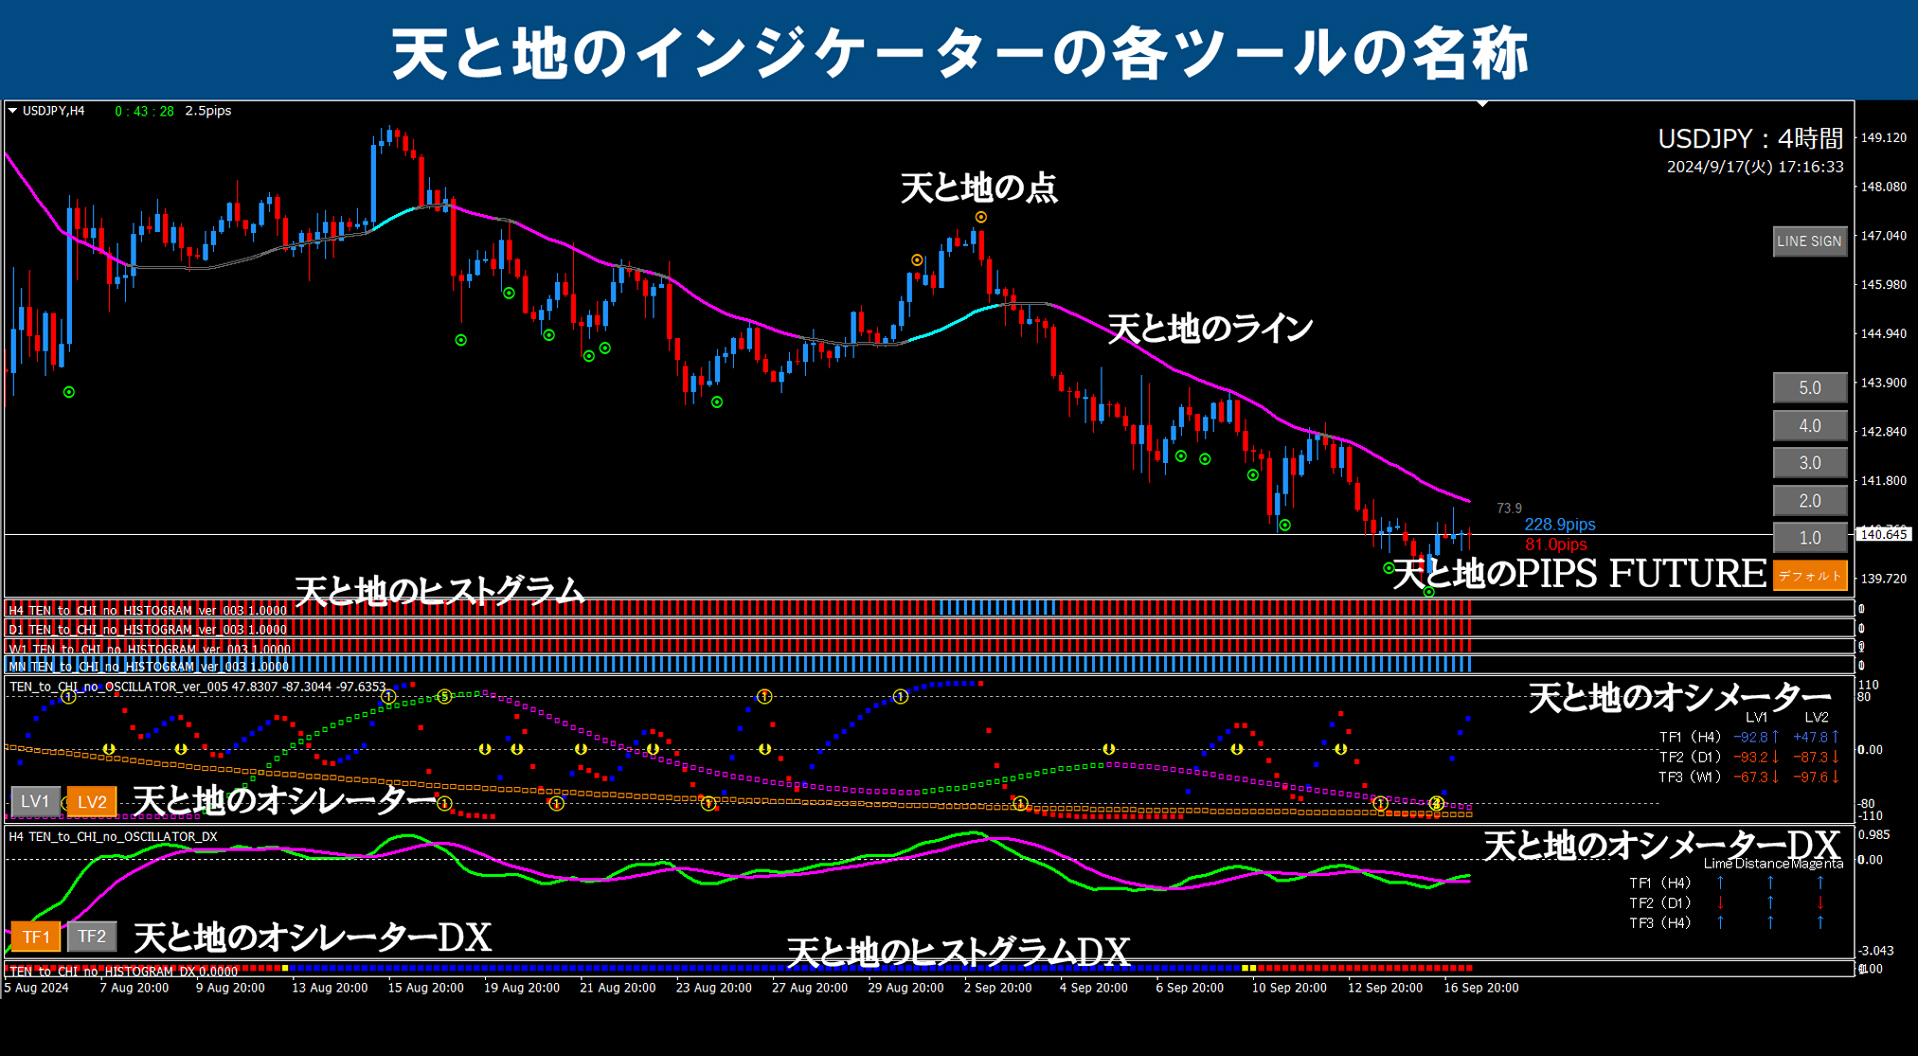
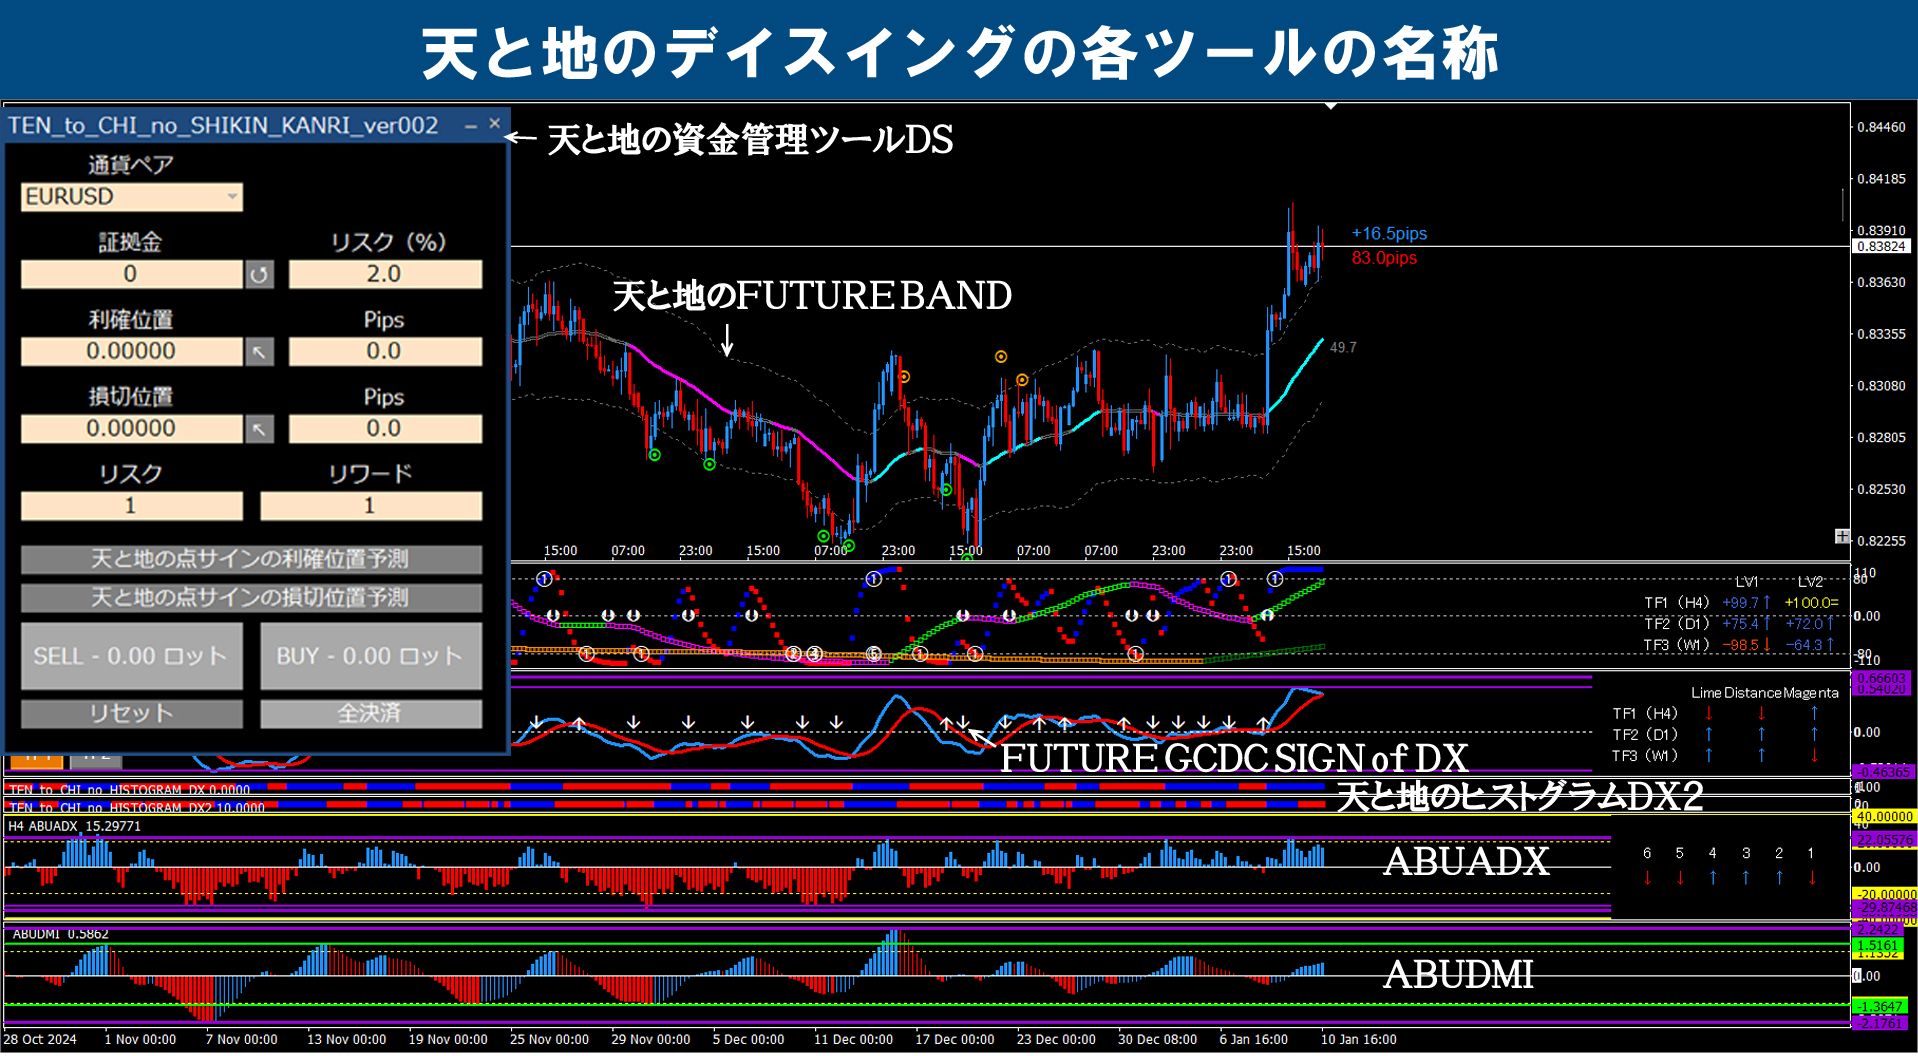
※For terms used on this blog, please refer to the image below.(All images can be clicked to enlarge)


NZDJPY / 1-hour chart + 4-hour chart + daily past verification
※ Yellow dotted lines are drawn across all time frames in the same place.
※ Yellow circles mark important points.
Click the chart to enlarge.
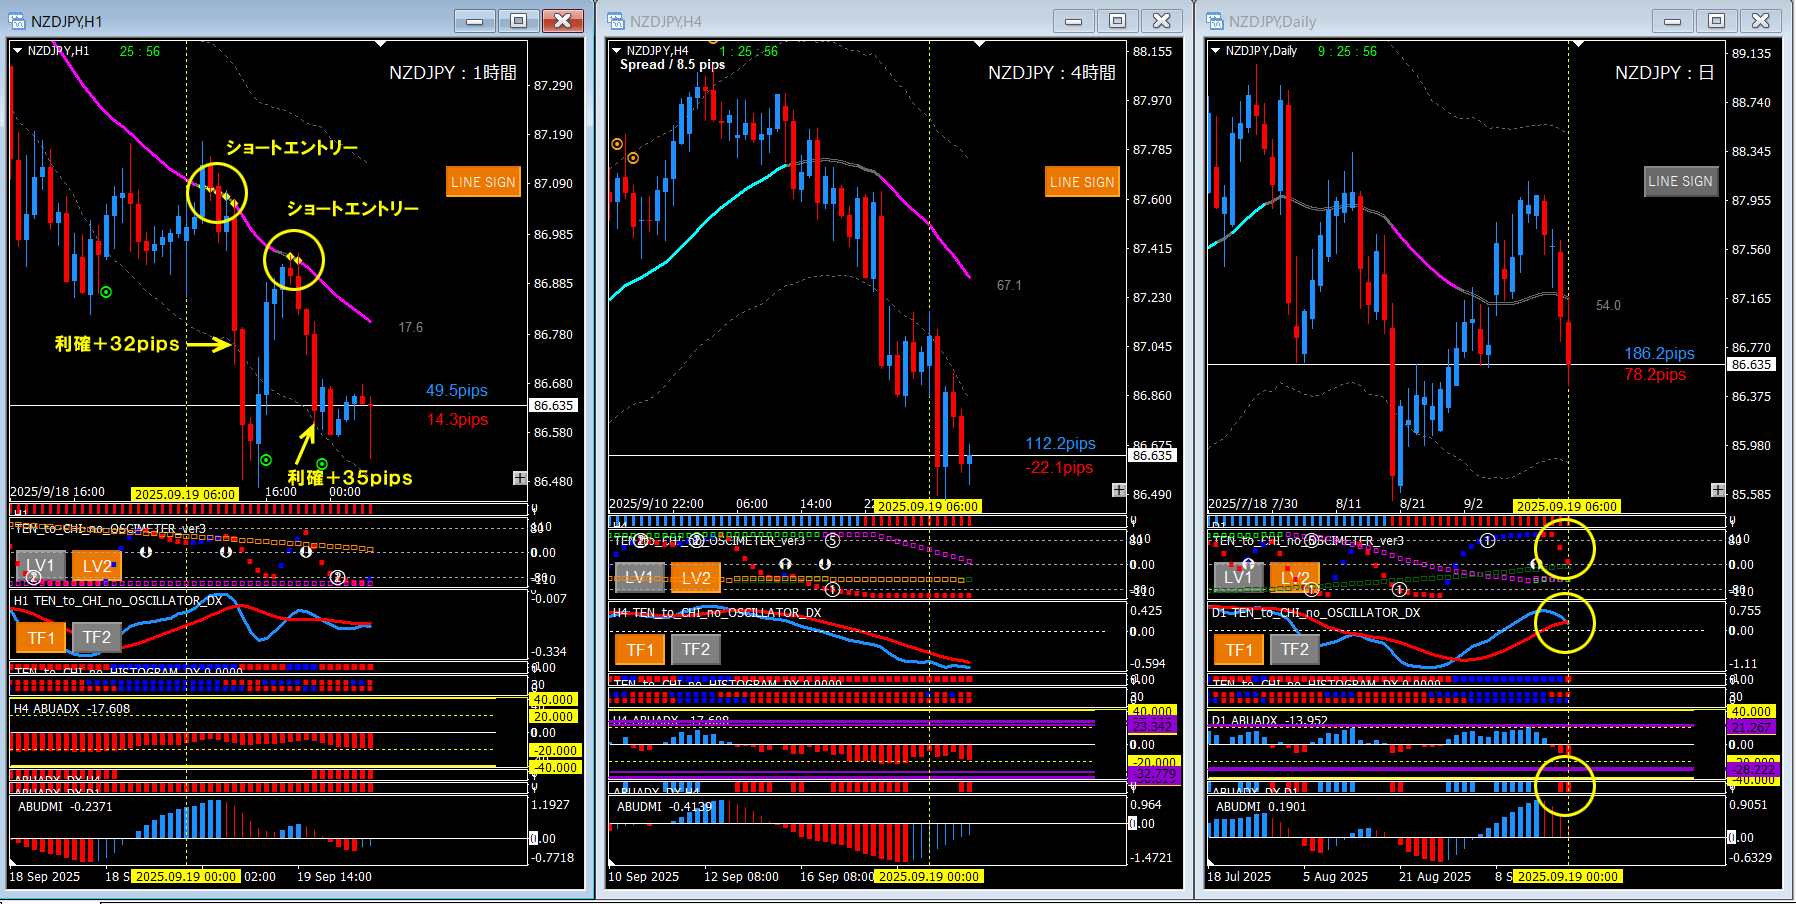
■ 1-hour chart (left: entry chart)
・Line touch entry
■ 4-hour chart (center: market context chart)
・None in particular
■ Daily chart (right: market context chart)
・Oscillator DX (shortly before a down cross)
・ABUADX_DX (red)
■ Summary
Based on the daily ABUADX_DX signal, adopt a bearish bias and look for a short entry point on the 1-hour chart. The daily oscillator DX is also near a down cross and looks good. When determining the 1-hour entry point, as long as you are aware of cross-prior to ABUDMI, you can anticipate a downward move and decide to short even if the price is currently rising, as in this example.
■ If using DSATEA
Since I judged bearish at the yellow dotted area, place a short-only setting on the 1-hour chart with DSATEA at this point. If you enter twice like this, set the DSATEA parameter count to 2. If you set multiple entry counts, be sure to enable EA stop as well. Even I, the author, have forgotten the EA stop setting in the past and ended up with meaningless automatic entries, so please be careful everyone.

I hope this is of some help to everyone.
If you press the GOOD mark, it will give us energy for future work. Thank you for your continued support to further improve our motivation.
