

Does the narrowing interest rate differential still indicate a preference for a weaker yen? Bank of Japan trade
Get valuable methods at a discount with a great coupon!!

Reviews & videos can be viewed here
Good morning everyone.
Yesterday's Bank of Japan kept rates unchanged as scheduled.
Since there were early expectations of a Federal Reserve rate cut and BOJ keeping steady, is it fair to say the market had already priced it in?
Economic indicators and influential remarks can have strong dopaminergic effects and often move only for a moment, but sometimes they continue moving in the direction of that initial movement.
In my feel, it’s like 70% blip and 30% continuous momentum due to dopamine effects.
Out of 10 indicators, if you go contrarian 7 times and trend-following 3 times, then if you went contrarian all the time you would win 7 times and come ahead.
You end up taking positions based on predicting some level bottoms, and you believe the trigger points exist in the past.
Yesterday’s USD/JPY 1-hour and 1-minute charts
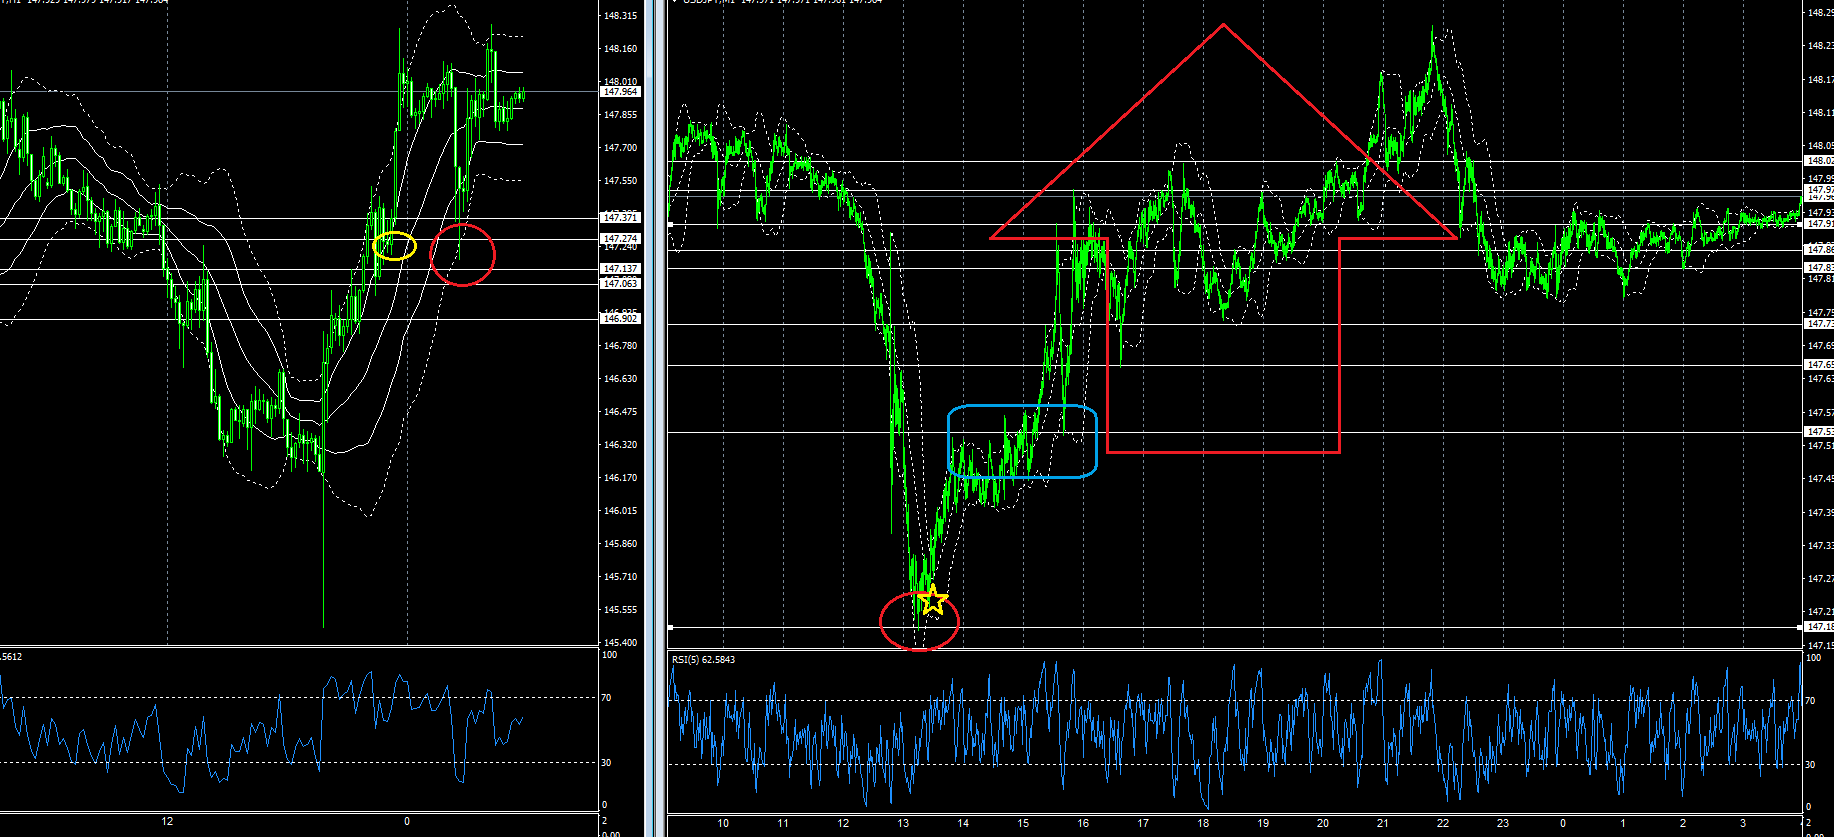
Took a long position at the right 1-minute yellow star and took profit just before the London session started.
It turned into quite a substantial profit after a long time.
Around 1 million yen profit (20 lots of 1 million each)
Why did I go long at the yellow star in the first place? Because I judged the red circle vicinity as the first bottom, and if you enter a long position above the bottom with a stop loss near the red circle low, even if a decline occurs, you’ll incur only a small loss.
I monitor how to cross the white horizontal line breakout on the left 1-hour chart.
The stopping points, like yellow circles, and past values seem quite important.
But this can be luck sometimes, so the method of waiting and the timing of taking positions are key.
With that in mind, while watching the 1-minute chart, you should have a stance and habit of entering, calculating that if you enter now and fail, you can cut losses to about 5 pips, and participate with a plan.
In the end, the chart shows a full retrace of the drop over about 8 hours.
Especially the initial breakout of the blue square range zone from the breakout line had high volatility, so I think the success rate was high.
When volatility is high, volume tends to be larger, so you adjust the breakout line timing accordingly.
If you misfire while buying the dips, often you get a rebound from the lower breakout line.
Keep that in mind, and if you fail next time, don’t just abandon—consider re-entering a position.
Charts reflect outcomes, but when buying increases, it tends to be sold, and when selling increases, it tends to be bought.
With that mindset and watching breakout lines and volume, you’ll grasp timing more easily.
Yesterday BoJ fell on the cash rate, and then fully retraced at Governor Ueda’s press conference.
Interest rate differentials are narrowing, but it ends up being bought on the downside and rising from there.
If this is just a rebound, fine, but after the Koizumi-era birth day, it would follow the Kishida- Ishiba line, and things could get even more disastrous than Kishida-Ishiba.
Public funds will be used to allow them to live freely and to back up by other countries.
I think that color will deepen under the Koizumi administration.
Is there any point in airing the process of a leadership election that the public cannot choose on TV?
Often they say, "It's a battle."
There are candidates who say that, but
What battle are you talking about?
It's a strange country indeed.
What I recommend as a trader are the following three products.
Shin: The New Millionaire Trader's Scalping: Volume Plus
FX Trading: Unconventional Hedging
Explosion-born Indicator: Turning into a Winning Trader
That’s all.
Thank you for your continued support today as well.